EUR/USD Technical Analysis Summary
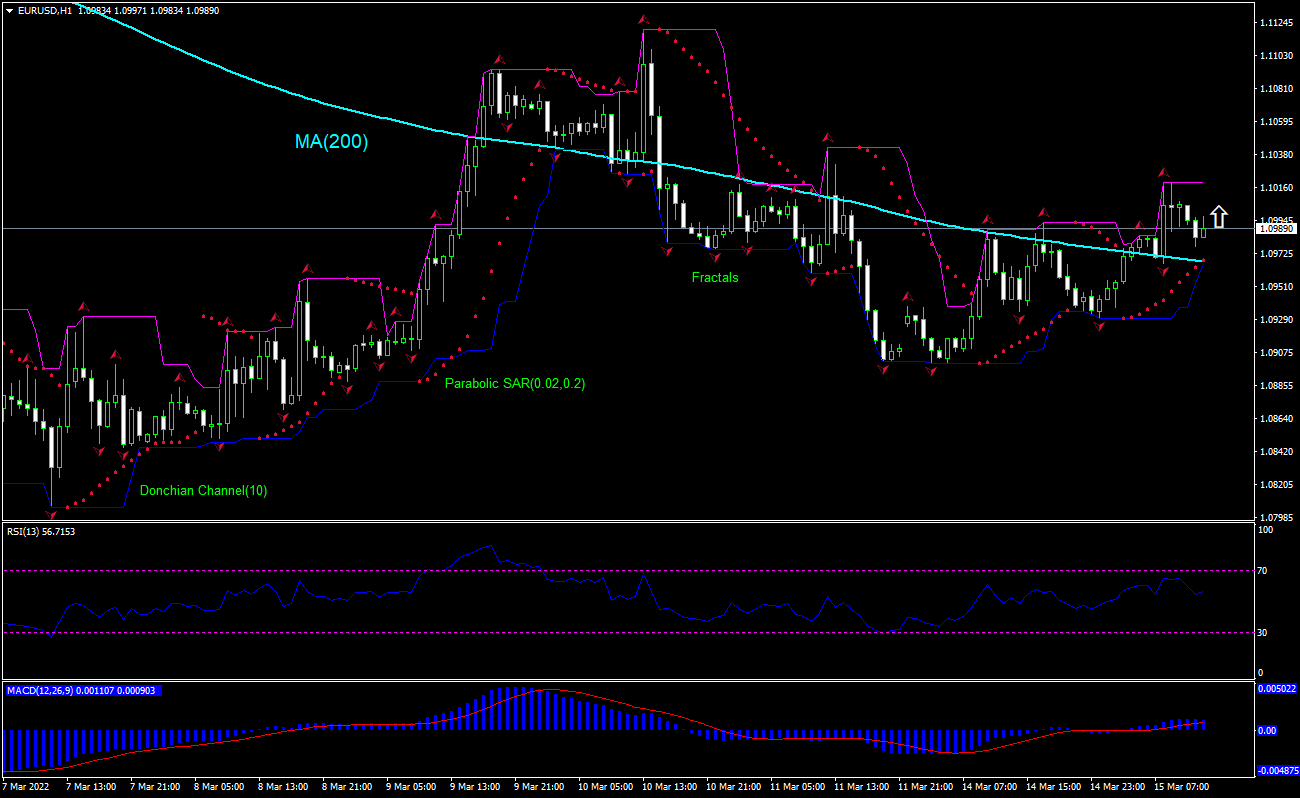
Buy Stop: Above 1.1019
Stop Loss: Below 1.0966
| Indicator | Signal |
|---|---|
| RSI | Neutral |
| MACD | Sell |
| Donchian Channel | Buy |
| MA(200) | Buy |
| Fractals | Buy |
| Parabolic SAR | Buy |
EUR/USD Chart Analysis
EUR/USD Technical Analysis
The technical analysis of the EURUSD price chart on 1-hour timeframe shows EURUSD: H1 has breached above the 200-period moving average MA(200) and is retracing up after hitting one-week low yesterday. We believe the bullish momentum will continue after the price breaches above the upper bound of the Donchian channel at 1.1019. A level above this can be used as an entry point for placing a pending order to buy. The stop loss can be placed below 1.0966. After placing the order, the stop loss is to be moved to the next fractal low, following Parabolic signals. Thus, we are changing the expected profit/loss ratio to the breakeven point. If the price meets the stop loss level without reaching the order, we recommend cancelling the order: the market has undergone internal changes which were not taken into account.
Fundamental Analysis of Forex - EUR/USD
German ZEW economic sentiment deteriorated sharply in March. Will the EURUSD price continue rebounding?
German ZEW economic sentiment deteriorated sharply in March. The ZEW survey results showed German ZEW economic sentiment index dropped to -39.3 for March from 54.3 for February. This is bearish for EURUSD. However, the current technical setup is bullish.