In this technical blog, we are going to take a look at the past performance of EURCAD, Daily cycle Charts that we presented to our members. In which, the major decline from 19 March 2019 peak showed an incomplete sequence to the downside. Favored for another extension lower into the buying area for a major turn around. Therefore, our members knew that the next big swing opportunity remains to buy the dip at the blue box area. We will explain the Elliott wave structure & buying opportunity our members took below:
EURCAD Elliott Wave Chart From 7.10.2019
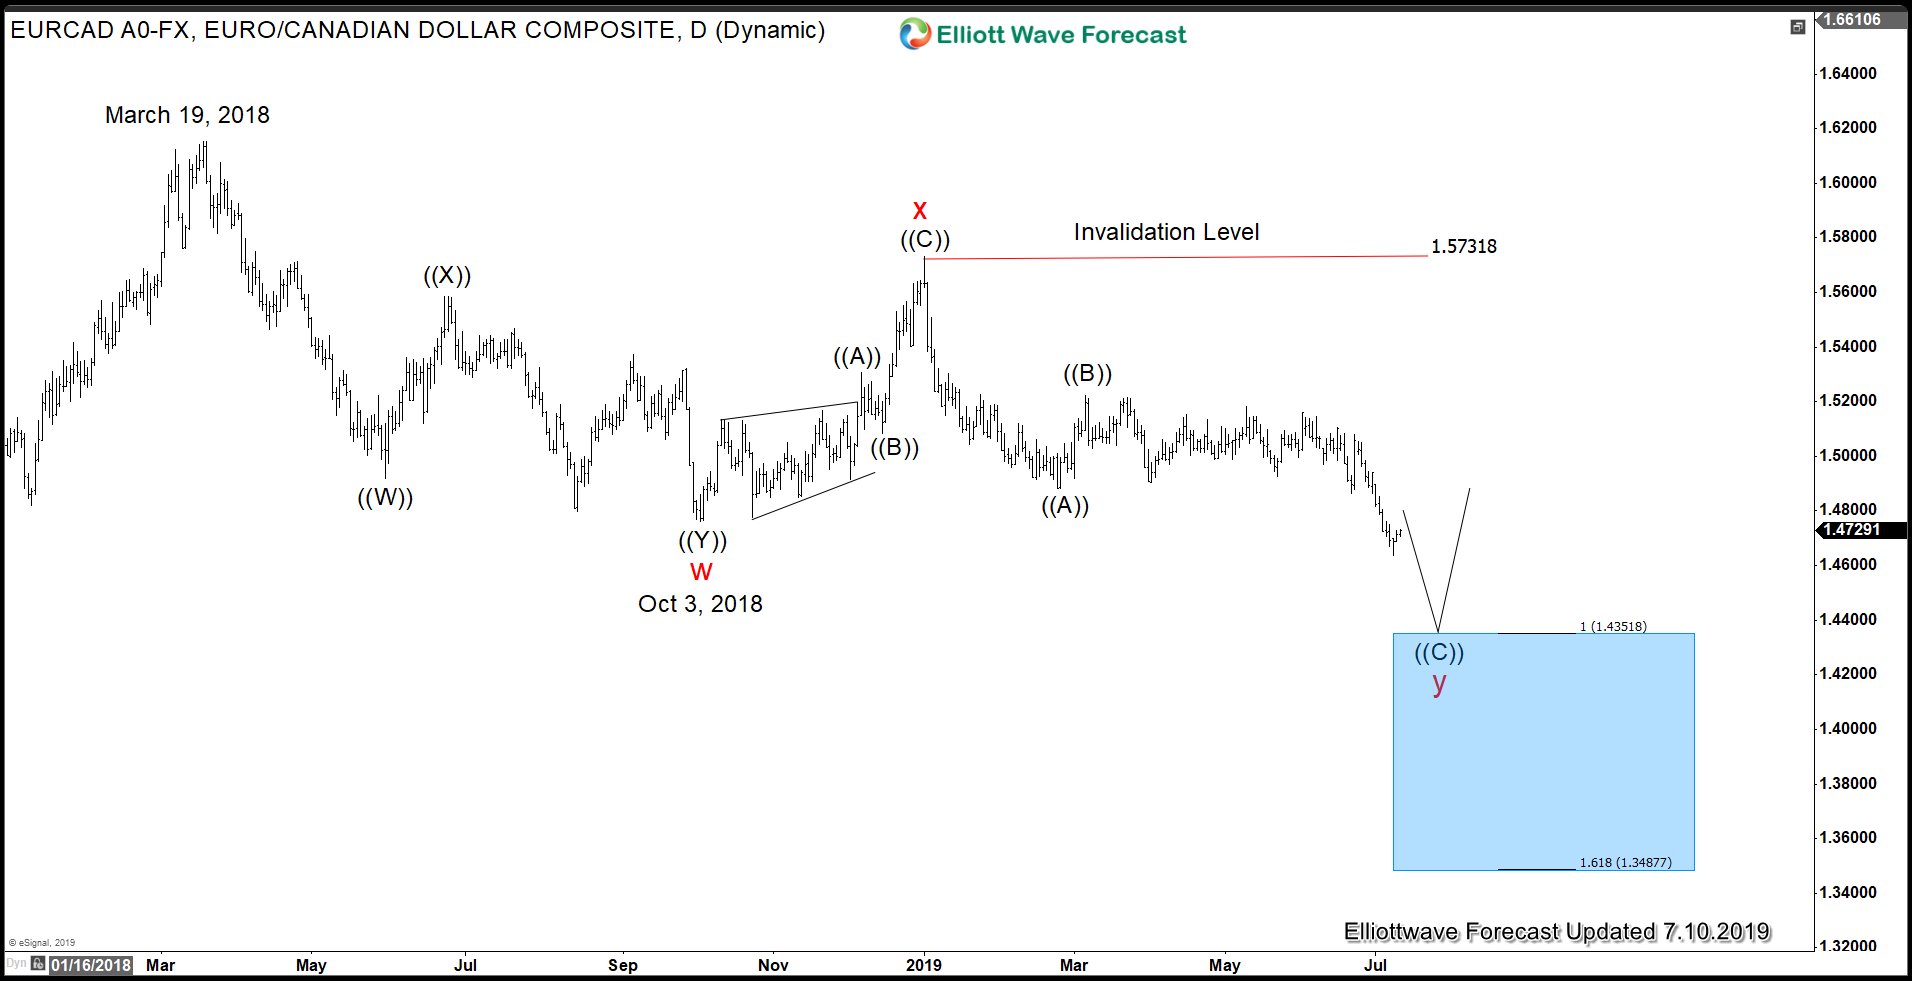
EURCAD Daily Elliott Wave Chart from July last year showed an incomplete sequence to the downside. While the internals of that pullback unfolded as Elliott wave double three structure where wave w ended in 3 swings at 1.4761. Wave x bounce ended with another 3 swing bounce at 1.5731 high. And wave y was expected to reach 1.4351-1.3487 100%-161.8% Fibonacci extension area of w-x. From there, the buyers were expected to appear to do a big 3 wave reaction higher at least.
EURCAD Daily Elliott Wave Chart From 4.05.2020
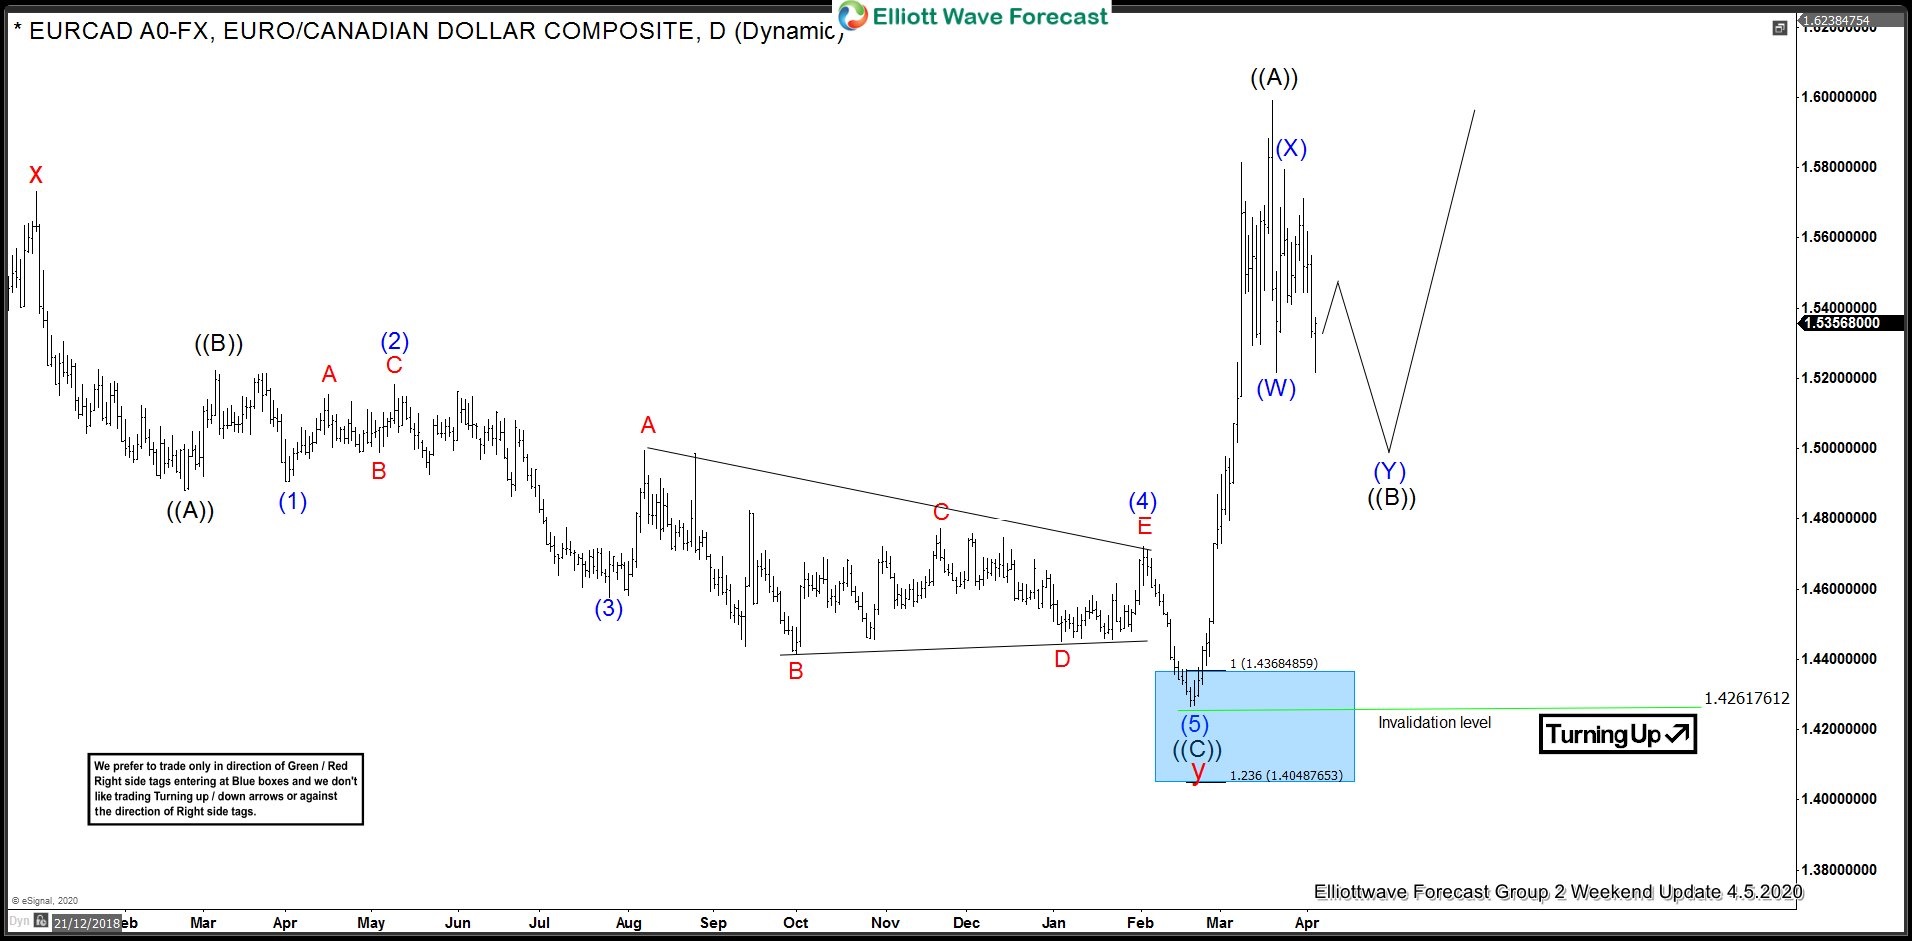
EURCAD Daily Elliott Wave Chart From 4/05/2020 updated, in which the pair managed to reach the blue box area as expected. And showing the strong reaction higher taking place from the blue box area. Allowed members to create a risk-free position shortly after taking the longs at the blue box area.