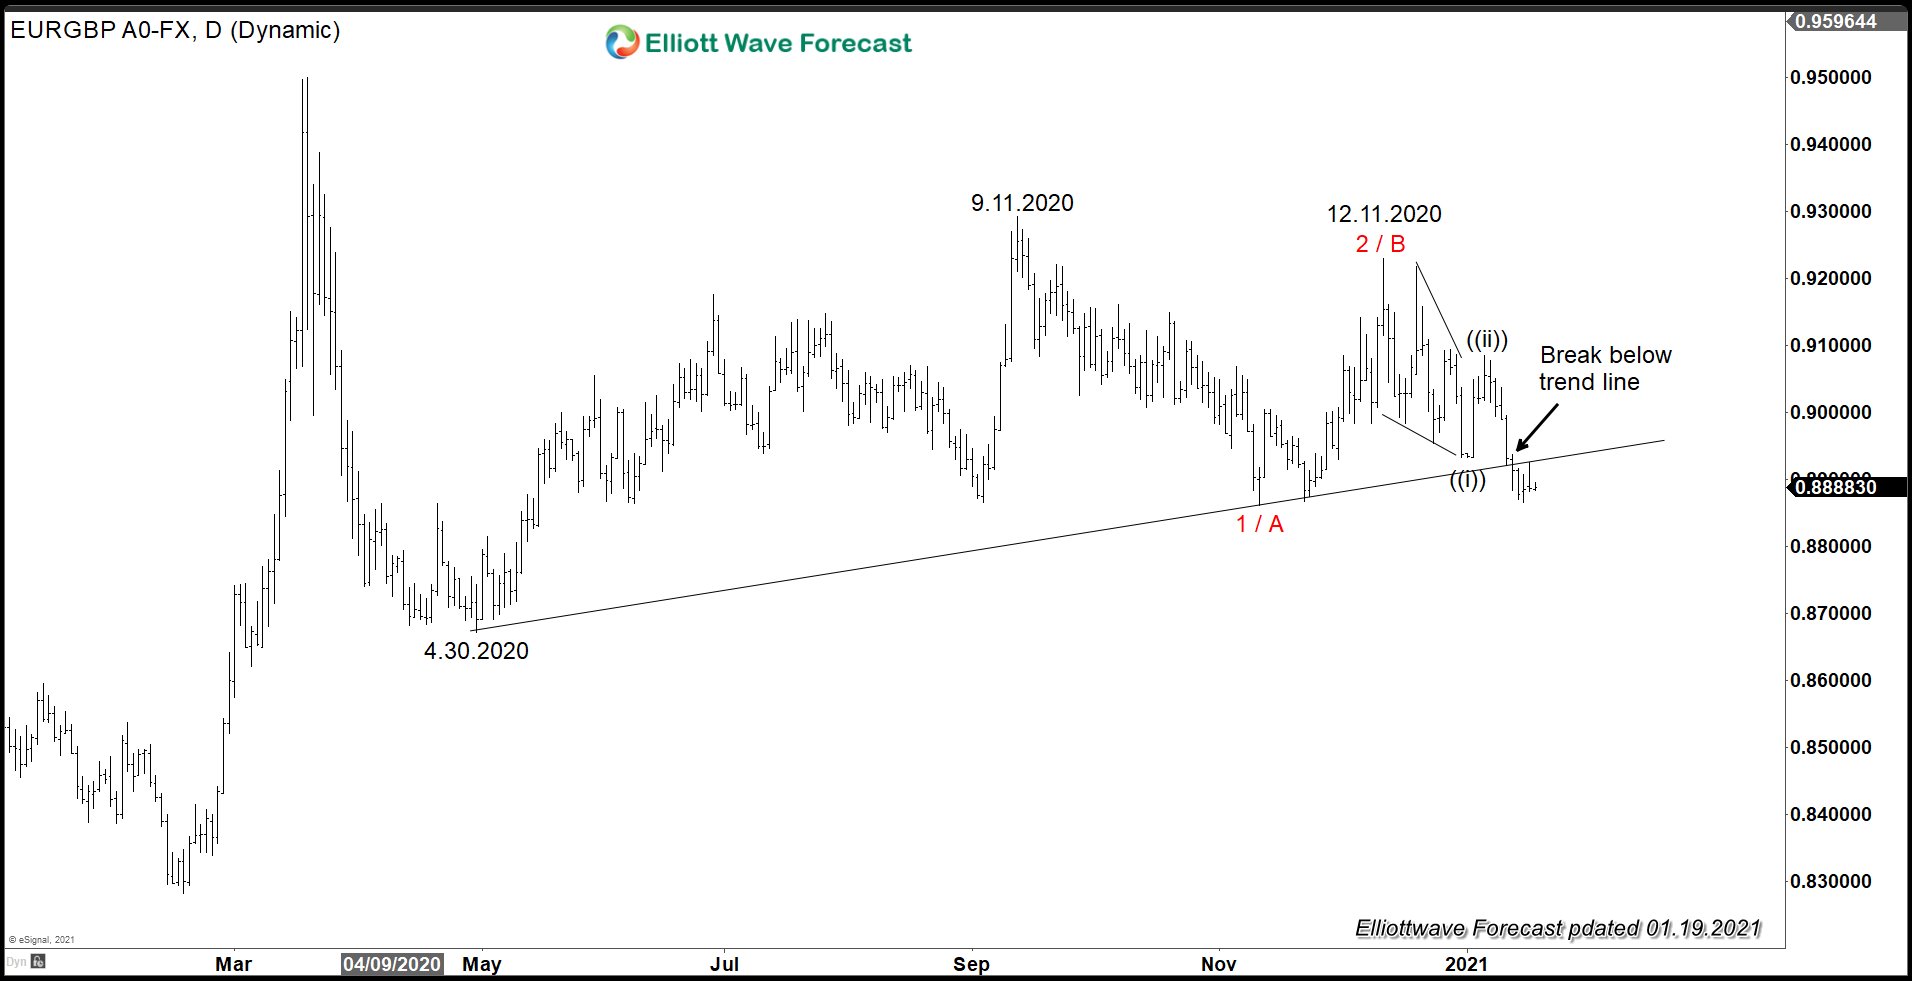
Since earlier this year, EURGBP has been trending lower due to the risk of Brexit off the table and optimism of UK’s vaccination program. We forecasted the move lower in EURGBP in our article on January 19 here --> Pound Sterling Gains as UK Accelerated Vaccine programme . We highlighted in January’s article that EURGBP breaks the ascending trend line from 4.30.2020 as the chart below shows:
EURGBP Daily Chart from January 19 shows pair breaking trend line
We argued that the good news from UK and also break below the trend line portends a strong move lower. We were right and pair extended lower 500 pips to 0.85 in the next 4 months. Lately EURGBP has started to rally but it should soon resume the move to the downside.
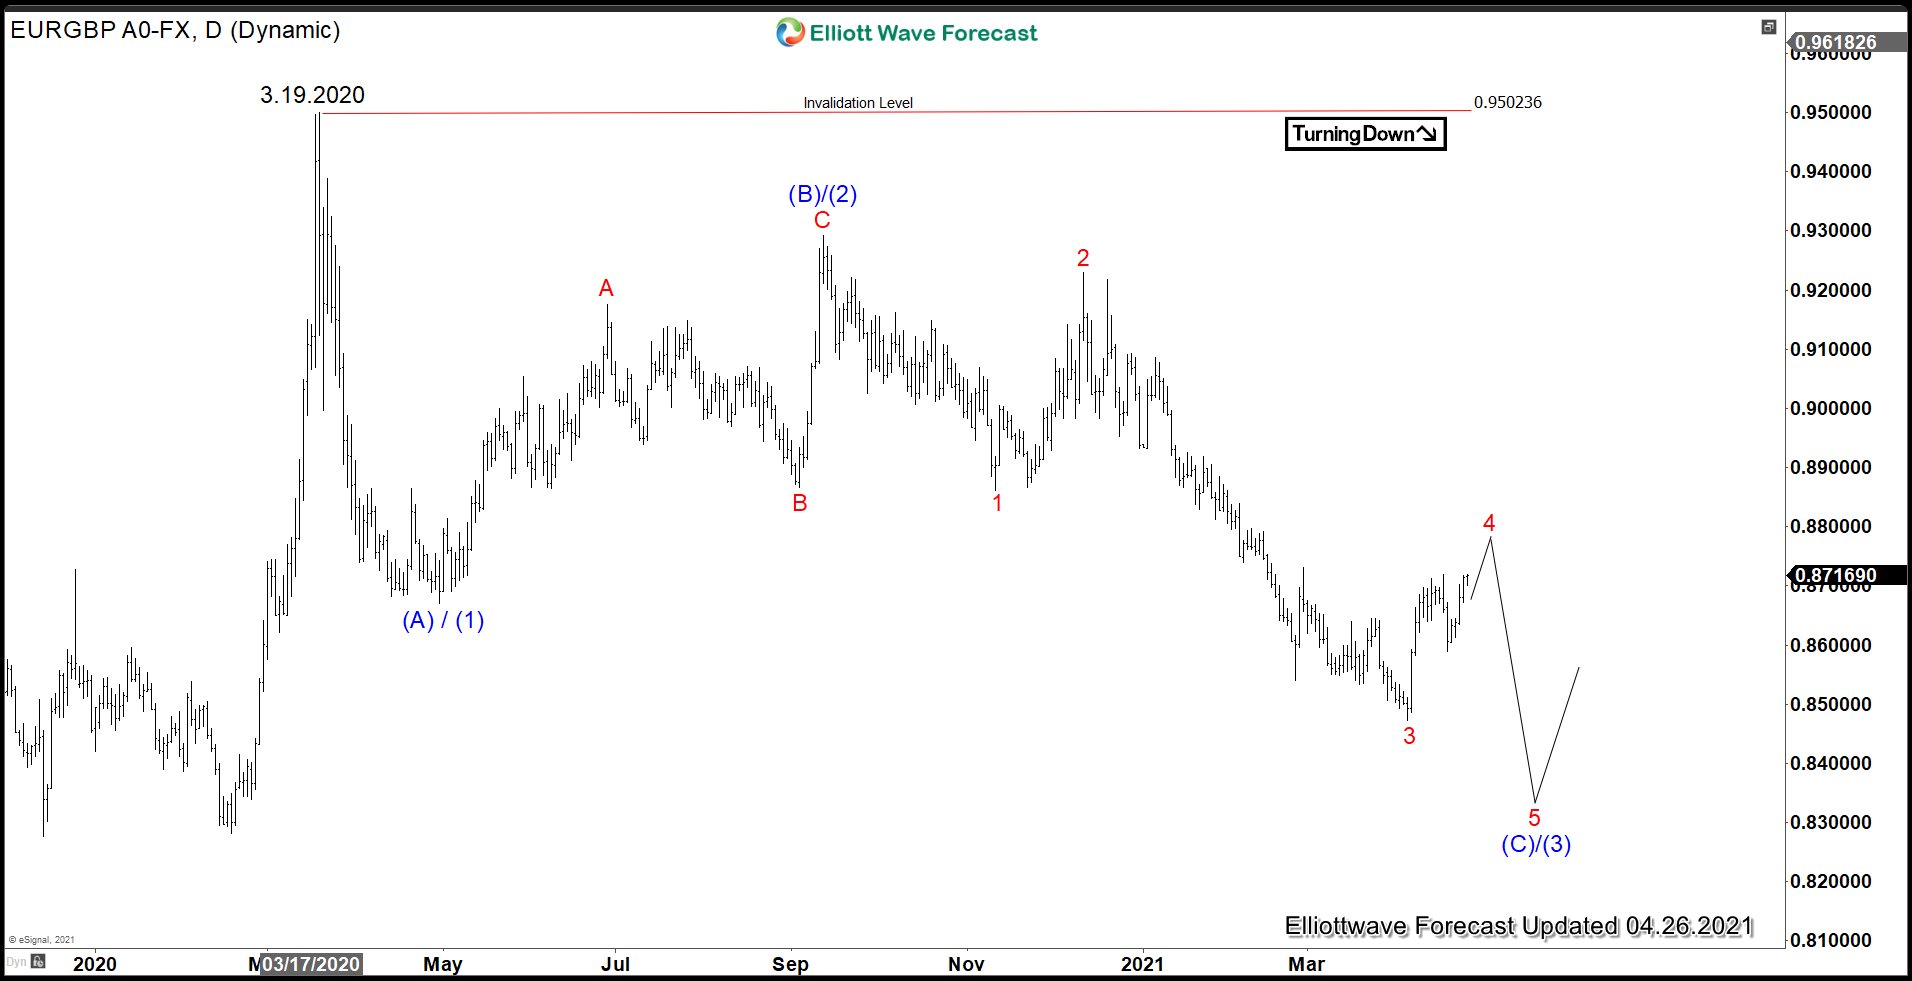
EURGBP Daily Chart 26 April 2021
From Daily Chart above, we can count the decline from 3.19.2020 high as either (A)-(B)-© or (1)-(2)-(3). The internal of first leg lower is looking impulsive and thus better to label it as either wave (A)/(1). The decline from wave (B)/(2) so far looks only to be in 3 waves and thus need 1 more leg lower at least. This suggests rally in wave 4 should fail in 3, 7, or 11 swing for more downside. Potential area to end wave 4 is 0.884 - 0.90 which is where wave 4 reaches extreme area in 3 waves from wave 3 low. From this area, pair can see further downside or 3 waves pullback at least.

