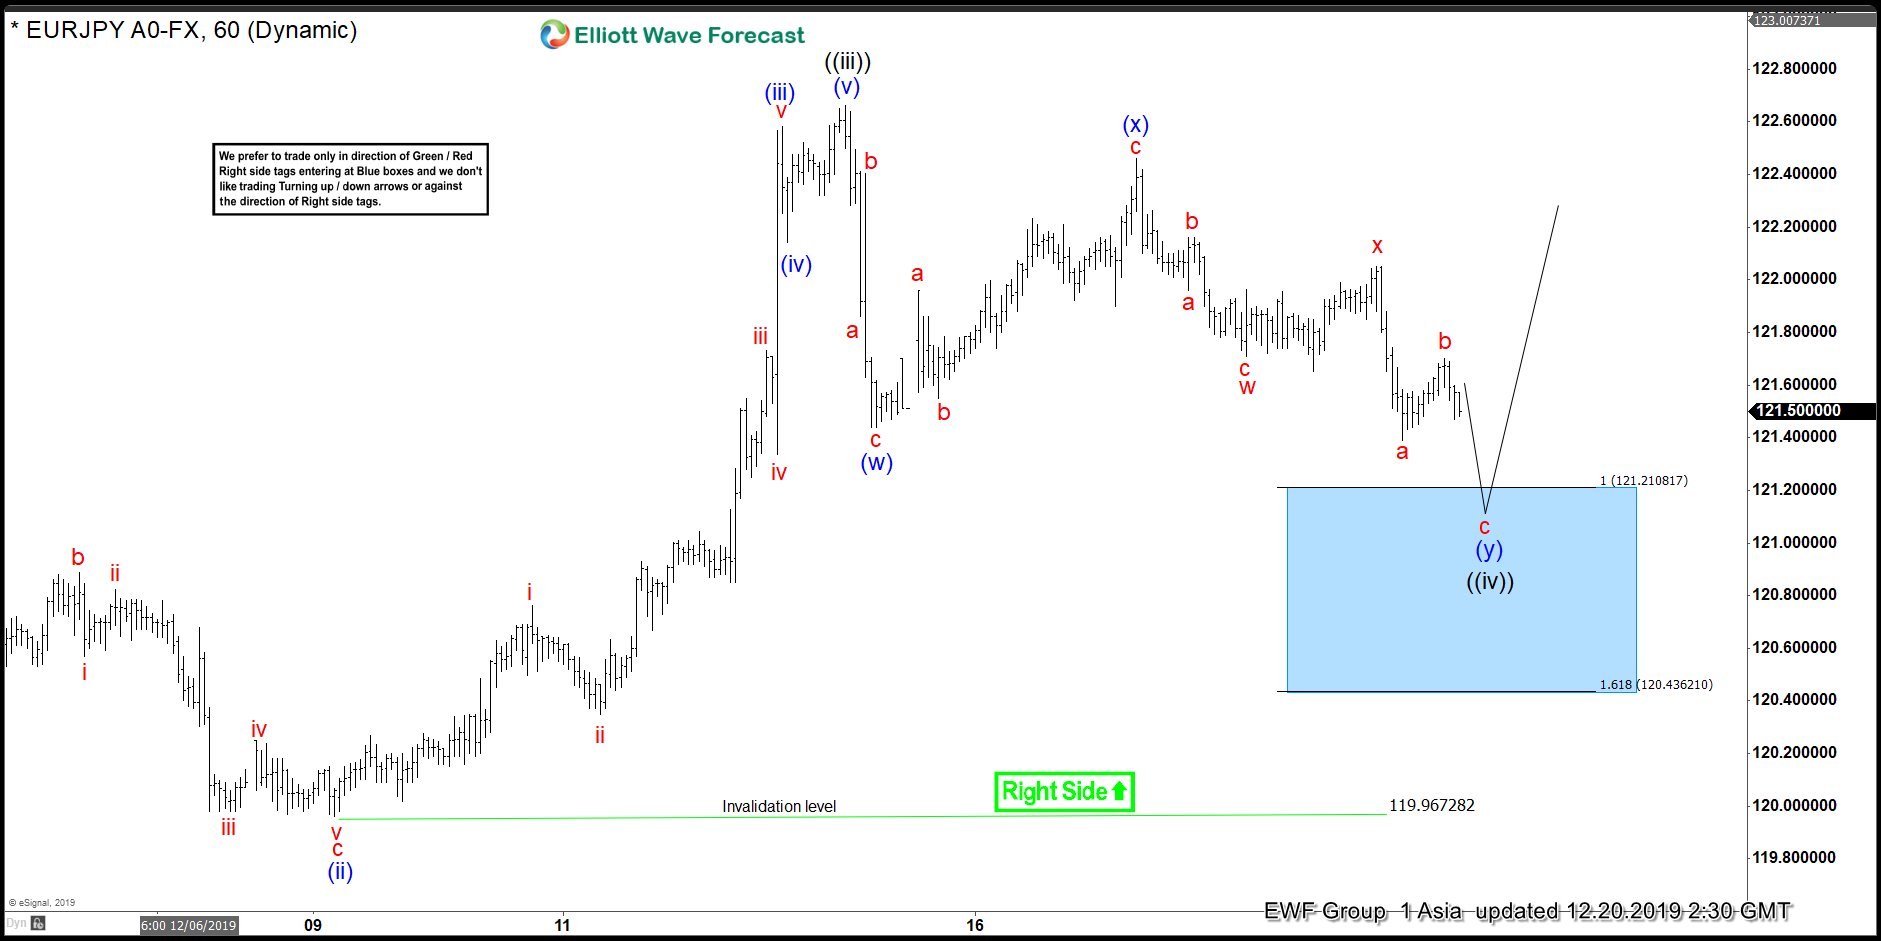
In this blog, we’re going to take a quick look at the Elliott Wave charts of EURJPY pair. EURJPY ended short term cycle in wave ((iii)) as 5 waves rally from 11.14.2019 low at 117.05 to 12.13.2019 high at 122.66. Then, the pair pulled back to correct the cycle up from 11.14.2019 low in 3 waves to 121.44 low. Afterwards, it bounced to reach 122.46 high, which did not break the previous high of wave ((iii)) at 122.66. The failure to break the previous high resulted in a turn lower for the pair. The break of wave (w) low at 121.44 means that the pair is doing a double three correction. The 100% extension for the correction is between 120.43-121.21 and was highlighted with a blue box. The blue box area is the area where we expect buyers to appear for an extension higher or 3 waves bounce at least.
EURJPY 12.20.2019 1 Hour Asia Elliott Wave Update
EURJPY 12.26.2019 1 Hour London Elliott Wave Update
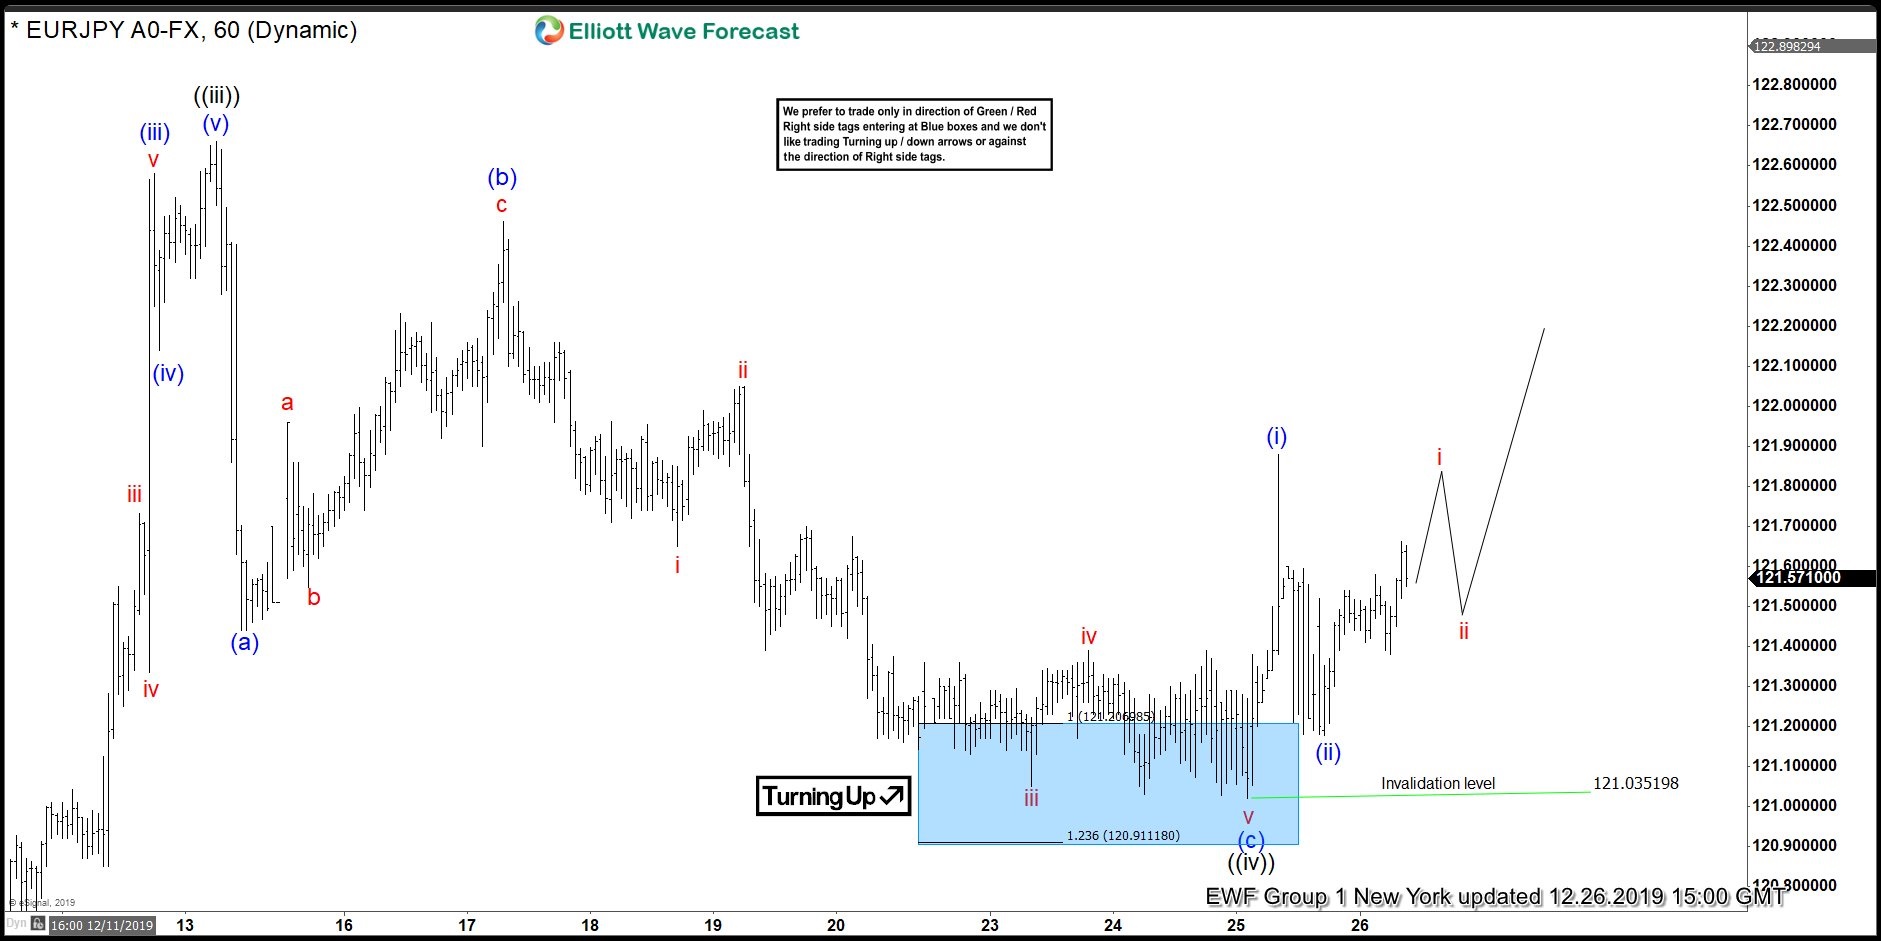
In the chart above from 12.26.2019 update, the pair reached the blue box area and ended wave ((iv)) pullback at 121.03 low. From there, the pair got a nice reaction and rallied higher. This allow members who bought from the blue box area a risk free position.
EURJPY 12.30.2019 1 Hour London Elliott Wave Update
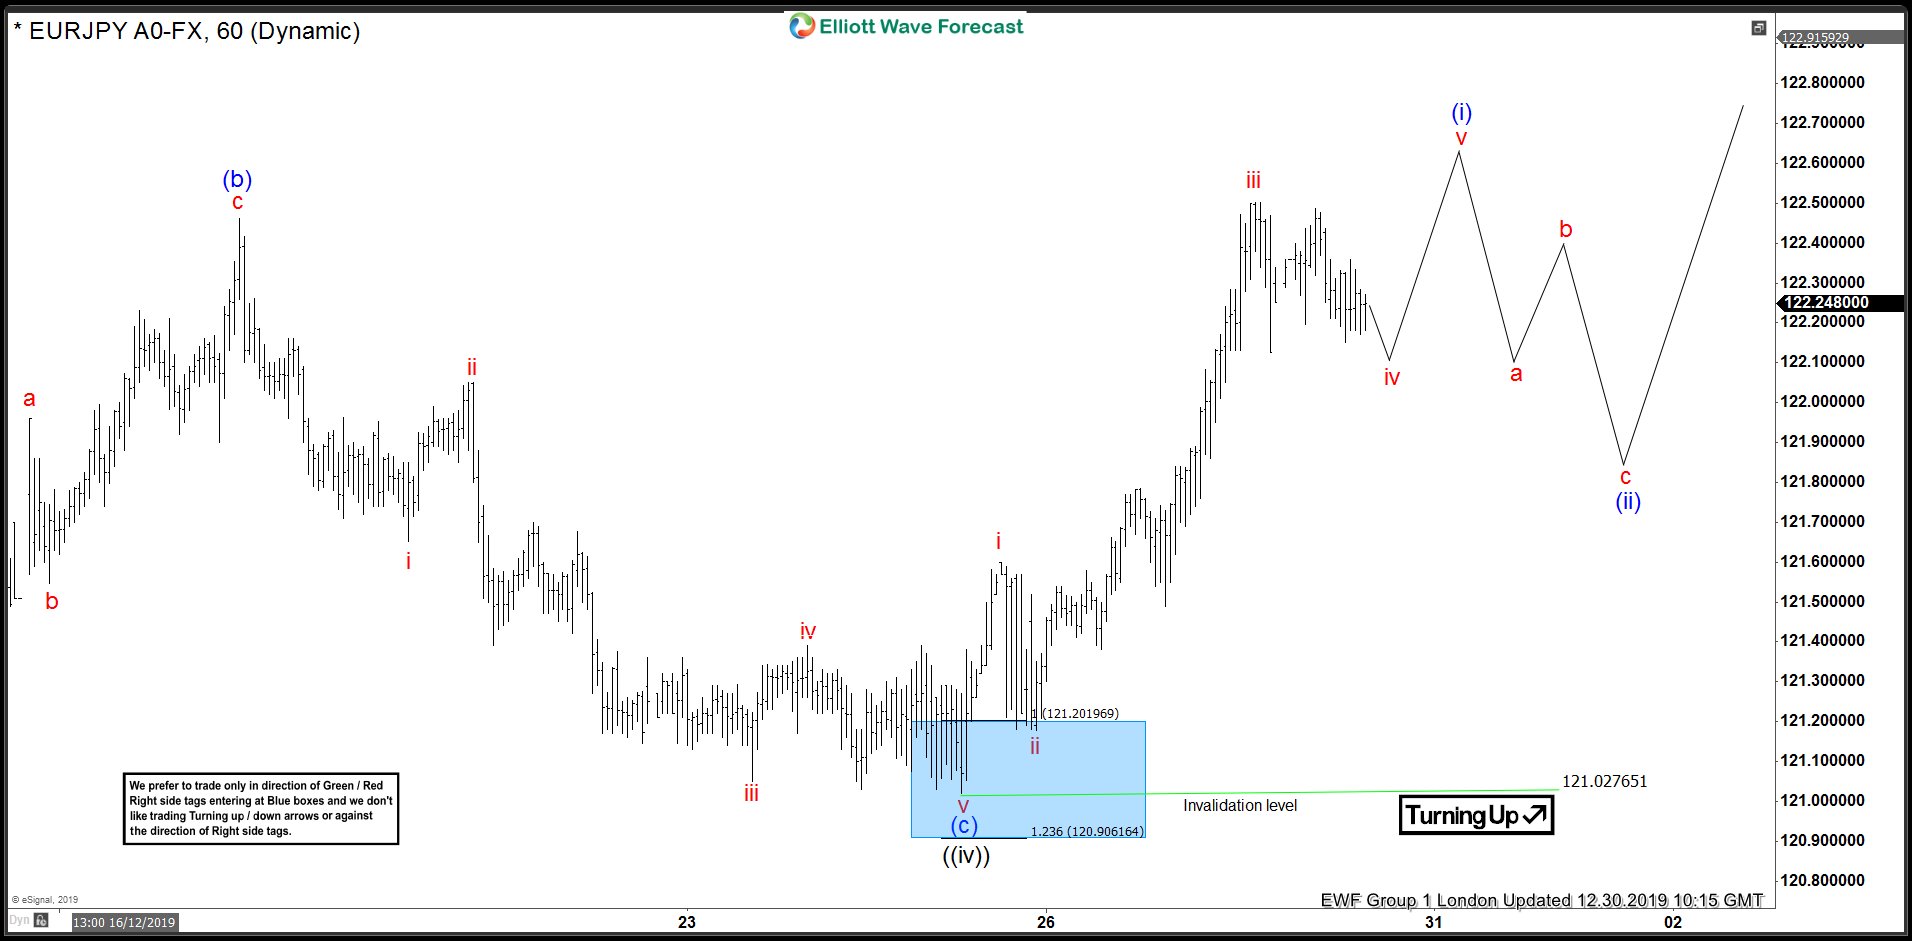
Latest 1-hour chart update shows that wave (i) remains in progress. The pair can extend higher to complete wave v of (i). Afterwards, the pair should do a pullback in 3,7,11 swings before resuming to the upside as long as 121.03 pivot level stays intact.