EURJPY has been under pressure since forming a lower high 121.15 on 25th March. It is yet to break below 10th March low but the bounces look corrective which increase the likelihood of a break lower. Moreover, other Yen pairs like CADJPY and SEKJPY are showing incomplete bearish sequence which also supports the idea of a break lower in EURJPY. However, in this blog we would look at the forecast we presented to members toward the end of March. Let’s take a look at the chart below
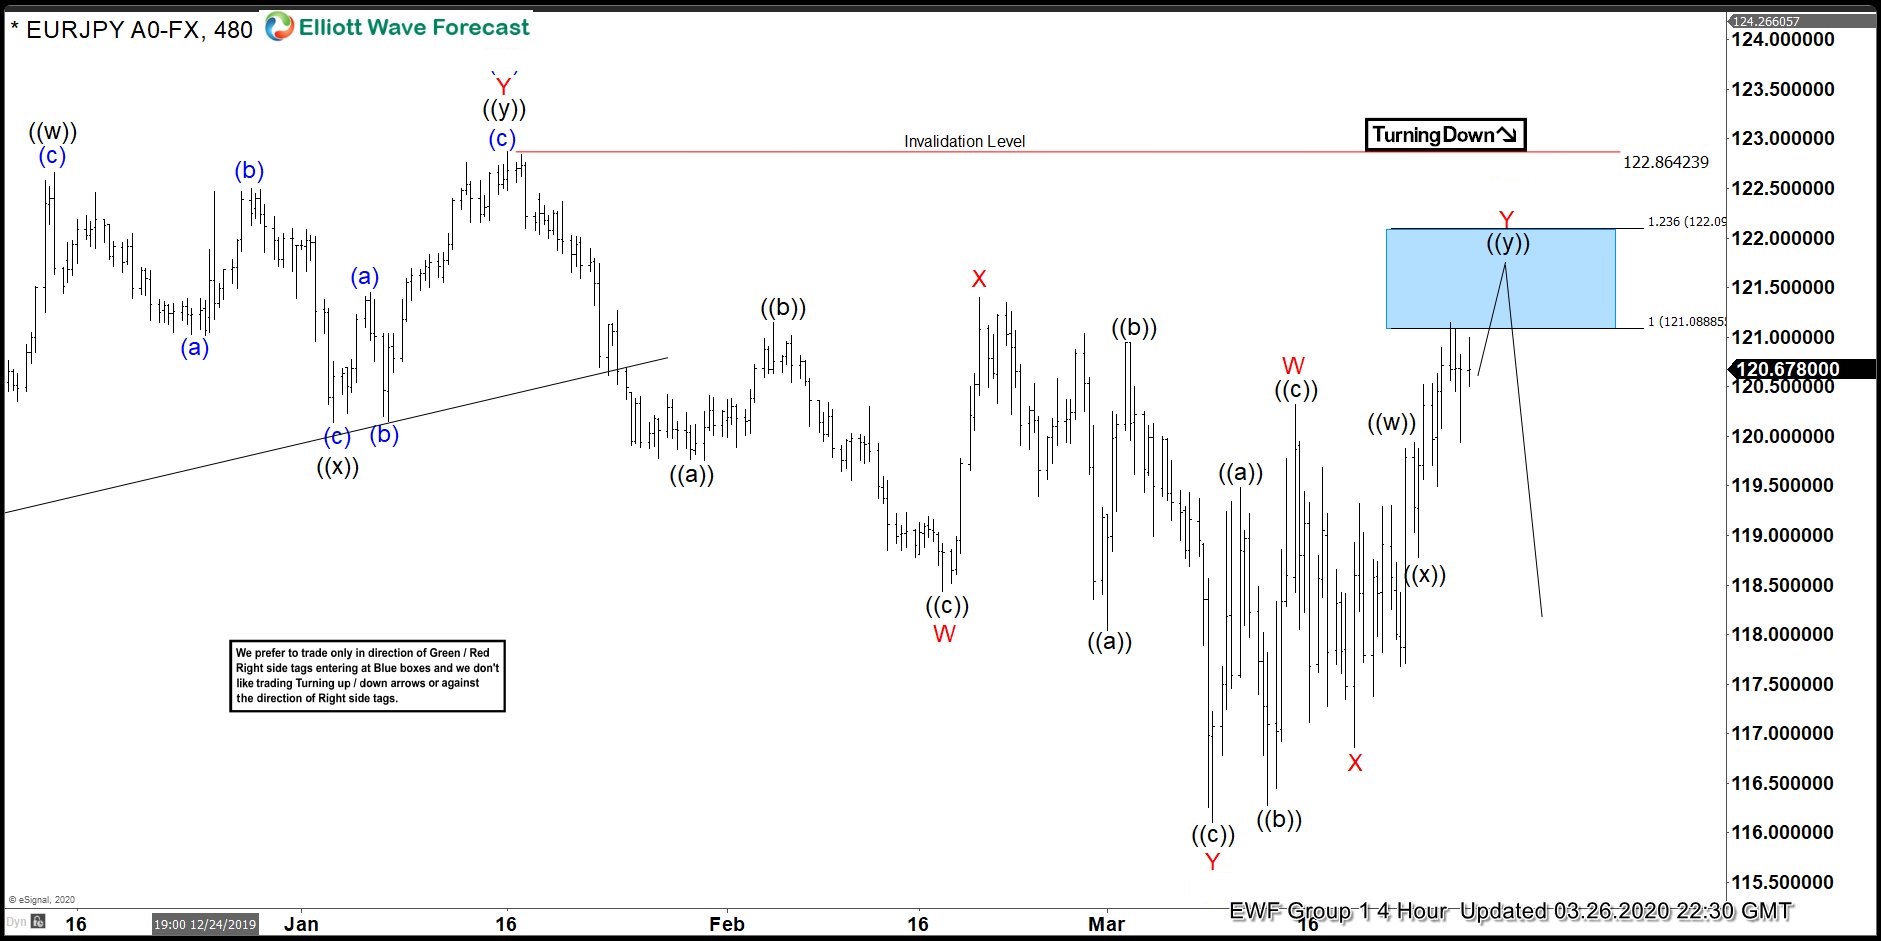
EURJPY 4 Hour Elliott Wave Analysis 3.26.2020
Chart below shows cycle from 122.86 (1.16.2020) ended at 116.10 (3.9.2020). Then pair started bounce to correct the decline from 122.86 peak in a double three Elliott wave structure when wave W ended at 120.32, wave X ended at 116.86 and wave Y was expected to complete in the blue box between 121.08 - 122.09 area and then we expected the pair to turn lower and resume the decline for a new low below 116.10 or produce a 3 waves reaction lower at least. Blue Boxes are High-Frequency areas which are based in a relationship of sequences, cycles and calculated using extensions, we also call them no-enemy areas because in this area both buyers and sellers agree in the direction of the next move for 3 swings at least.
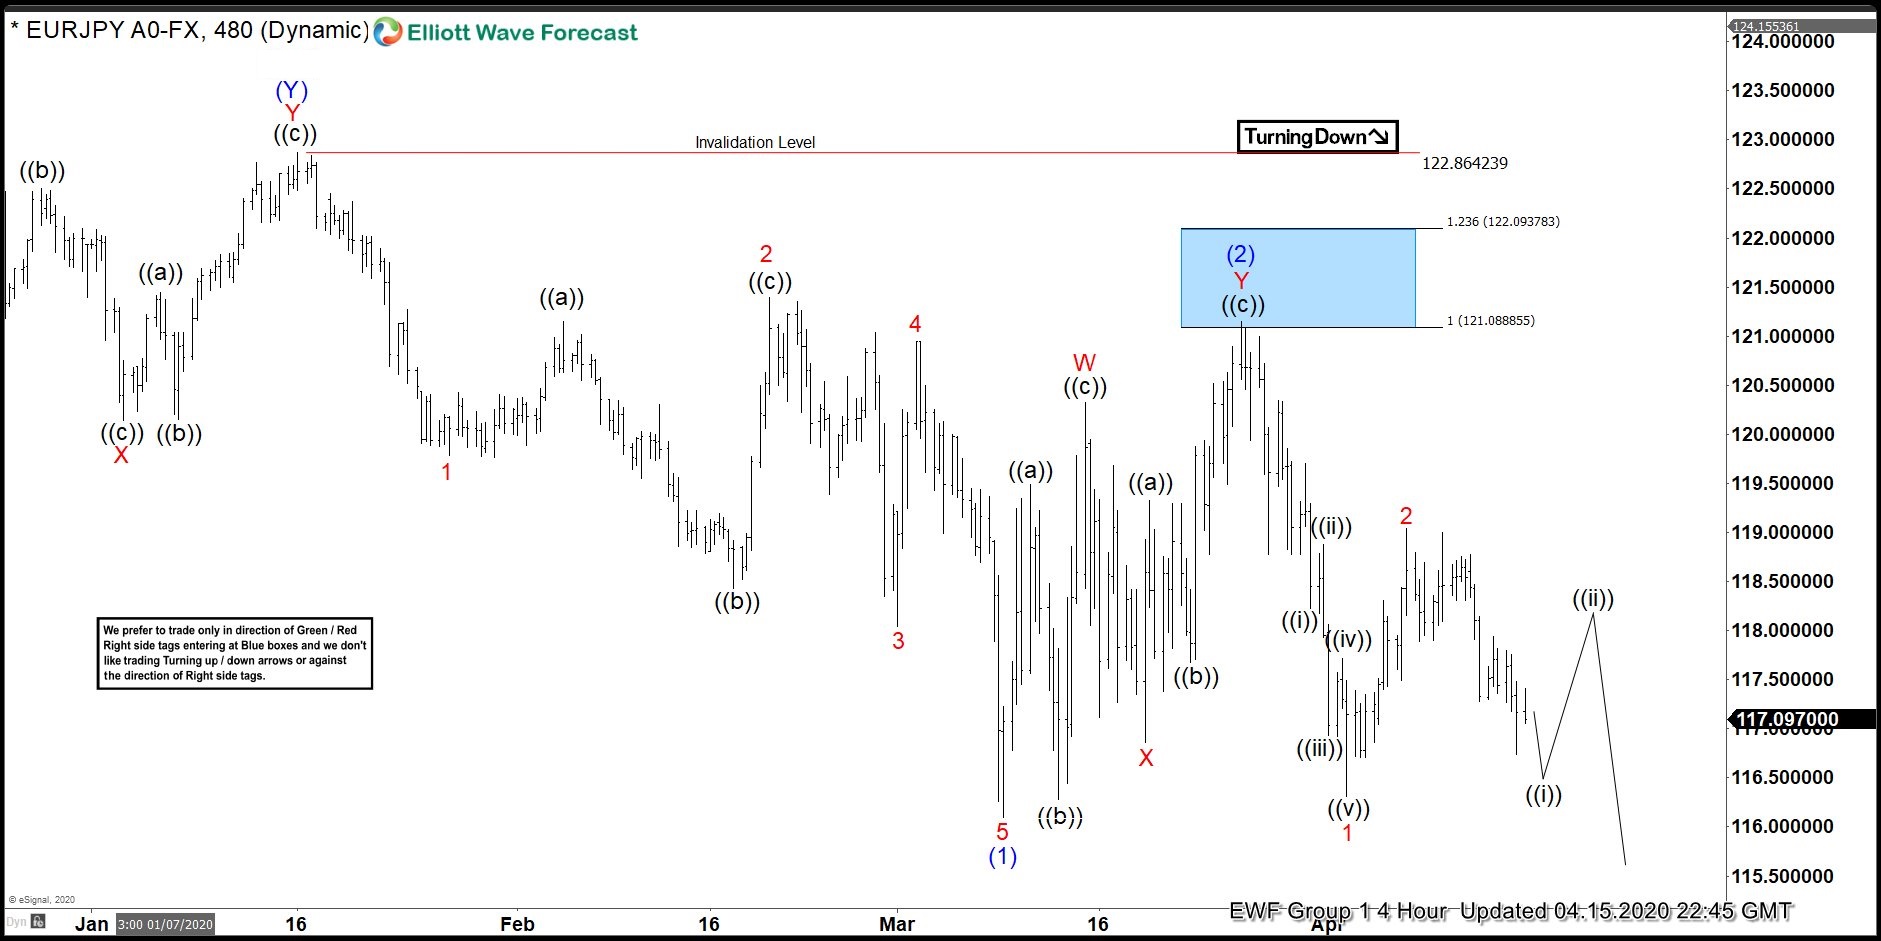
EURJPY 4 Hour Elliott Wave Analysis 4.15.2020
EURJPY bounce failed in the blue box and it decline in 5 waves which we have labelled as wave 1. Due to the decline from the blue box being impulsive we have tweaked the structure of the previous drop from 122.86 - 116.10 to be a diagonal with a FLAT in wave 2. Wave 1 of (3) completed at 116.31 and recovery in wave 2 is also proposed to be over at 119.07. Now, as bounces fail below 119.07 and more importantly below 121.15, we expect the pair to continue lower. In case pair fails to break below 116.31 and breaks above 119.07, then it could be doing a double correction in wave 2 toward 119.26 - 120.95 area before it turned lower again. Break below 116.10, would confirm extension lower toward 114.37 - 110.17 area.

