Back in September 2019, we said Eurostoxx break above July 25 2019 created an incomplete bullish sequence from December 27, 2018 low. This called for extension higher toward 3849 - 3993 area to complete the sequence from December 27, 2018 low. Let’s take a look at the chart we shared in our public social media feeds back in September 2019.
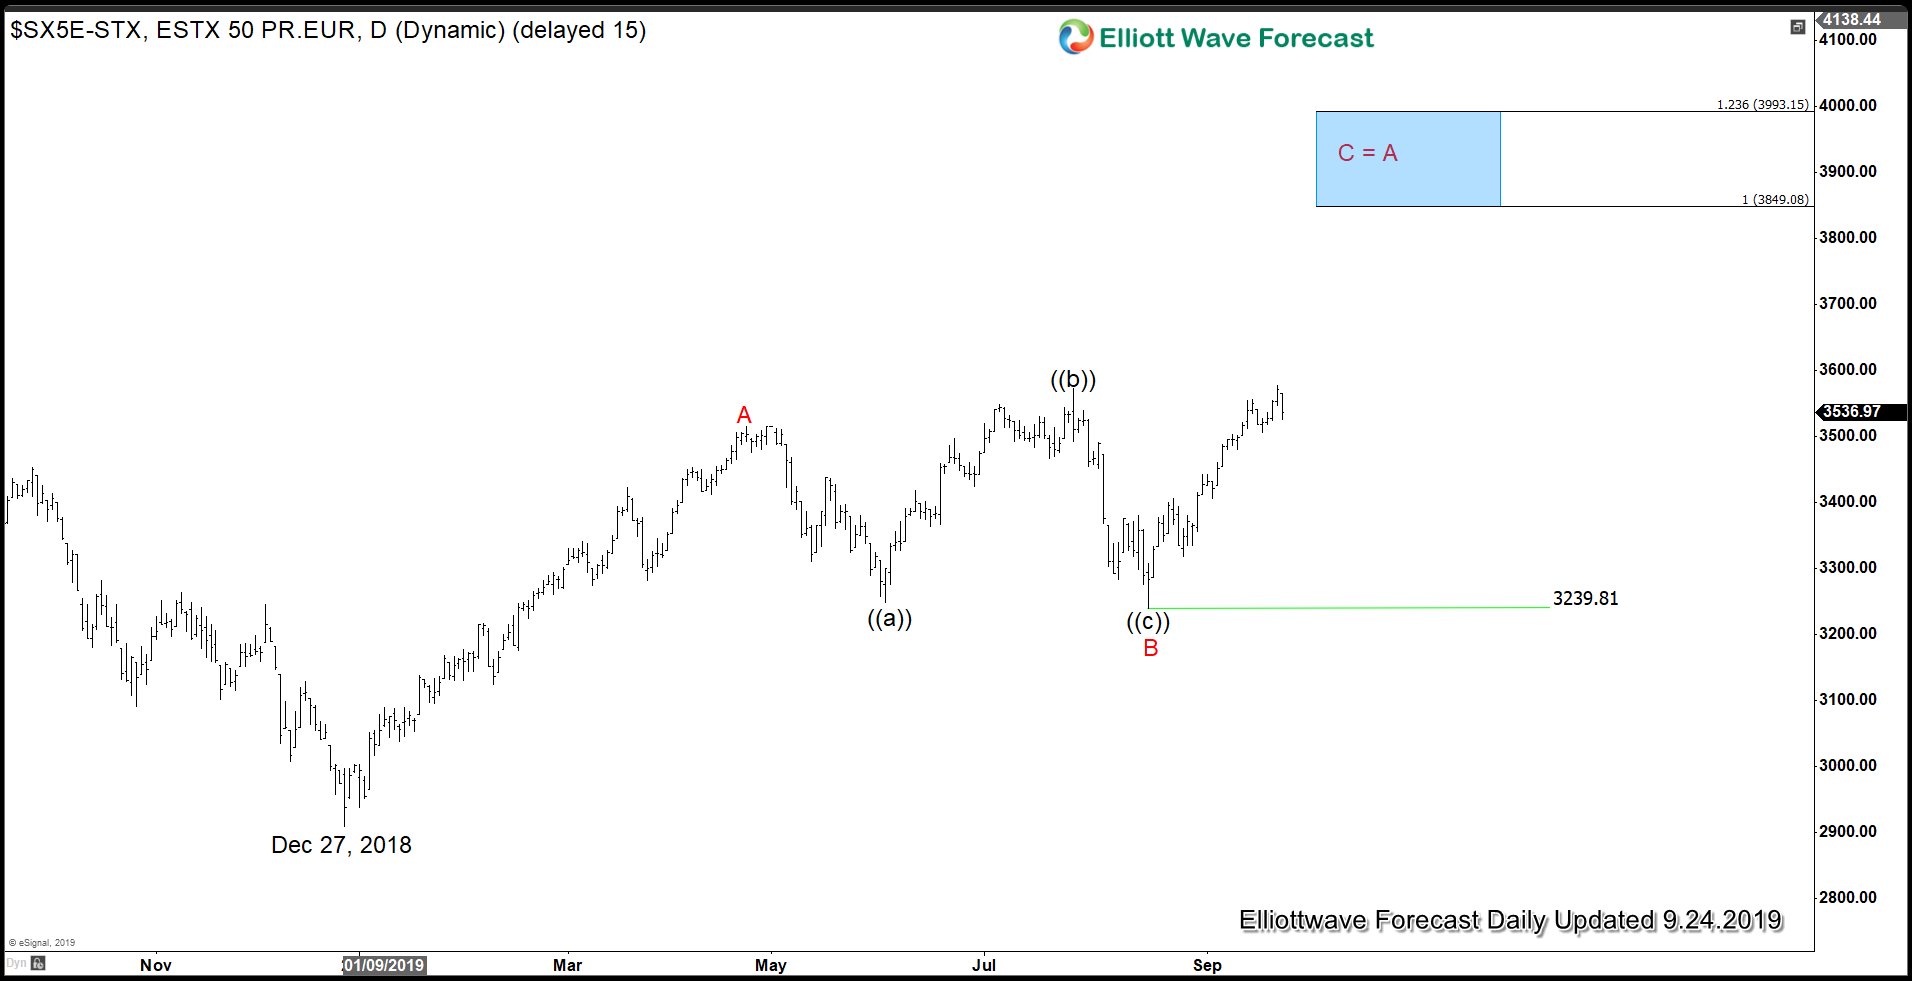
$SX5E (Eurostoxx) Daily Chart 9.24.2019
Chart below shows initial rally from December 27, 2018 low was in 5 waves which was followed by an expanded FLAT correction to 3239.81 low (8.15.2019) and then we can see a new high above wave ((b)) high confirming start of the next leg higher with a target of 3849 - 3993 area. Break above ((b)) high created a bullish sequence suggesting any pull back should remain supported in 3, 7 or 11 swings against 3239.81 low for extension higher.
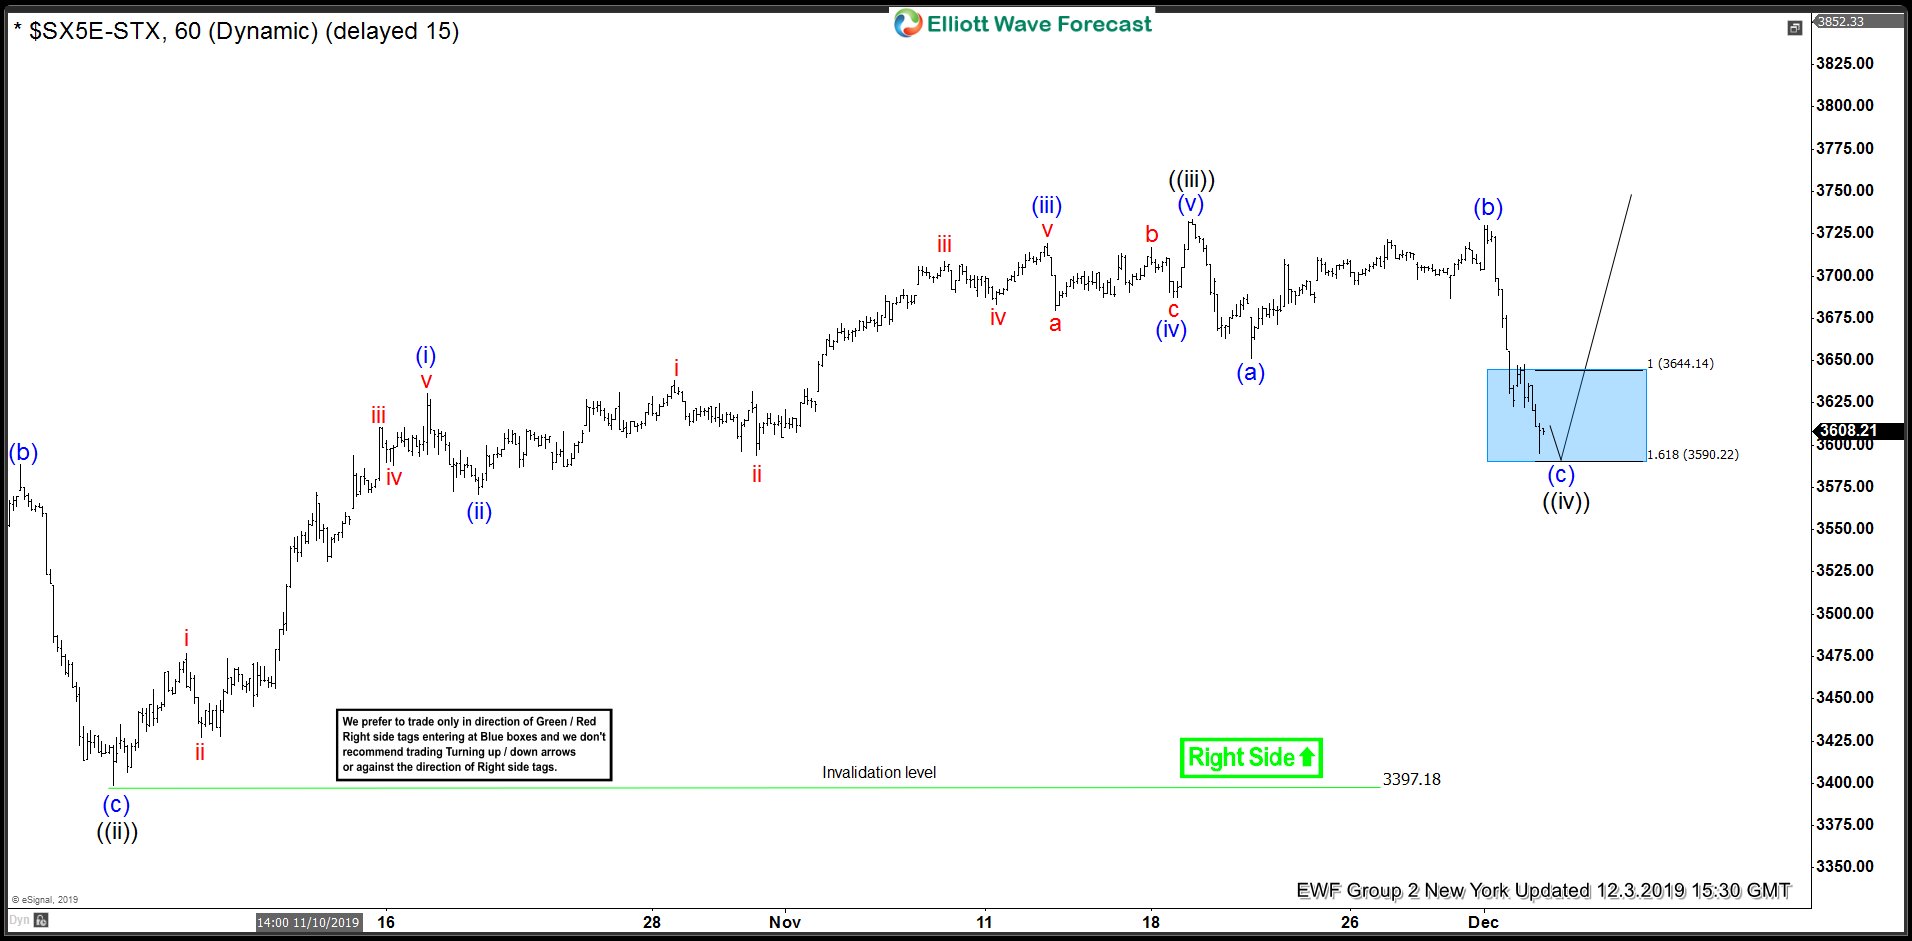
$SX5E (Eurostoxx) Elliott Wave Analysis 12.3.2019
Chart below shows the rally from 3239.81 (8.15.2019 low) is unfolding in 5 waves where wave ((ii)) ended at 3397.18 and wave ((iii)) completed at 3733.45. Wave ((iv)) pull back appears to be a zigzag and has already reached the blue box i.e. 100 - 161.8% Fibonacci extension of (a)-(b). As far as price stays above 3590.2 (161.8% Fibonacci extension), we expected wave ((iv)) to complete and Eurostoxx to resume the rally in wave ((v)) for a new high above 3733.45 or bounce in 3 waves at least to allow any longs from the blue box to get into a risk free position.
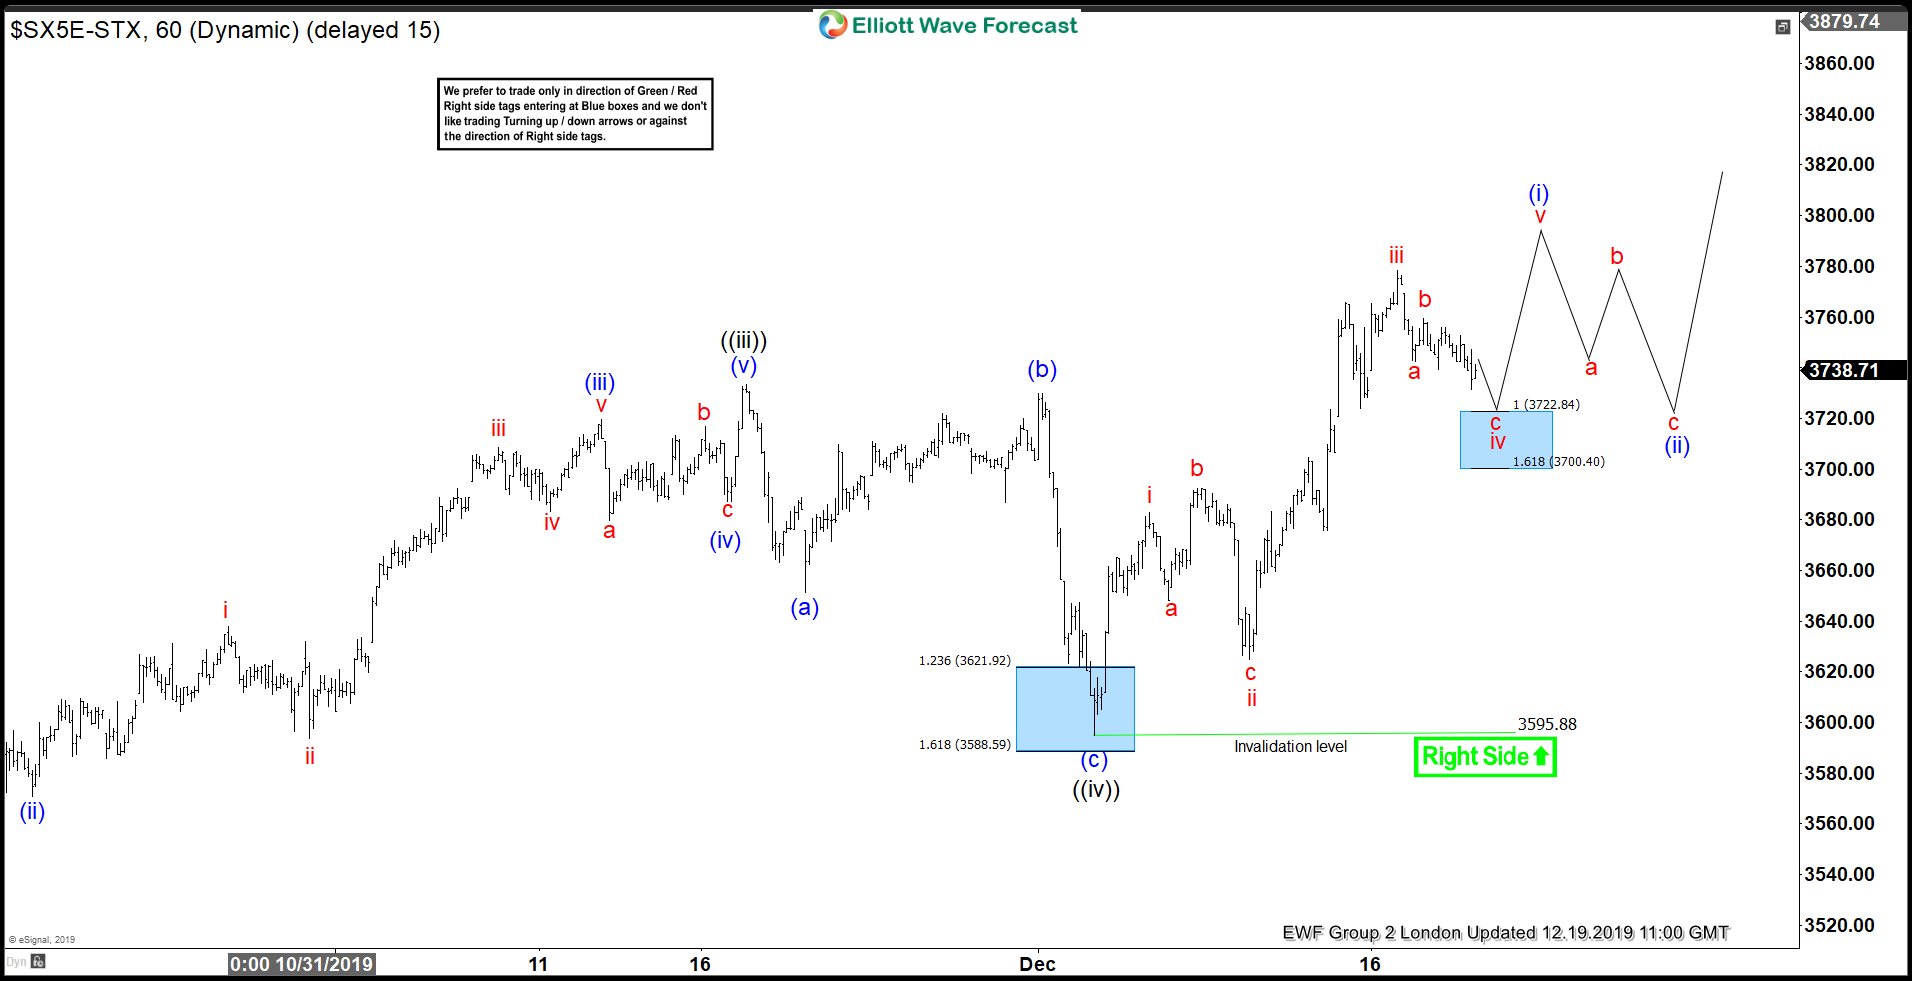
$SX5E (Eurostoxx) Elliott Wave Analysis 12.19.2019
Chart below shows Index found buyers in the blue box area between 3644.15 - 3590.22 and went on to make a new high above 3733.45 to confirm wave ((v)) higher to be in progress. In the chart below, we can see 3 waves up from 3595.88 low so we expected wave iv pull back to end between 3722.84 - 3700.40 area and buyers to appear there for a new high in wave v or a 3 waves bounce at least to allow any longs from blue box to get into a risk free position.
$SX5E (Eurostoxx) Elliott Wave Analysis 12.23.2019
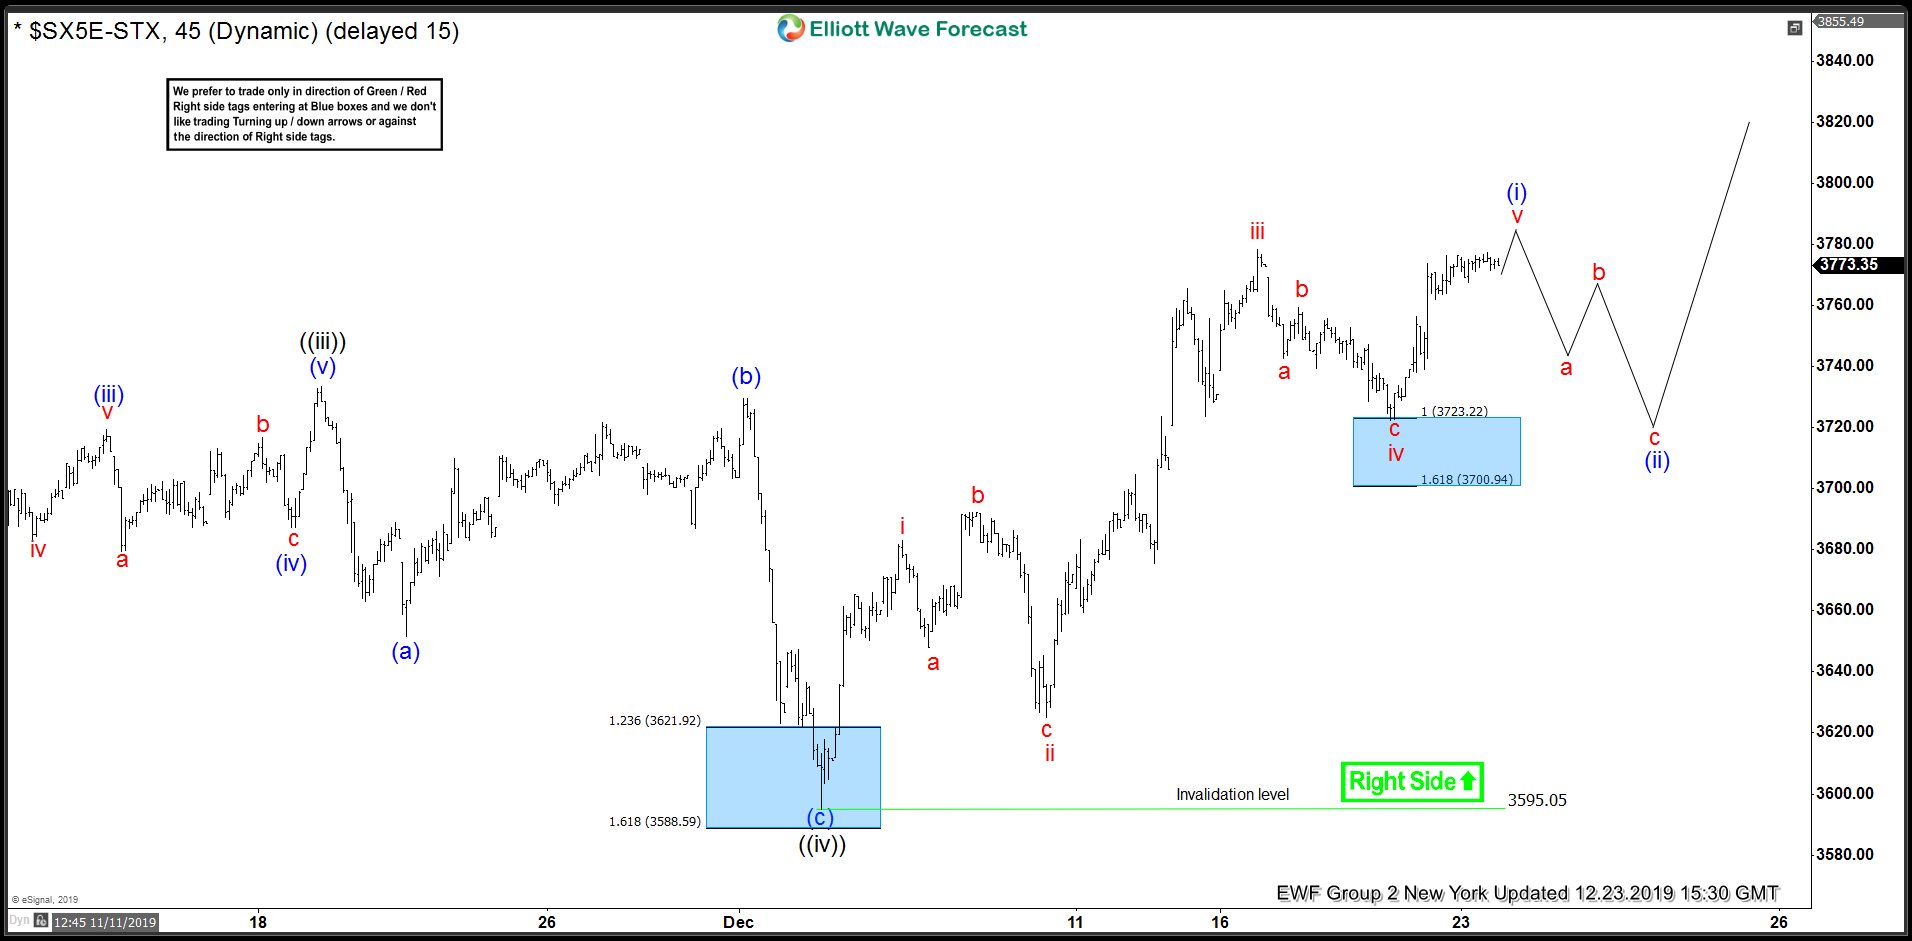
Latest 1 Hour chart shows Index found buyers in the blue box area between 3722.84 - 3700.40 and is very close to making a new high above proposed red wave iii peak at 3778.47. A break above this level will complete 5 waves up from 3595.88 low and even though this could be enough to call wave ((v)) completed but we are still treating it as wave (i) of ((v)) and looking for an extended wave ((v)) because Index is still short of the blue box area (3849 - 3993) that we showed back in September. As far as dips hold above wave ((iv)) low, Index is expected to extend higher toward 3849 - 3993 area. We don’t like selling the Index and expect buyers to appear in the dips in 3, 7 or 11 swings as far as wave ((iv)) low and the pivot at the same level remains intact in our distribution system.