In this technical blog, we will look at the past performance of 1 hour Elliott Wave Charts of the EuroStoxx index, which we presented to members at elliottwave-forecast. In which, the rally from March 30 October 2020 low unfolded as an impulse structure. And showed a higher high sequence favored more upside extension to take place. Therefore, we advised members not to sell the index & buy the dips in 3, 7, or 11 swings at the blue box areas. We will explain the structure & forecast below:
EuroStoxx 1 Hour Elliott Wave Chart
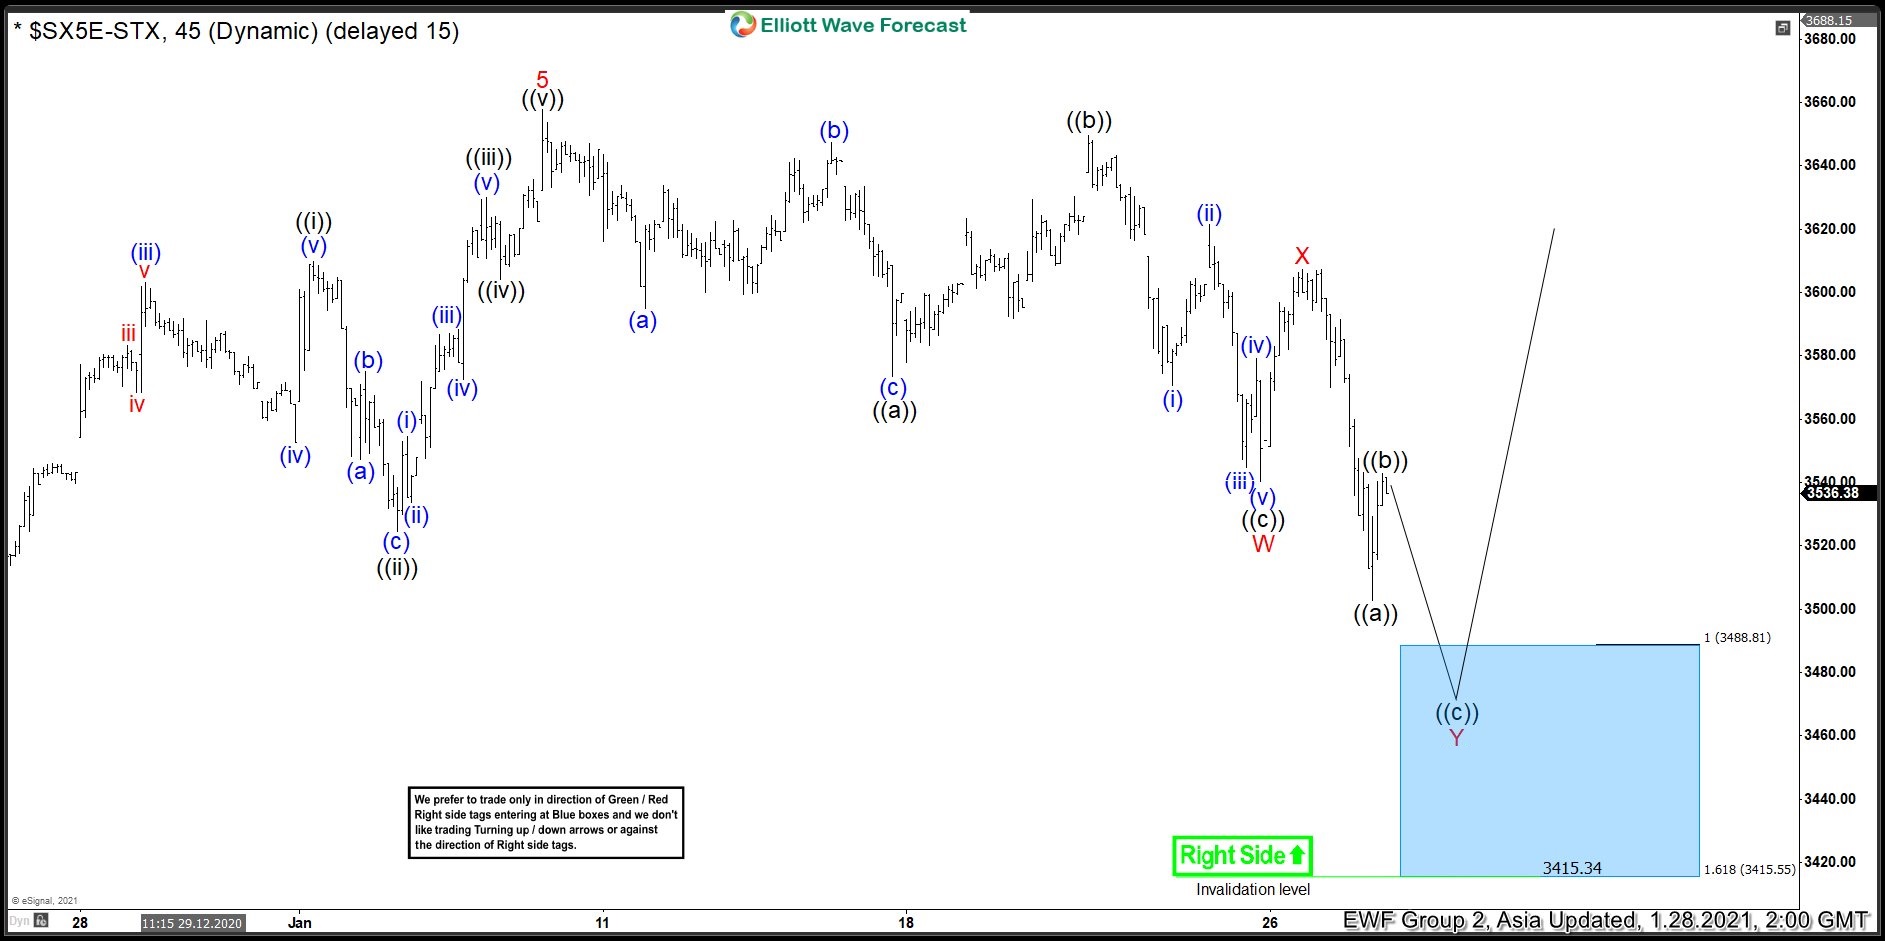
Above is the 1 hr updated chart from the 1/28/2021 Asia update. In which, the rally to 3657.83 high ended the cycle from 10/30/2020 low. Below from there, the index made a pullback to correct that cycle, while the internals of that pullback unfolded as Elliott wave double three structure. Whereas wave ((a)) ended at 3573.60, wave ((b)) bounce ended at 3649.73. Wave (©) ended at 3540.25 low thus completed wave W lower as a flat structure. Up from there, the wave X bounce ended at 3607.42 high. Then wave Y was expected to reach the 3488.81- 3415.55 100%-161.8% Fibonacci extension area of W-X. From where buyers were expected to appear looking for further upside.
EuroStoxx 1 Hour Elliott Wave Chart
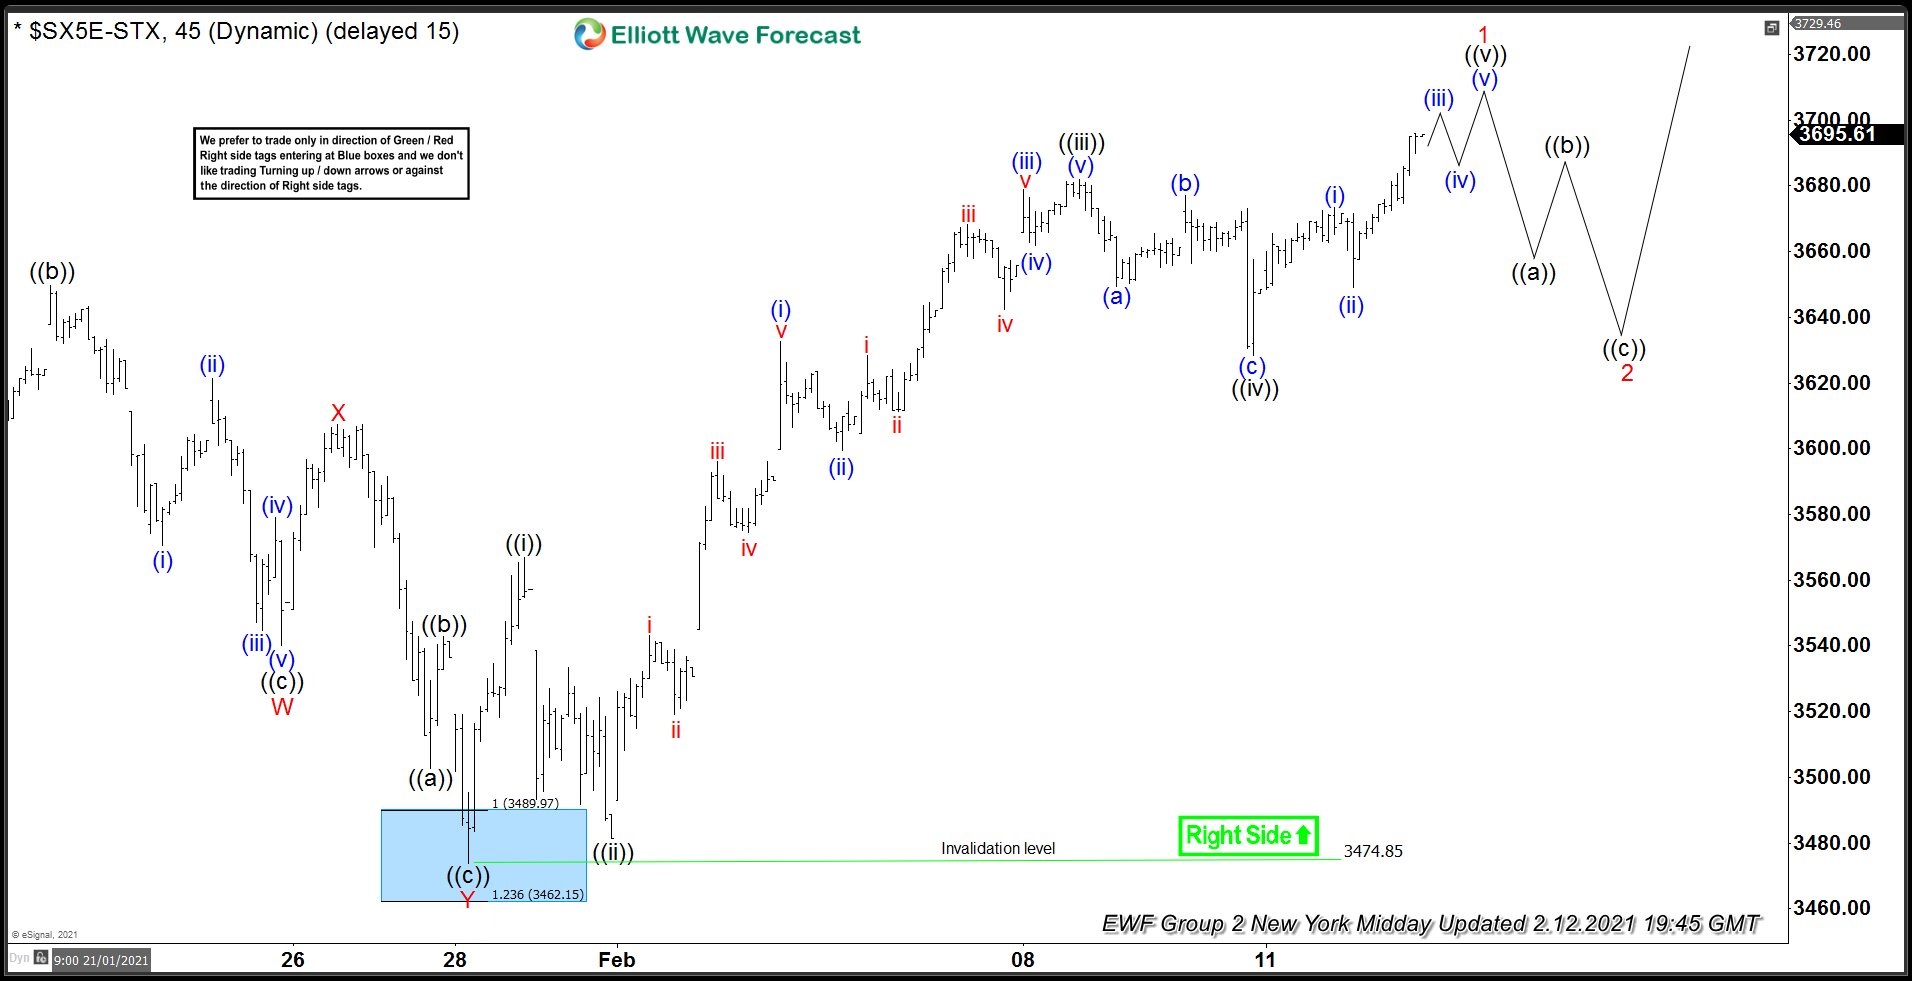
Here’s 1hr Elliott wave Chart of EuroStoxx from 2/12/2021 NY Midday update. The index is showing a reaction higher taking place from the blue box area after ending the double correction at 3474.85 low. And breaking to new highs as expected. Allowed members to create a risk-free position shortly after taking the long positions at blue box area.
Source: EuroStoxx Buying The Dip After Double Correction Lower