Hello fellow traders. Another instrument that we have been trading lately is EURUSD. In this technical blog we’re going to take a quick look at the Elliott Wave charts of EURUSD, published in members area of the website. As our members know, EURUSD has incomplete bearish sequences in the cycle from the 02/16 peak. Consequently, we advised members to avoid buying the pair and keep on selling the rallies in the sequences of 3,7,or 11 swings whenever get chance. In further text we’re going to explain Elliott Wave Forecast and Trading Setup.
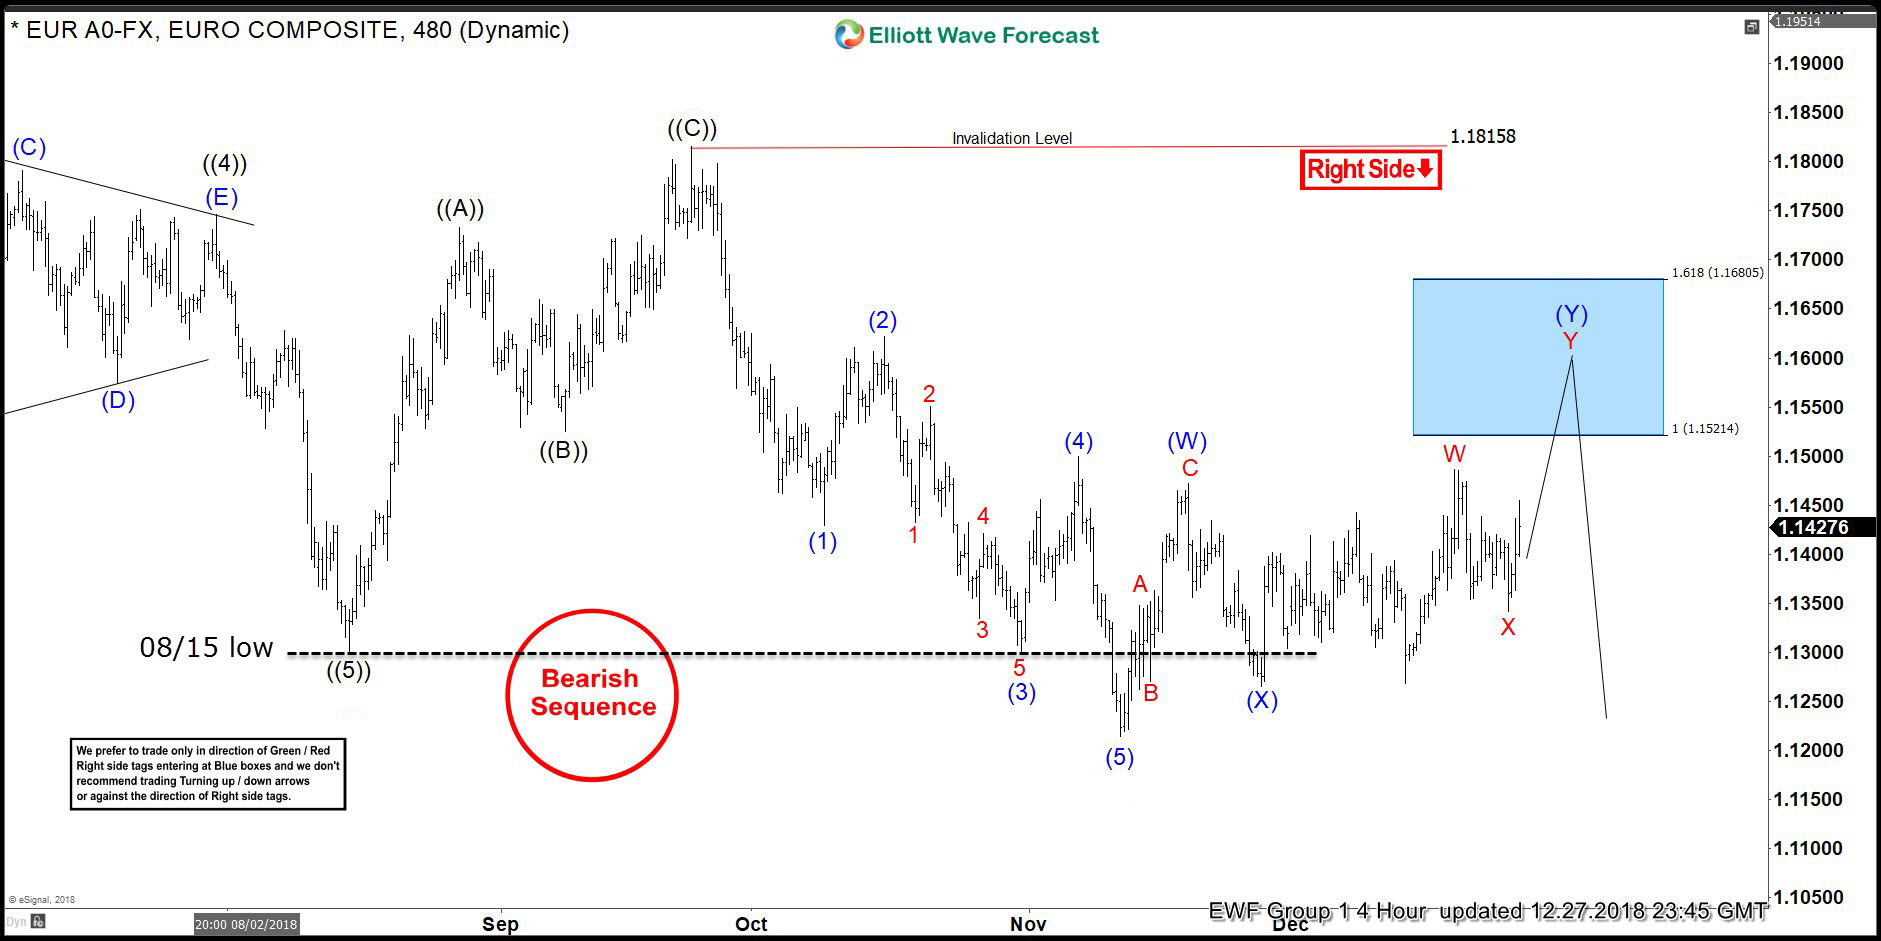
EURUSD 4 Hour Elliott Wave Analysis 11.08.2018
Break of 08/15 low has made the pair bearish against the 1.18158 peak . Cycle from the February peak looks incomplete now, calling for further weakness. As we can see on the chart below , the pair is correcting the cycle from the 1.18158 peak. Recovery is unfolding as Elliott Wave Double Three Pattern. Currently it’s showing 5 swings from the lows, suggesting another leg up to complete 7 swings. The pair has scope to reach 1.1521 -1.1680 area before proposed decline takes place. Although we expect another swing up to happen, we don’t recommend buying it against the main bearish trend. Strategy is waiting for the selling are to be reached at 1.1521 -1.1680 and then sell the pair . As the main trend is bearish, we expect the pair to find sellers at the blue box for a 3 wave pull back at least. As soon as the pull back reaches 50 Fibs against the last connector wave (X) blue, we should make our short positions risk free.
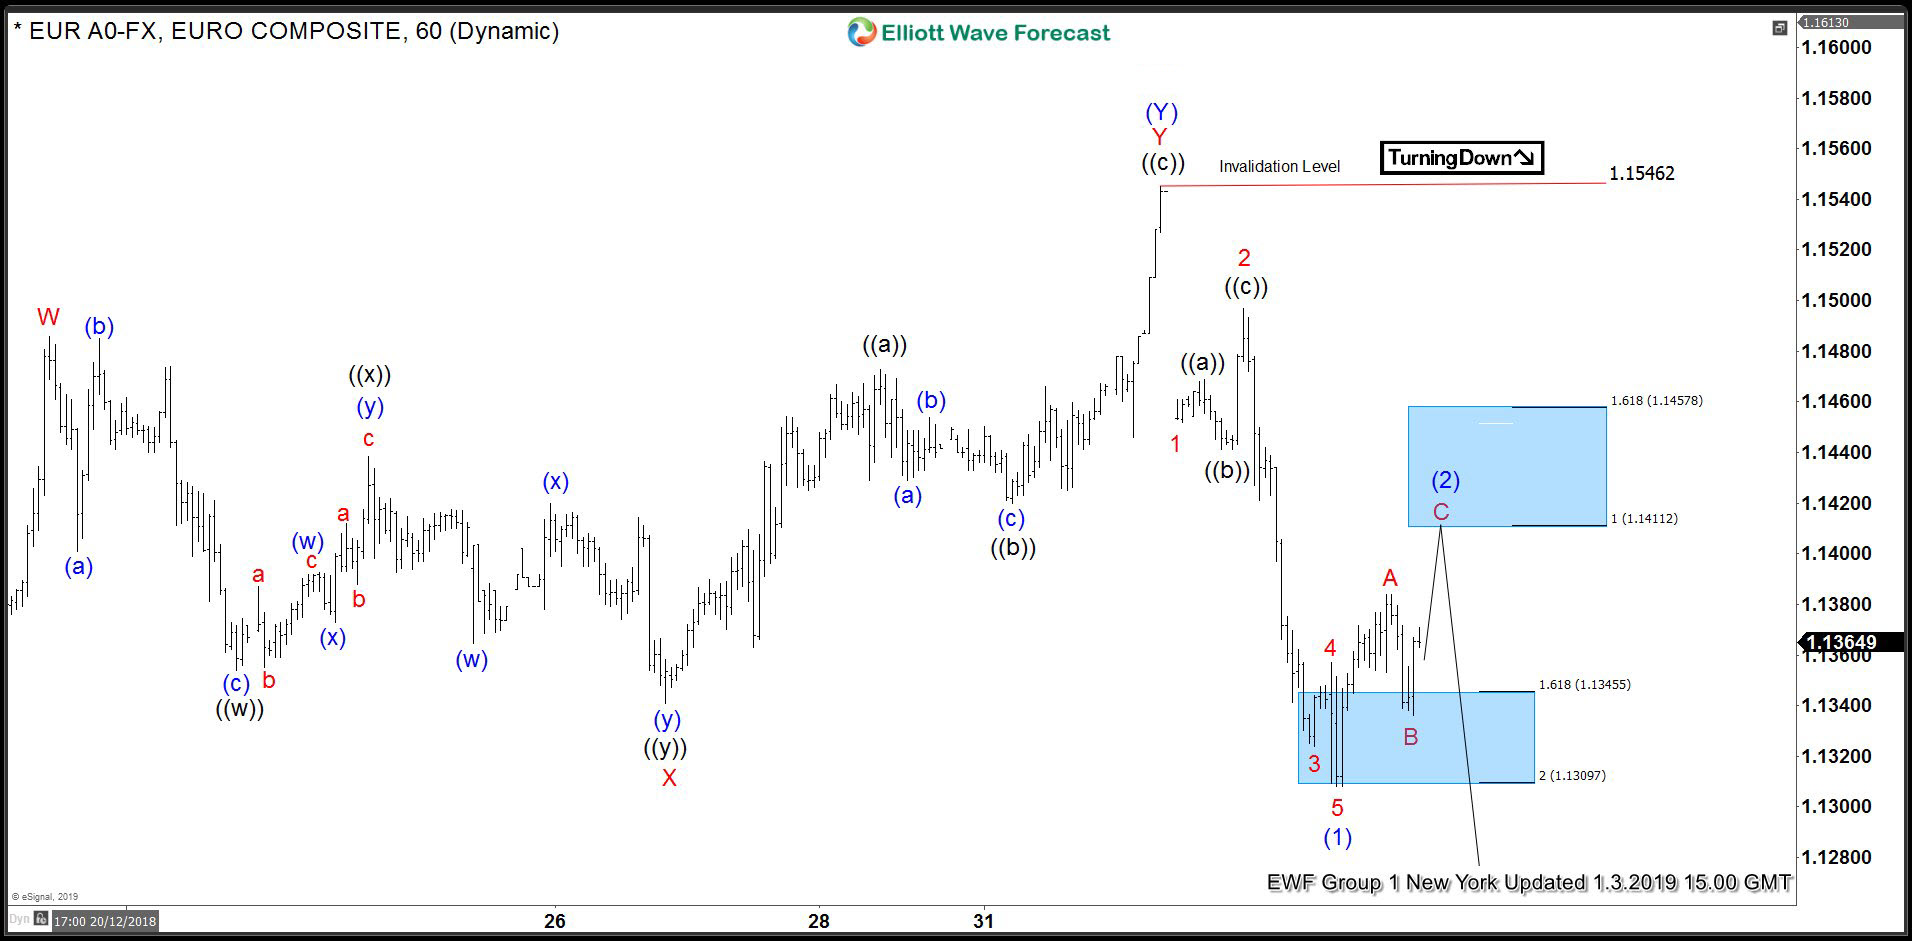
EURUSD 1 Hour Elliott Wave Analysis 11.13.2018
EURUSD has made proposed leg up and found sellers right at the blue box : 1.1521 -1.1680. We have already got decent reaction from the selling zone and calling recovery completed at 1.1546 high. Pull back reached 50 Fibonacci retracement against the (B) blue low. As a result members who took short trades are now enjoying profits with risk free positions. Now, as far as 1.1546 pivot holds, more downside should ideally follow. Currently the pair is correcting cycle from the mentioned peak when bounce should ideally complete at 1.1411-1.1457 area. Now we would like to see break below last short term low 1.1304 which will would be a confirmation of the bearish continuation.
Keep in mind market is dynamic and presented view could have changed in the mean time. Not every chart is Trading Signal. Best instruments to trade are those having incomplete bullish or bearish swings sequences. We put them in Sequence Report and best among them are shown in the Live Trading Room.