In this technical blog, we will look at the past performance of 1 hour Elliott Wave Charts of EURUSD. In which, the decline from the 10 August 2022 high unfolded as an impulse sequence and favored extension in wave five to take place. Therefore, we advised members to sell the bounces in 3, 7, or 11 swings at the blue box areas. We will explain the structure & forecast below:
EURUSD 1 Hour Elliott Wave Chart
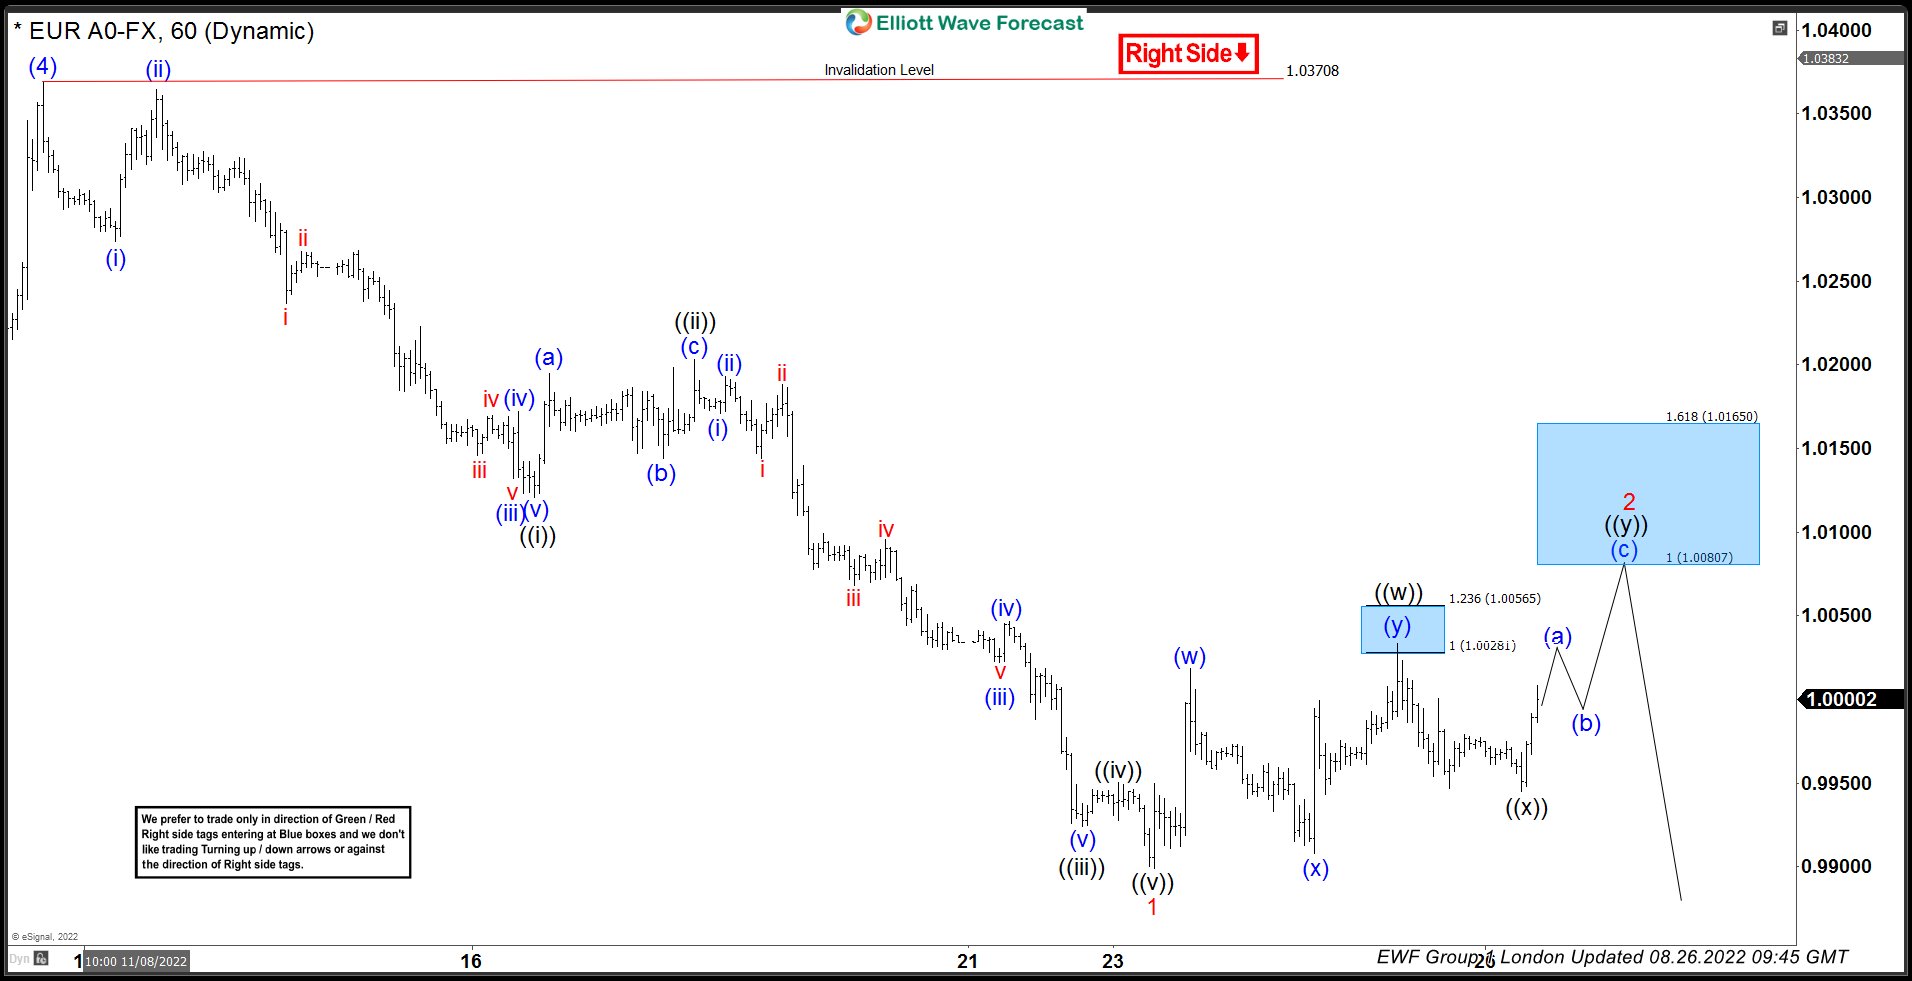
Here’s 1hr Elliott wave Chart from the 8/26/2022 London update. In which, the decline to $0.9898 low ended 5 waves from 08/10/2022 high in wave 1 & made a bounce in wave 2. The internals of that bounce unfolded as an Elliott wave double correction where wave ((w)) ended at $1.0033 high. Then a pullback to $0.9945 low ended wave ((x)) pullback and started the ((y)) leg higher towards $1.0080- $1.0165 blue box area from where sellers were expected to appear looking for more downside or for a 3 wave reaction lower at least.
EURUSD Latest 1hr Elliott Wave Chart

This is the latest 1hr view from the 9/06/2022 London update. In which the pair is showing a reaction lower taking place from the blue box area allowing shorts to get into a risk-free position shortly after taking the position. So far the pair has already made a new low below the 8/23/2022 low confirming the next extension lower to take place. As far as short-term bounces fail below $1.0090 high.
Source: EURUSD Resume Downside After Finding Sellers At Blue Box