EURUSD Technical Analysis May 7/2019
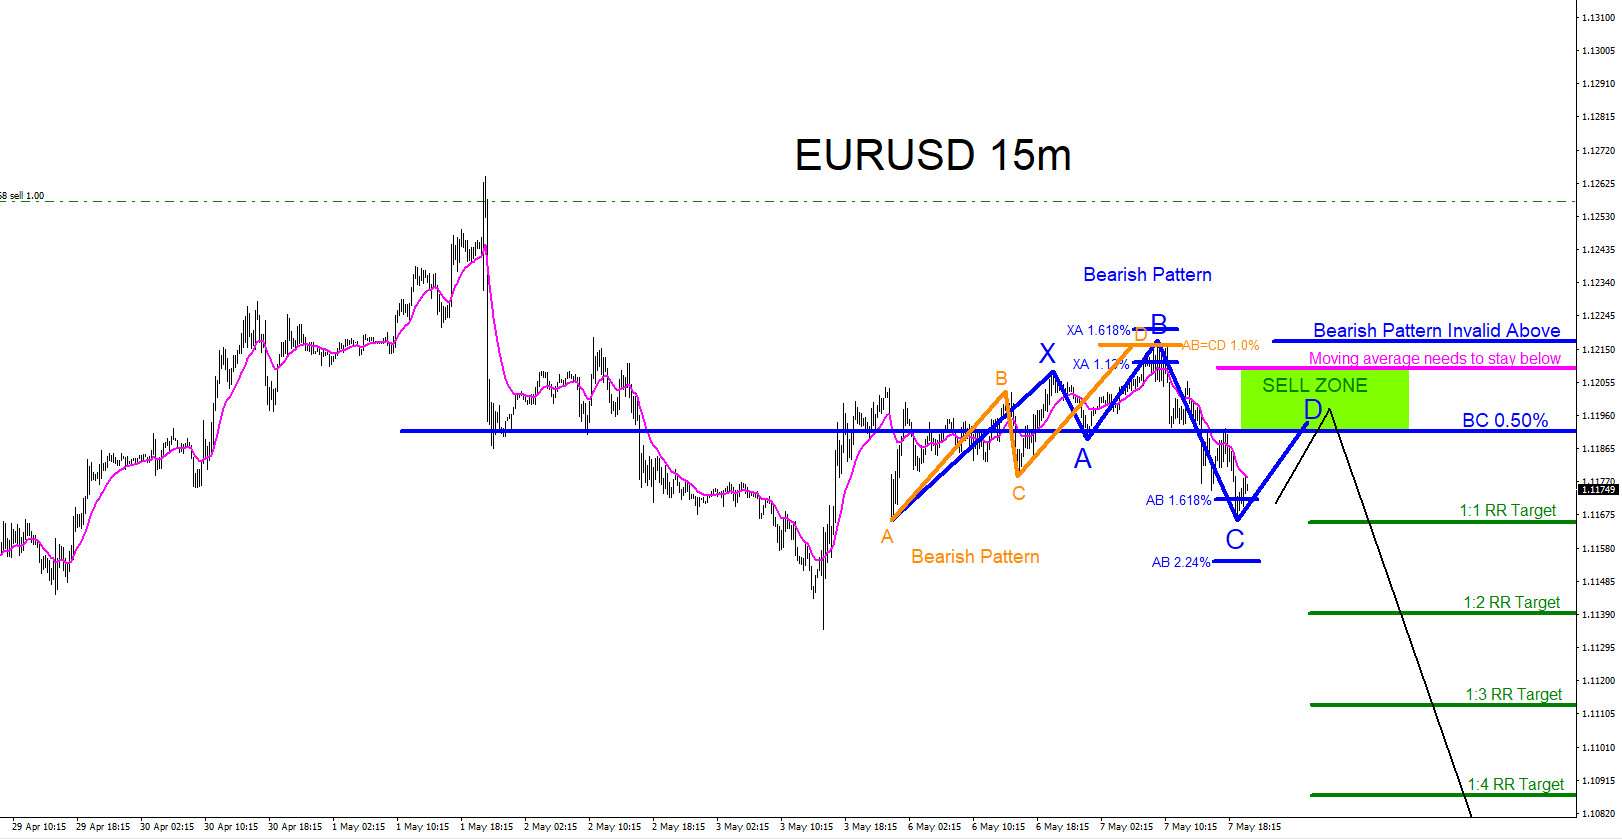
EURUSD : Bearish market patterns can be seen on the EURUSD 15 minute chart. In the chart below blue bearish pattern triggers SELLS at the BC 0.50% Fib. retracement level. The orange bearish pattern already has triggered SELLS at the AB=CD 1.0% Fib. extension level signalling for more downside in the coming trading sessions. If looking to SELL EURUSD traders should be patient and wait for price to make a minimum move higher to the BC 0.50% Fib. retracement level. Waiting for price to move to the minimum BC 0.50% Fib. retracement SELL level will offer a better risk/reward trade setup. Blue bearish pattern is invalidated if price moves above point B of the blue bearish pattern and stops should be placed at this level. Also watch for the pink moving average (15 EMA) to remain below the pink horizontal line for more confirmation that the pair will extend lower. If the moving average trades above the pink horizontal line EURUSD most likely will continue higher and the trade will be stopped out for a loss. The targets (green) are based on the blue bearish pattern BC 0.50% entry. As long as the May 7/2019 high holds EURUSD has a strong probability of making another move lower. Only time will tell what EURUSD will do but at least now you are aware of the SELL ZONE where the pair can possibly reverse lower from.
EURUSD 15 Minute Chart 5.7.2019
Of course, like any strategy/technique, there will be times when the strategy/technique fails so proper money/risk management should always be used on every trade. Hope you enjoyed this article.
*** Always use proper risk/money management according to your account size ***