GBPUSD Weekly Technical Outlook
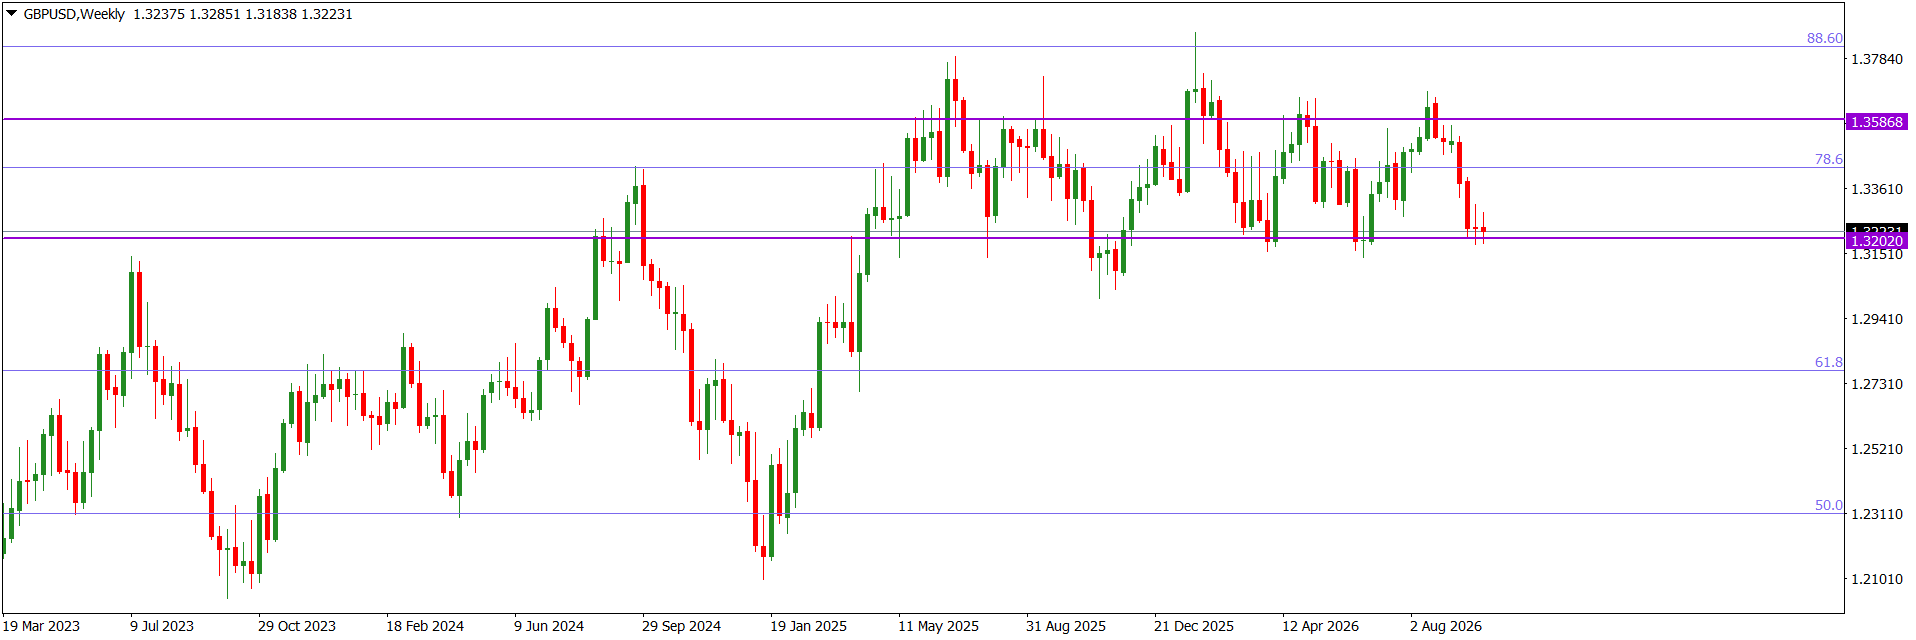
The GBPUSD market operation on the weekly time frame is sideways at the 1.32020 horizontal support area. Three weeks ago, market operation printed a relatively moderate bearish candlestick that retested the area. But the last two weeks have seen sideways of market operation in the area.
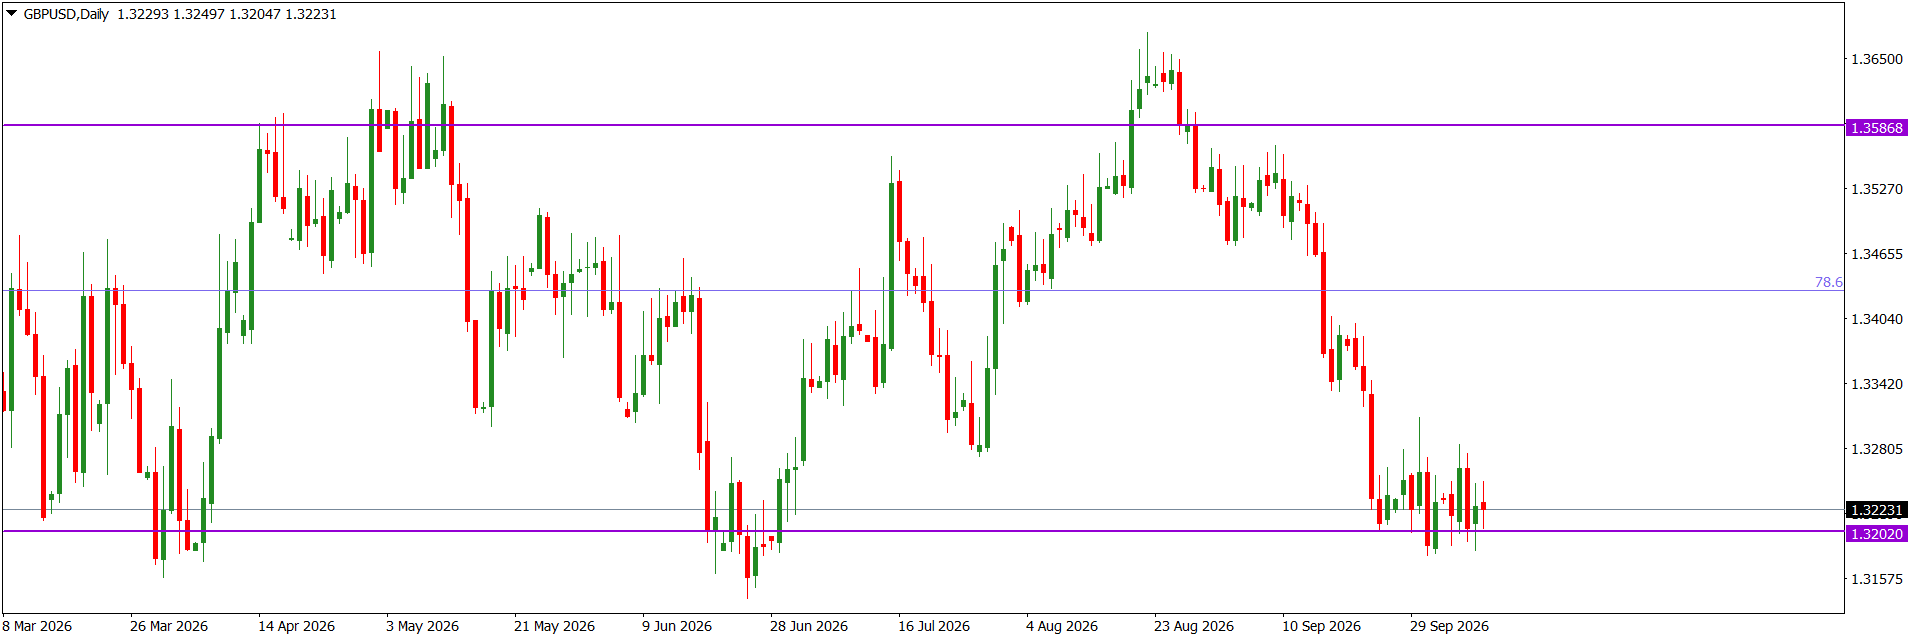
The GBPUSD price action on the daily time frame is sideways at the 1.32020 horizontal support. The area is aligned with the lower boundary of the 1.32020/1.35870 horizontal channel (purple). Technically, any southward price action may not be sustainable.
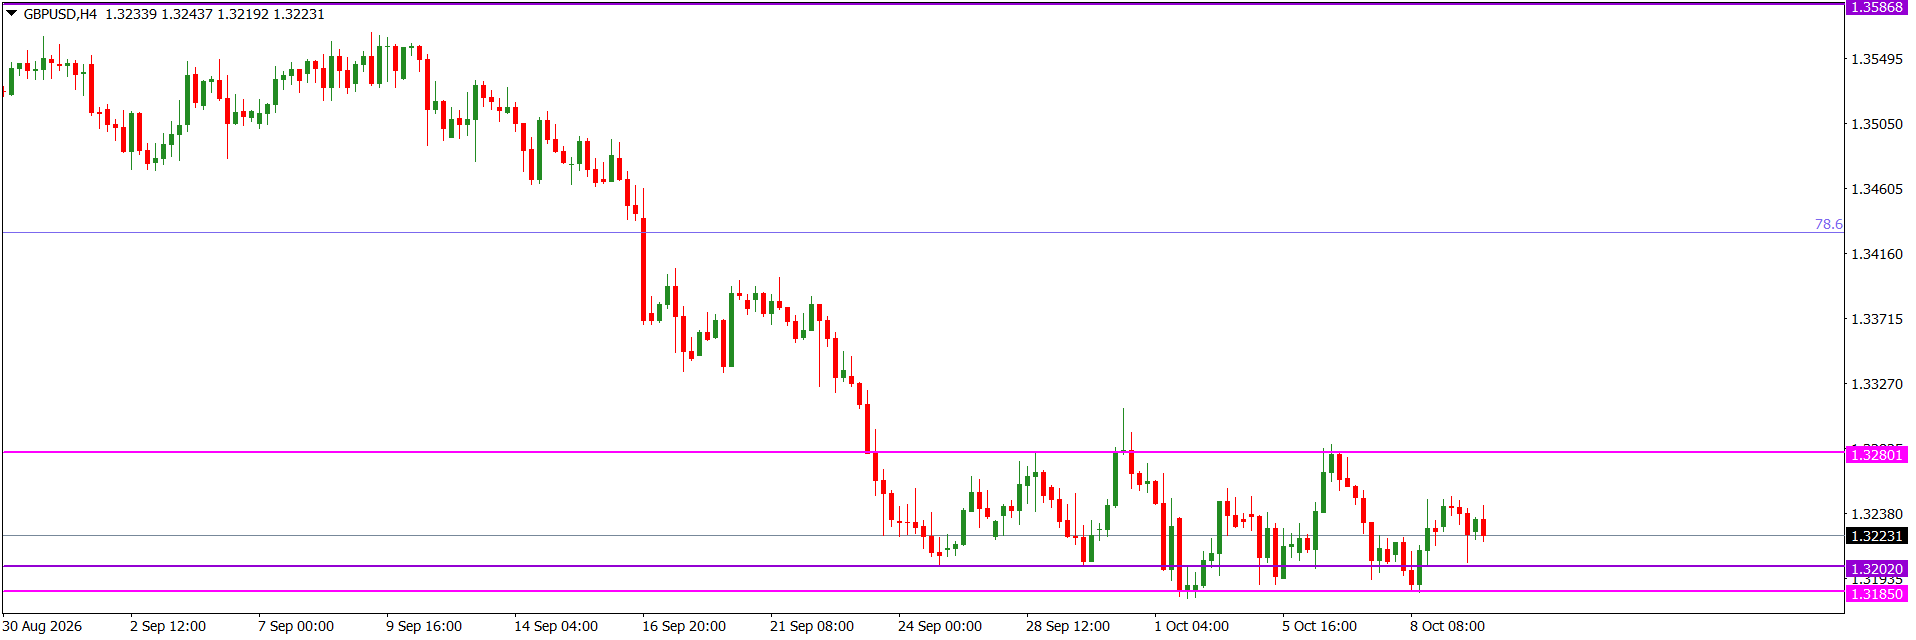
The GBPUSD price action on the H4 time frame is sideways at the 1.32230 intra-day horizontal support. Technically, this is within the 1.31850/1.32800 intra-day horizontal channel. And it is also within the 1.32020/1.35870 larger technical channel of price consolidation. Technically, we may not see sustainable southward drive of price action until a northward correction of price action to retest an intra-day value area.
I may be wrong. Trade safe and prosper.
Trap