USDJPY Weekly Technical Outlook
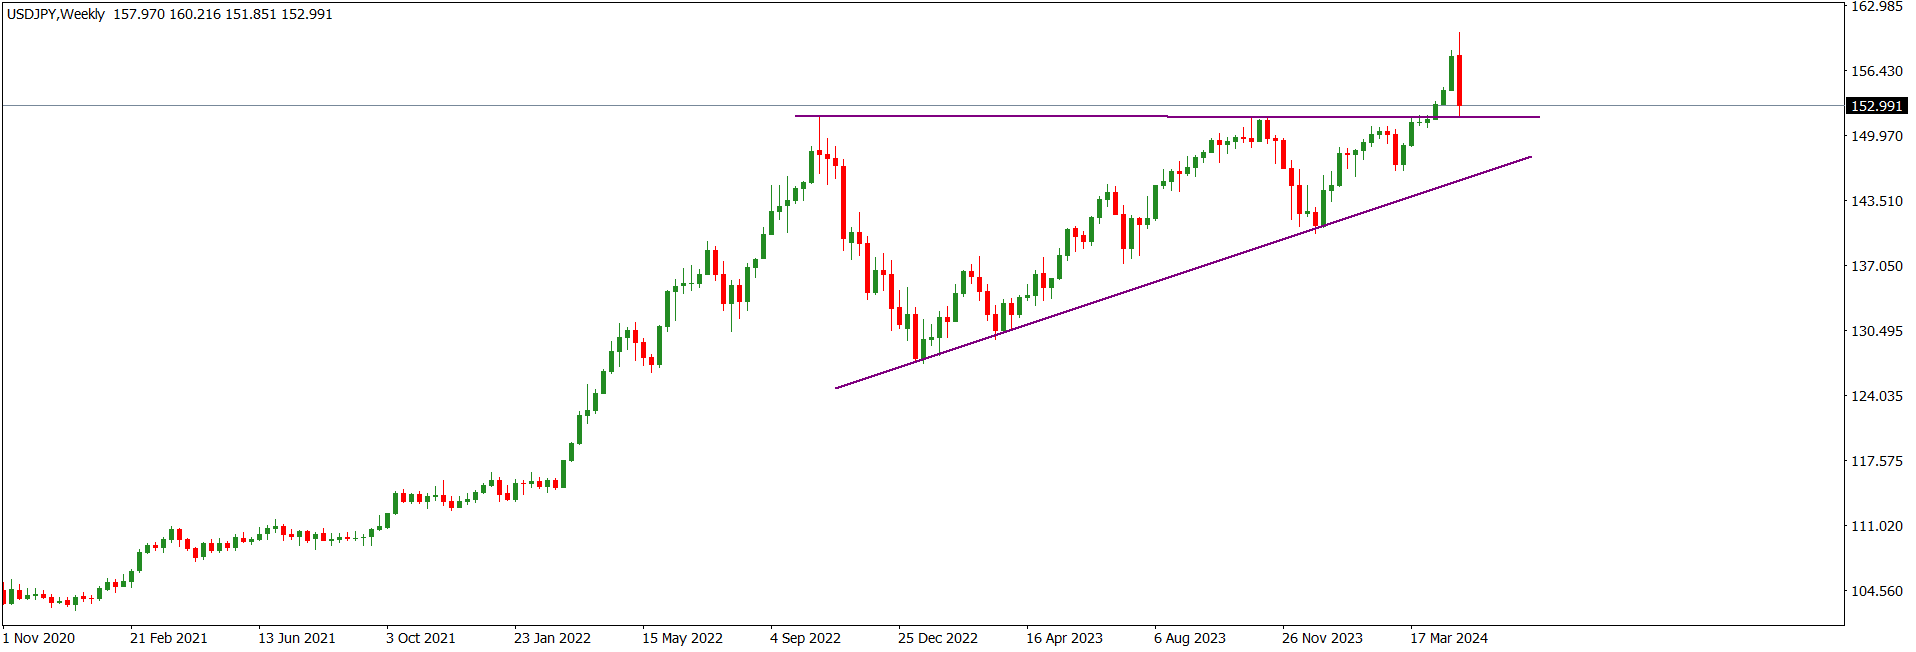
USDJPY market operation on the weekly time frame is bullish. Last week, the market operation printed a relatively big bullish continuation candlestick that resulted in an all-time high of 158.300.
USDJPY price action on the daily time frame is bullish. The bullish candlestick printed last Friday issued an all-time high at the 158.300 area.
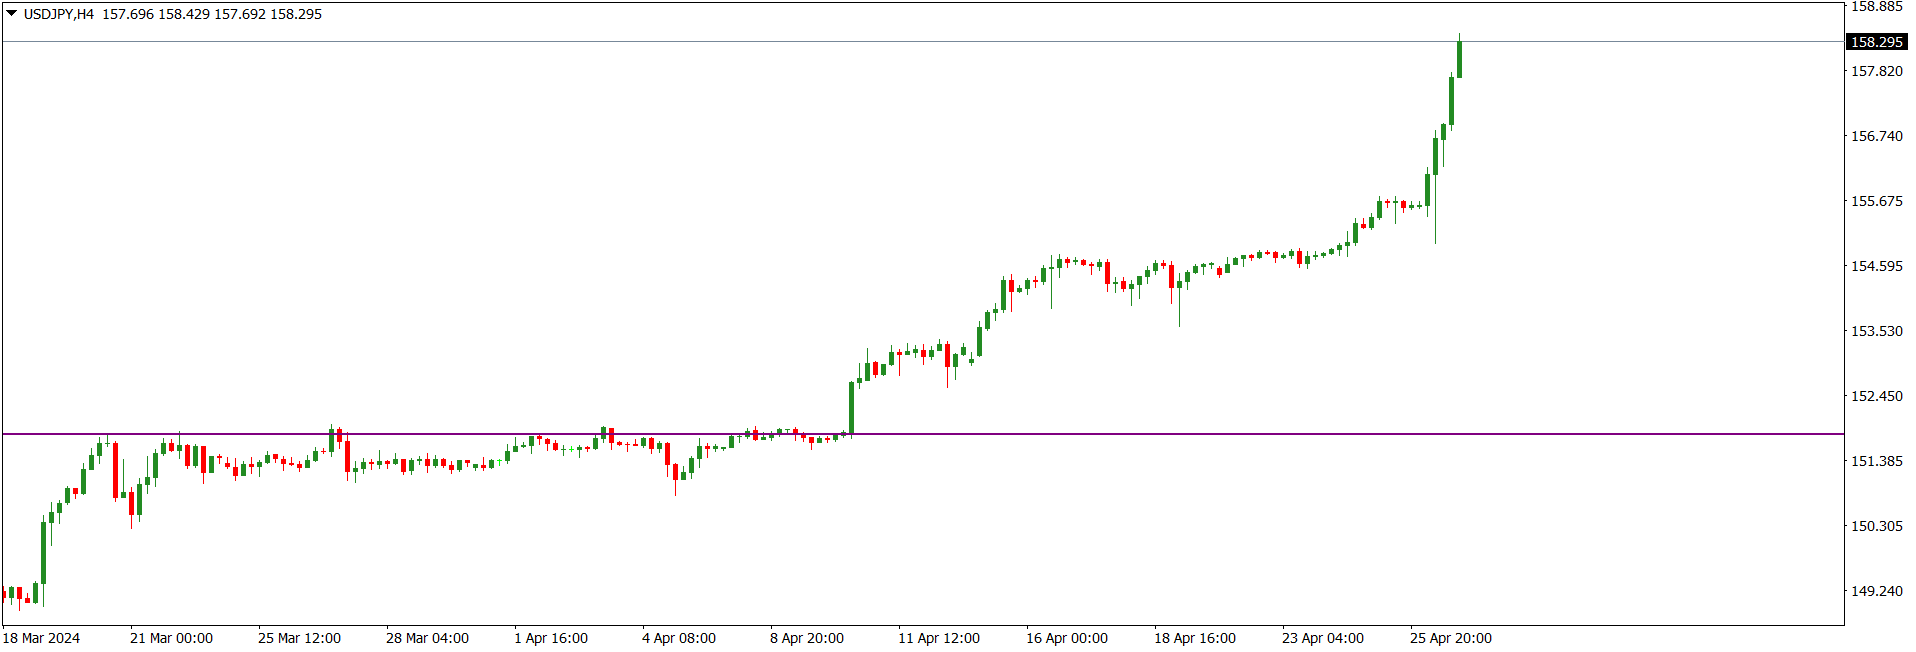
USDJPY price action on the H4 time frame made a northward drive to print an all-time high time at the 158.300 area. This was after a long period of sluggish momentum and consolidation. We should not be surprised to see bearish challenge of further bullish drive, or a decline in bullish momentum, in the next few days. As the recent USDJPY price action was parabolic and led to the printing of an all-time high at the 158.300 area, we may soon see a bearish correction.
I may be wrong. Trade safe and prosper.
Trap
EURUSD Weekly Technical Outlook
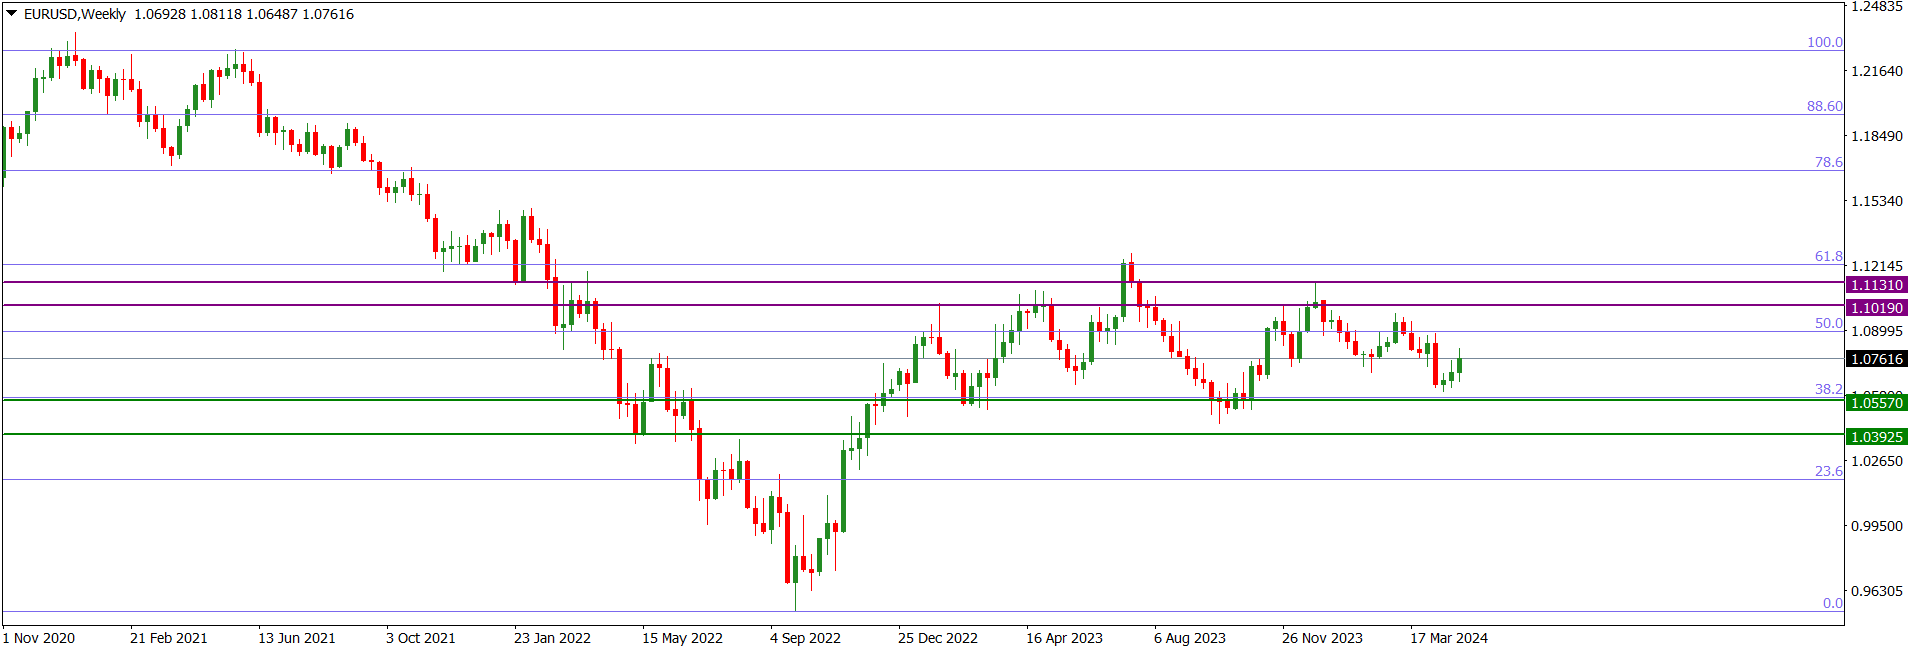
EURUSD market operation remains sideways near the 38.2 Fib area of a long-term bearish swing after a bearish drop from the 50 Fib area three weeks ago. The 1.05570 immediate horizontal support is in confluence with the 38.2 Fib.
EURUSD price action on the daily time frame went sideways after a bullish correction of the bearish technical impulse. Presently, price action is located at the 1.06920 intra-day horizontal support and is a few pips above the 38.2 Fib area of a long-term bearish swing. The 1.05570 immediate horizontal support on the weekly time frame is in confluence with the 38.2 Fib. The technical impulse favours bears more than bulls.
Although EURUSD price action on the H4 time frame is presently sideways, the preceding technical impulse is bearish. Furthermore, the dominant technical structure is bearish.
I may be wrong. Trade safe and prosper.
Trap
GBPUSD Weekly Technical Outlook
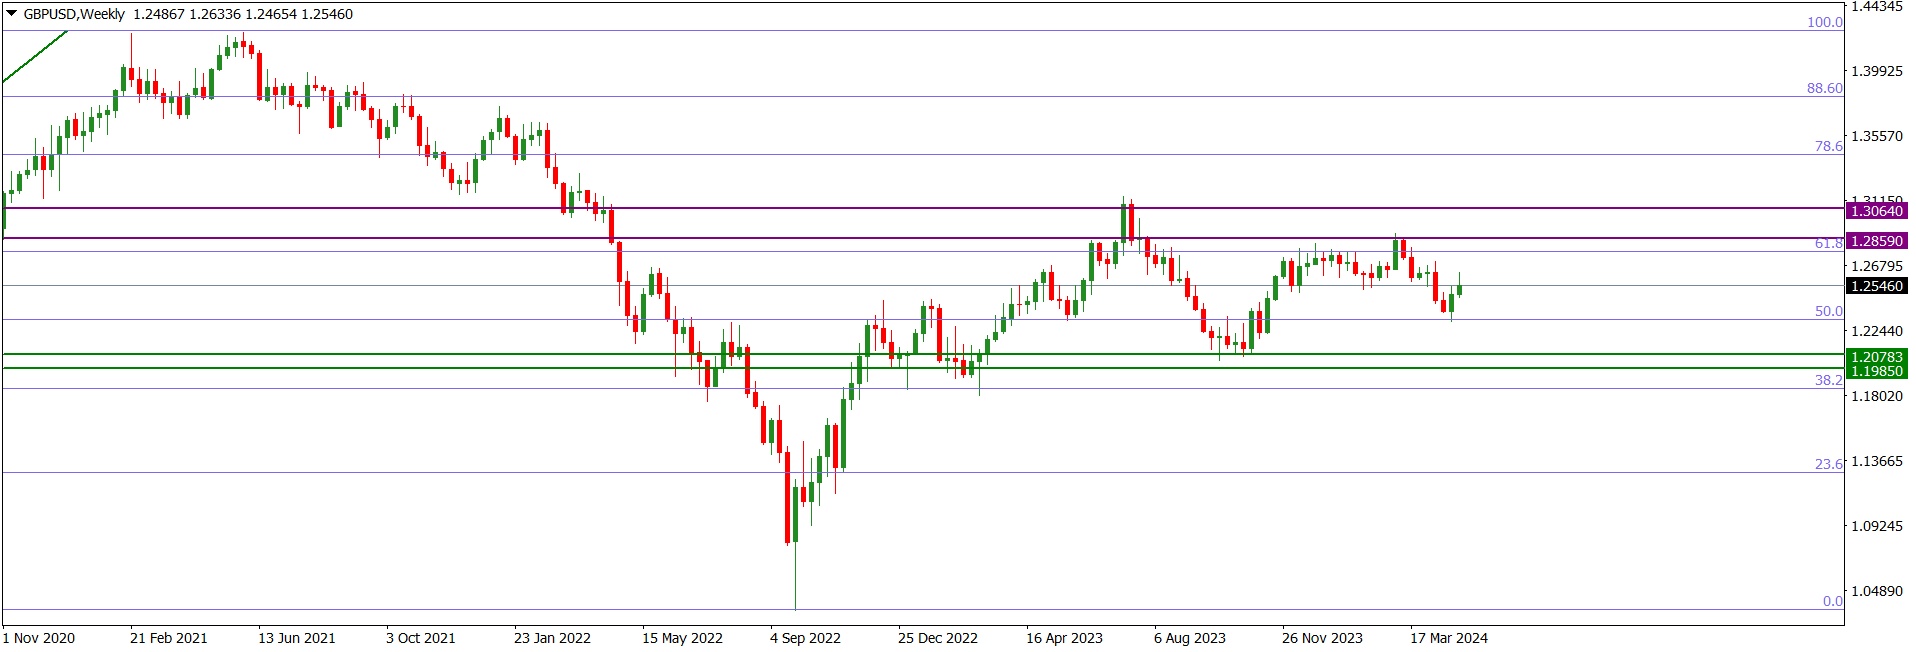
GBPUSD market operation on the weekly time frame has turned sideways at the 50 Fib area of a long-term bearish swing. Seven weeks ago, there was a bearish rejection of the bullish retest of the 61.8 Fib area. Although a bearish drive to the 50 Fib area began three weeks ago, bulls resisted the move last week.
GBPUSD price action on the daily time frame is making a correction of a long-term bearish swing. Presently, price action is sideways at the 1.24910 horizontal resistance. But the technical impulse favours bears more than bulls.
Although the GBPUSD price action on the H4 time frame turned sideways after a northward drive, the technical impulse favours bears more than bulls. Also, the dominant technical structure is bearish.
I may be wrong. Trade safe and prosper.
Trap
XAUUSD Weekly Technical Outlook
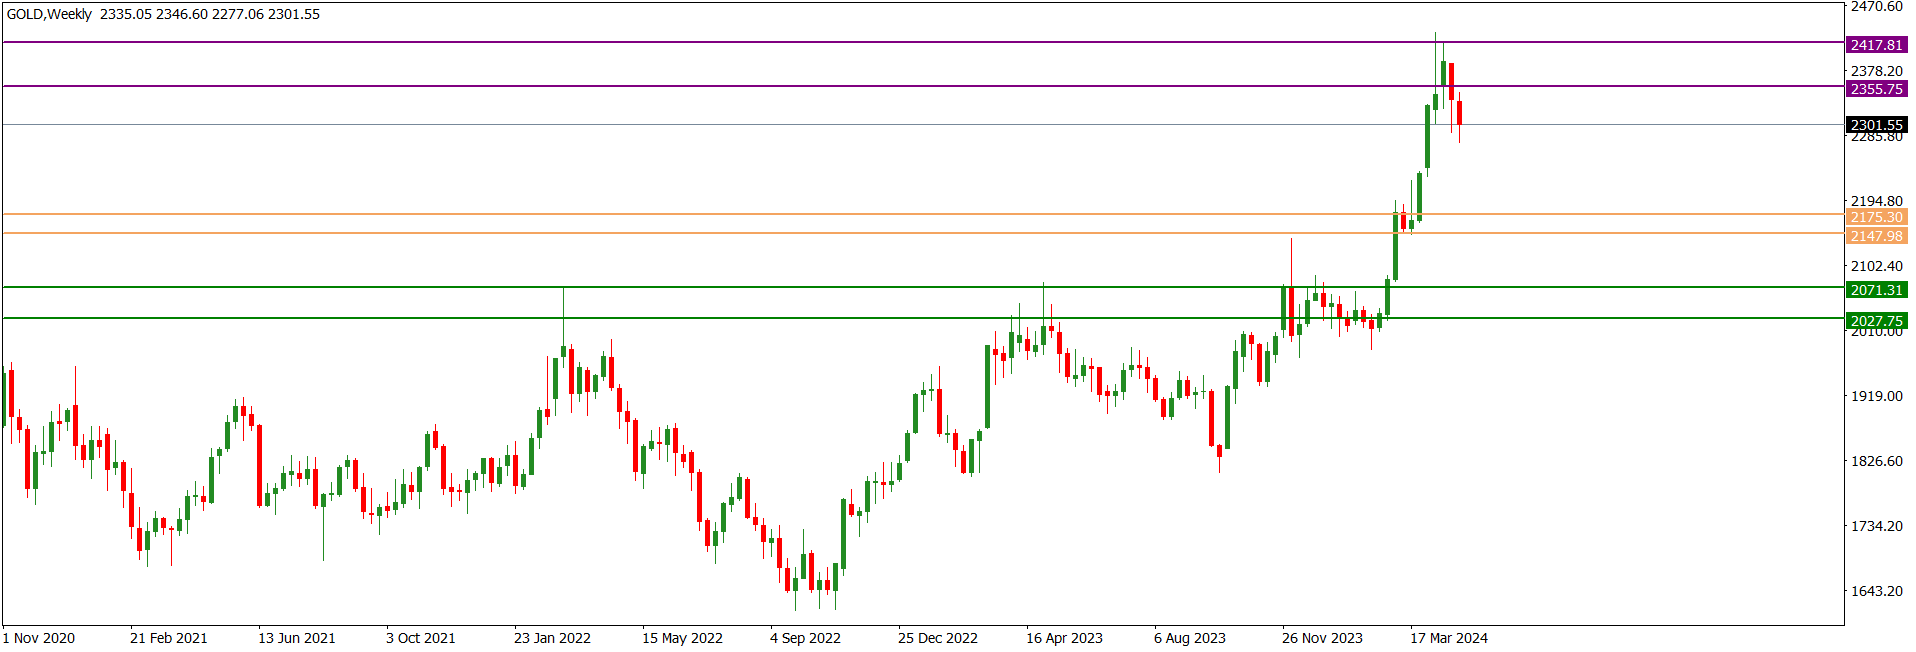
XAUUSD market operation printed a bullish candlestick with a relatively long, upper-wick in April, technically a bearish pinbar, to print an all-time high at the 2431.40 area. This indicates that we would see a northward retest of an area of value before a southward drive.
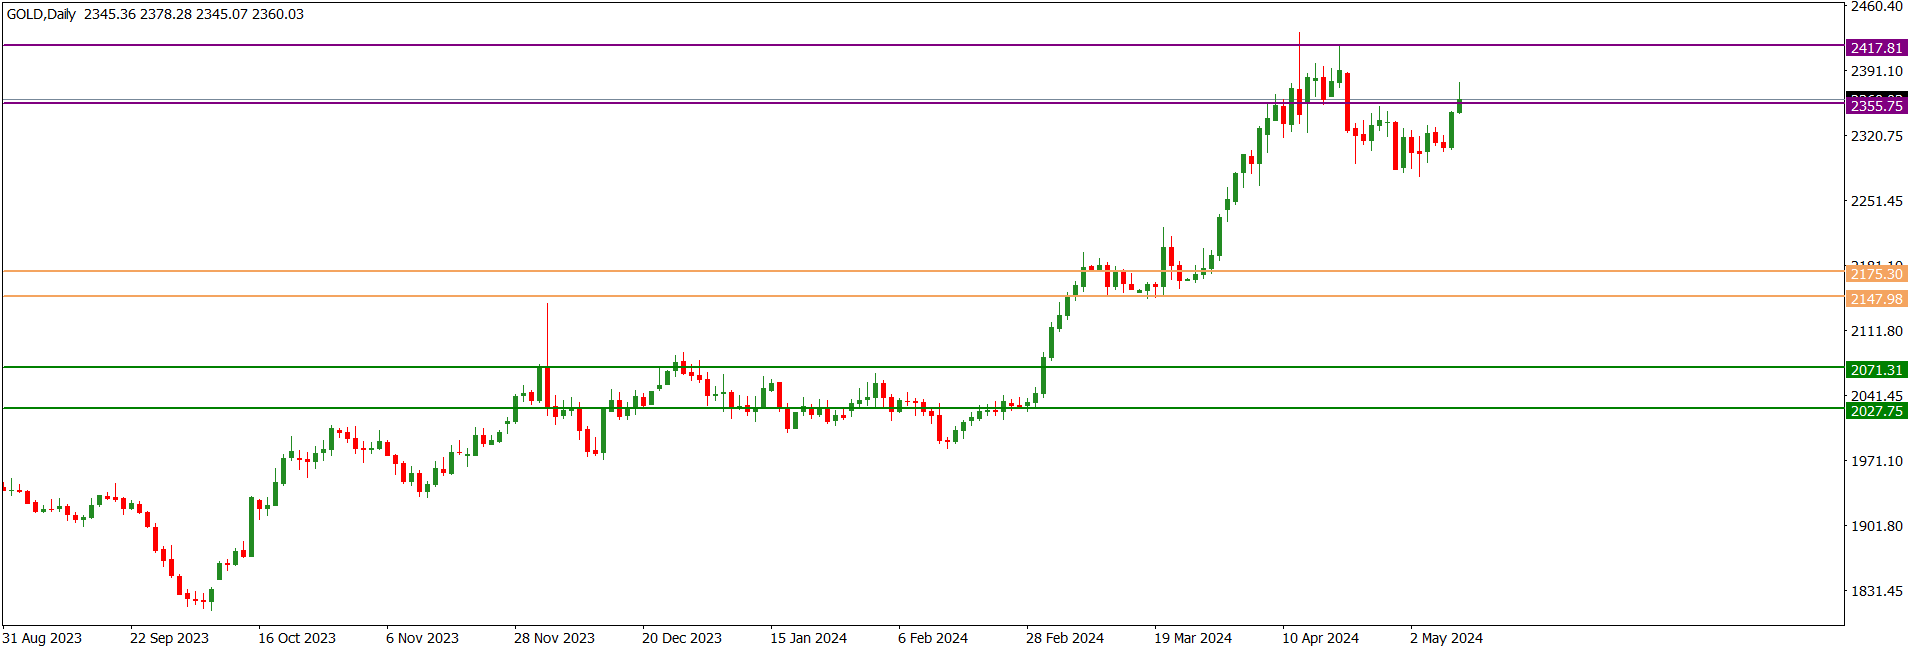
XAUUSD market operation turned bearish on the weekly time frame last week after a breakdown of the 2355.75 horizontal support area two weeks ago. Presently, market operation is tackling the 2301.55 horizontal support area.
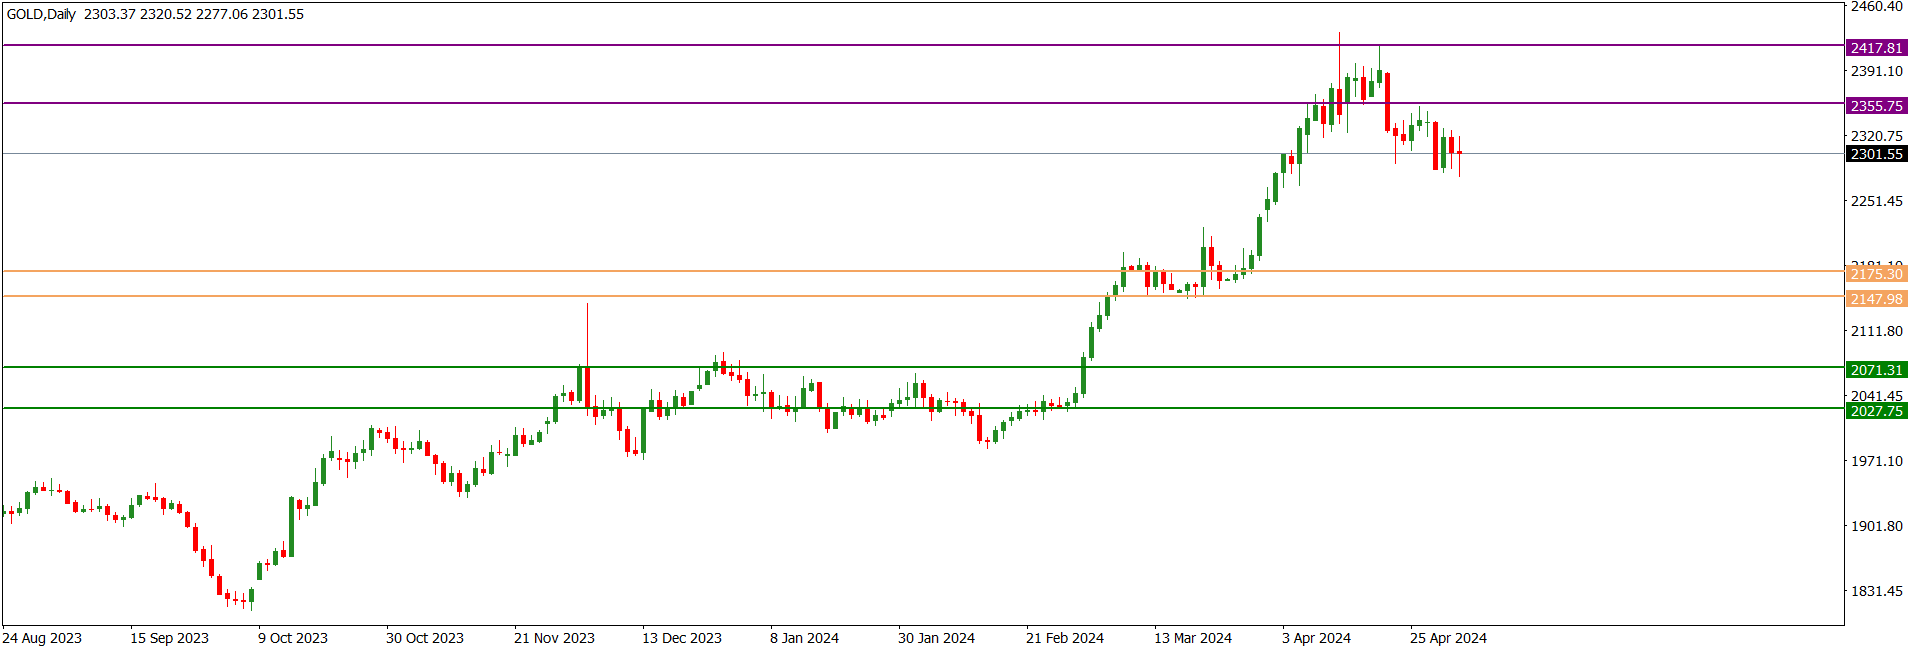
XAUUSD price action on the daily time frame turned sideways after a bearish breakdown of the 2355.75 horizontal support area. Presently, it is tackling the 2301.55 horizontal support area. Last Friday, price action printed an indecision candlestick in the area. I suspect that we may see a brief bullish pullback to an intra-day area of value before a further southward drive. But what price action does in the 2301.55 area in the early part of this week would be critical for medium-term directional trading.
I may be wrong. Trade safe and prosper.
Trap
USDJPY Weekly Technical Outlook
USDJPY market operation printed a bullish candlestick in April to create an all-time high of 160.216. The bullish drive in April was a breakout from the 151.900 horizontal resistance area that had been in place since October 2022.
USDJPY market operation printed a bearish engulfing candlestick last week. The bearish drive rejected an all-time high at the 160.200 area. However, the lower tail on the candlestick indicates that bulls are still influential in the market.
USDJPY price action on the daily time frame took on a bearish mode for much of last week. However, the bearish momentum decreased as bulls resisted a breakdown of the 151.900 area, which was a long-term horizontal resistance until turned support on April 15. Technically, we may still see a bullish pullback before a further southward drive.
I may be wrong. Trade safe and prosper.
Trap
EURUSD Weekly Technical Outlook
EURUSD market operation on the monthly time frame printed a miniature bearish candlestick in April. This printing was just above the 38.2-fib retracement area of the bearish swing that began in June 2021.
EURUSD market operation issued a bullish corrective print last week. This was in the context of a bullish retracement of a bearish swing from the 38.2 Fib area. Technically, we may still see further bullish correction in the early part of this week.
EURUSD price action on the daily time frame assumed a bullish mode in the latter part of last week after some sideways. Presently, the technical impulse favours bulls, but any northward move will be corrective in nature. This would give way to a southward rotation, perhaps to the 1.05570 significant horizontal support area (green).
I may be wrong. Trade safe and prosper.
Trap
GBPUSD Weekly Technical Outlook
GBPUSD market operation on the monthly time frame printed a doji-like or miniature candlestick in April. This printing was just above the 50-fib retracement area of the bearish swing that began in June 2021.
GBPUSD market operation issued a bullish corrective print last week. This was in the context of a bullish retracement of a bearish swing from the 50 Fib area. Technically, we may still see further bullish correction in the early part of this week, which may see a retest of the 1.27000 intra-day value area.
GBPUSD price action on the daily time frame issued a relatively long, ‘upper wick’ pin bar on Friday. This may result in a bullish retest of intra-day market imbalance or value area before a southward rotation. The dominant technical structure is bearish.
I may be wrong. Trade safe and prosper.
Trap
XAUUSD Weekly Market Operation
XAUUSD market operation on the weekly time frame issued a bullish candlestick last week that retested the 2355.75 horizontal resistance area. There was a bearish breakdown of the area three weeks ago.
XAUSD price action on the daily time frame made a bullish retest of the 2355.75 horizontal resistance on Friday. There was a bearish breakdown of the area on April 22, 2024. Although the technical impulse favours bears more than bulls, we may still see further northward move before a southward turnaround.
XAUUSD price action on the H4 time frame went sideways on Friday after a bullish retest of the 2355.75 horizontal resistance. The technical impulse favours bears more than bulls.
I may be wrong. Trade safe and prosper.
Trap
USDJPY Weekly Technical Outlook
USDJPY market operation went bullish last week after a bearish retest of the 151.500 horizontal support area. Further bullish drive may see a retest of the 158.000 horizontal resistance.
USDJPY price action on the daily time frame went sideways on Friday after a bullish drive that rejected the 151.500 horizontal support area. Technically, we may still see further northward move to retest an area of value, such as the 158.000 horizontal resistance.
USDJPY price action is in a consolidating mode after a bullish rejection of the 151.500 horizontal support area. Recent technical patterns on the H4 time frame favour a bullish charge for liquidity grab.
I may be wrong. Trade safe and prosper.
Trap
EURUSD Weekly Technical Outlook
EURUSD market operation on the weekly time frame turned sideways last week as it retested the 1.07697 horizontal resistance area. Generally, market operation is making a bullish correction of a bearish swing traceable to May 2021. Presently, the market operation is located within the 38.2/50 Fib zone.
EURUSD price action on the daily time frame went sideways as it tackles the 1.07697/1.08100 horizontal resistance zone. The dominant technical structure is bearish.
EURUSD price action on the H4 time frame is consolidating in an expanding wedge (purple) in the context of a dominant technical structure. Presently it is near the upper trendline of the wedge, and we may still see further northward move, perhaps to retest an intra-day area of value such as 1.08116/1.08630 (blue), such a move would be temporary, giving way to a bearish rotation. The dominant technical structure is bearish.
I may be wrong. Trade safe and prosper.
Trap
GBPUSD Weekly Technical Outlook
GBPUSD market operation on the weekly time frame turned sideways last week as it retested the 1.25237 horizontal resistance area. Generally, market operation is making a bullish correction of a bearish swing traceable to May 2021. Presently, the market operation is located within the 50/61.8 Fib zone.
GBPUSD price action on the daily time frame went sideways as it tackles the 1.25237 horizontal resistance area. The bearish pinbar printed on May 3 apparently rejected the 1.23310 area of value that was within an intra-day market imbalance. There has not been significant bearish follow-through and bullish resistance has been weak. The preceding technical impulse has been bearish. Thus, the technical outlook favours bears more than bulls. The dominant technical structure is bearish.
GBPUSD price action on the H4 time frame is consolidating within the 1.24670/1.25846 horizontal channel (blue). The preceding technical impulse is bearish and the dominant technical structure is bearish.
I may be wrong. Trade safe and prosper.
Trap
XAUUSD Weekly Technical Outlook
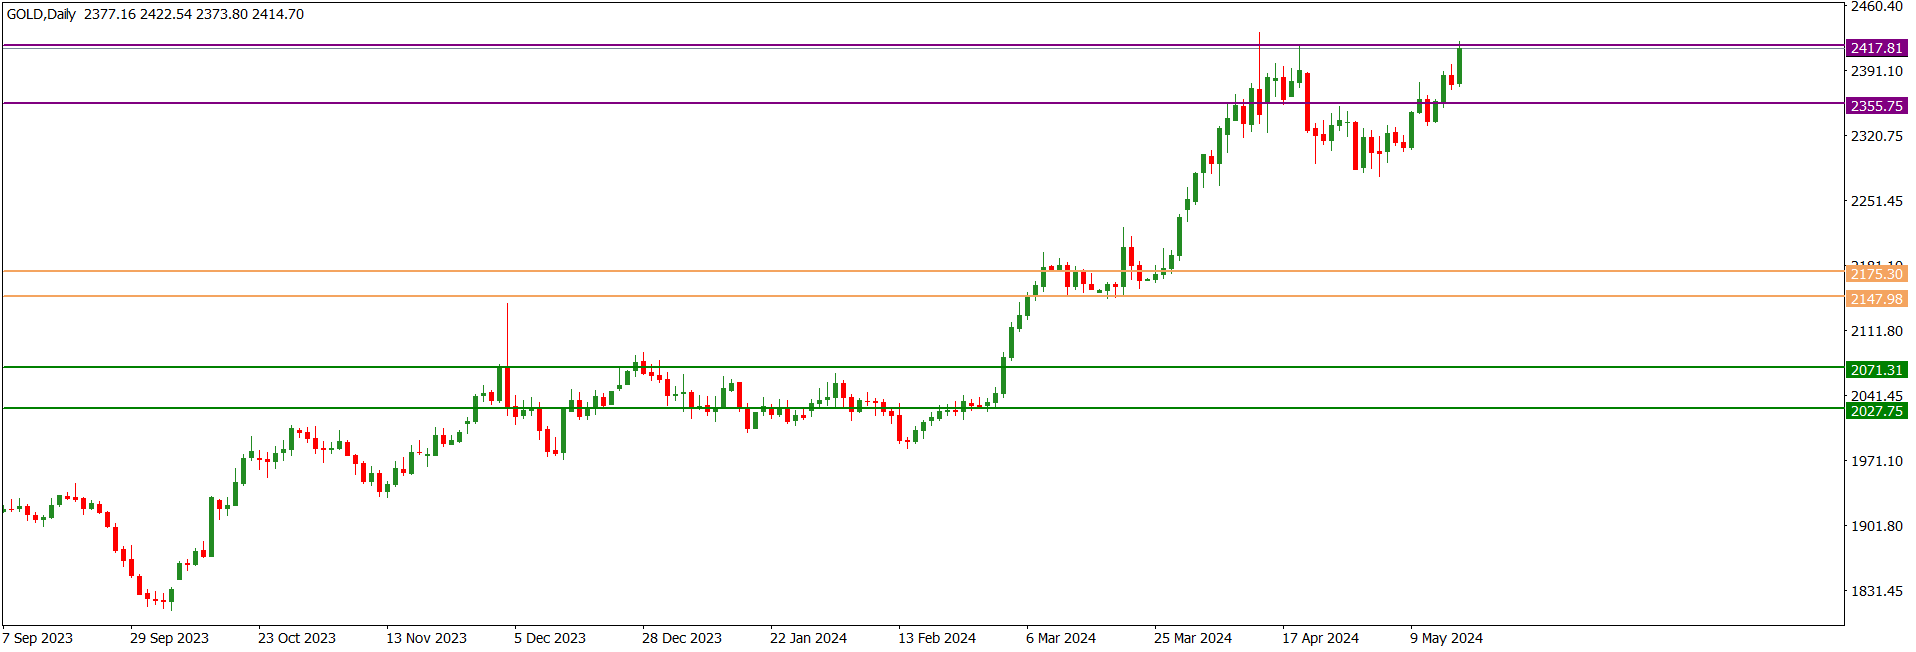
XAUUSD market operation issued a relatively bullish candlestick last week to retest the 2355.75/2417.81 horizontal resistance zone (purple). Presently, market operation is at the upper boundary of the zone.
XAUUSD price action on the daily time frame is in a bullish mode. Presently, it is tackling the 2417.81 horizontal resistance area seen on the weekly time frame.
XAUUSD price action on the H4 time frame has turned sideways as it tackles the 2417.81 horizontal resistance area seen on the weekly time frame. We cannot rule out further northward movement before a bearish correction.
I may be wrong. Trade safe and prosper.
Trap
USDJPY Weekly Technical Outlook
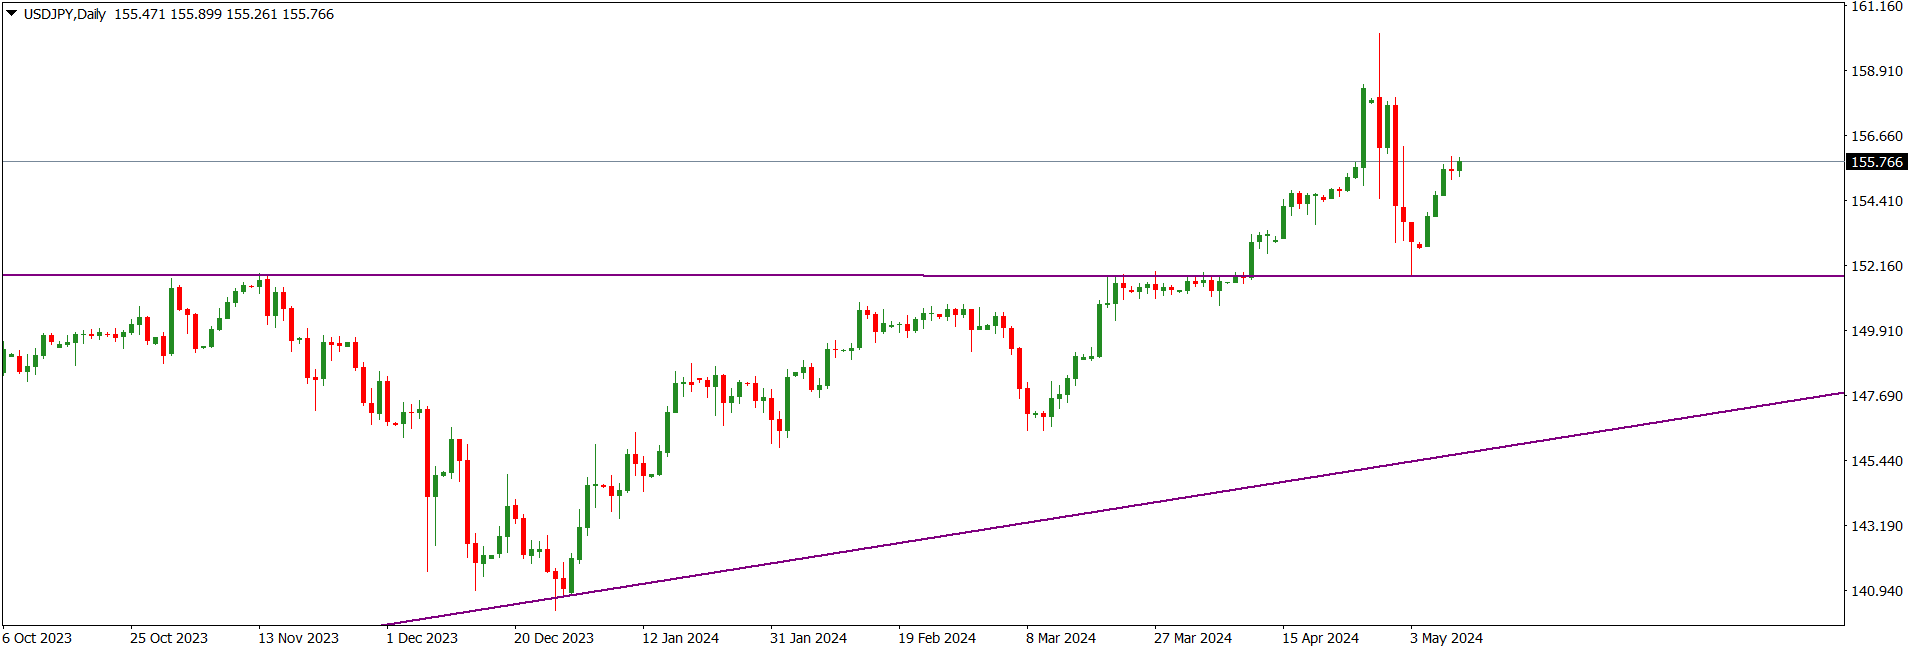
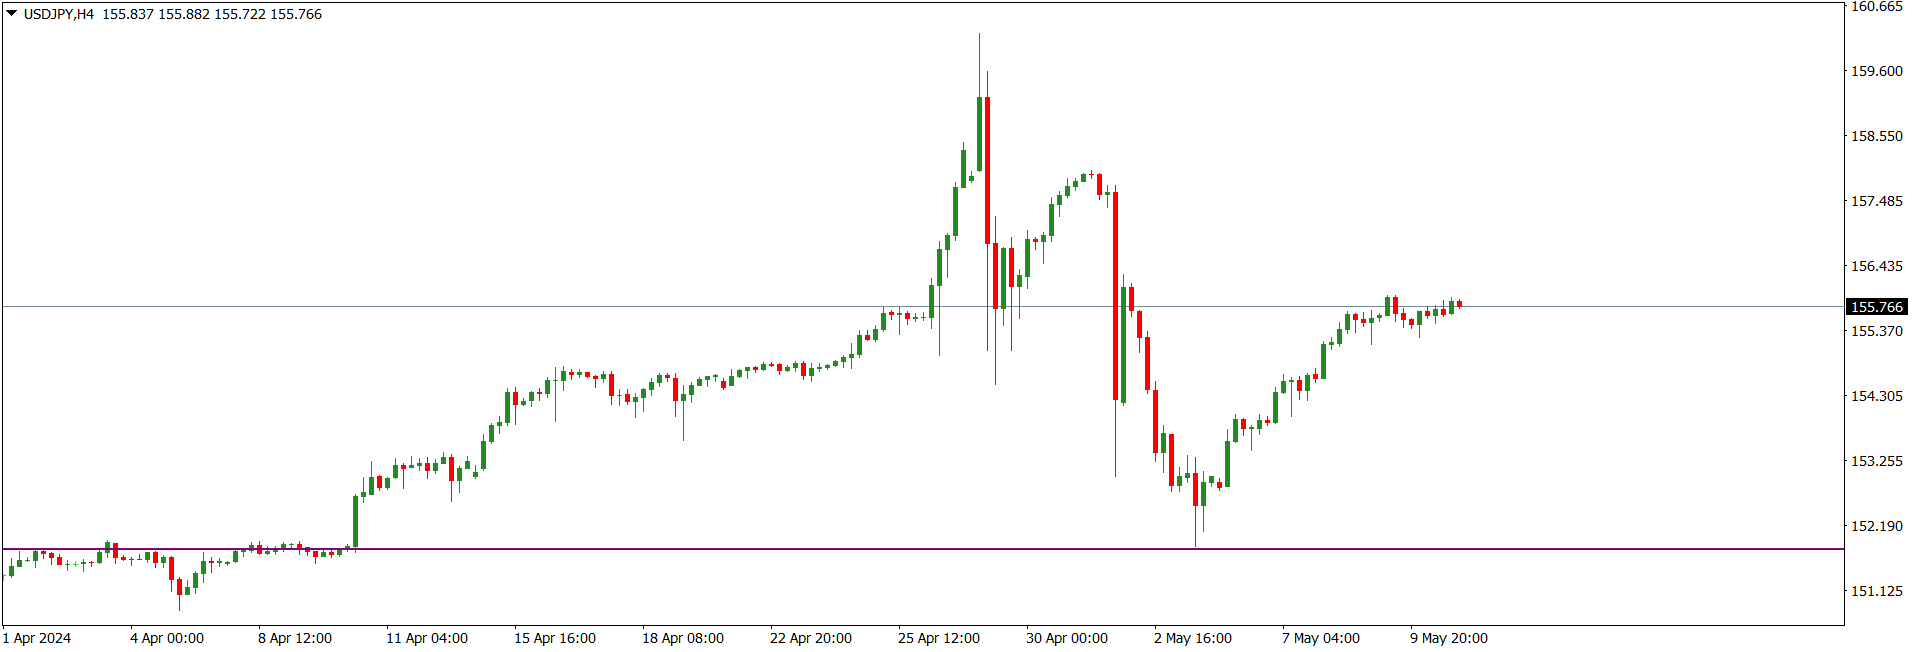
USDJPY market operation on the weekly time frame turned sideways last week after retesting the 155.00 area. The market operation had made a bullish rejection of the 152.00 horizontal support area a week earlier.
USDJPY price action on the daily time frame is retesting the 155.00 horizontal resistance area after a bearish breakdown. We cannot rule out further northward move in the early part of the week.
USDJPY price action on the H4 time frame went sideways at the 155.00 horizontal resistance area after a bullish retest. Technically, we may still see a northward move for liquidity grab at an intraday area of value such as the market imbalance beyond the 156.500 area on the H4 time frame.
I may be wrong. Trade safe and prosper.
Trap
EURUSD Weekly Technical Outlook
Last week, EURUSD market operation on the weekly time frame made a bullish retest of the 50 Fib retracement of the bearish swing traceable to May 2021. The area is in alignment with the 1.08680 horizontal resistance area.
EURUSD price action on the daily time frame went sideways after a bullish retest of the 1.08680 horizontal resistance area seen on the weekly time frame. The dominant technical structure is bearish. Nevertheless, although technically the preceding impulse is bearish, we may still see further northward move before a southward turnaround.
EURUSD price action on the H4 time frame is making a bullish retest of the 50 Fib retracement of the bearish swing traceable to May 2021. Presently, it is in a sideway mode, but we may see a northward liquidity sweep before a bearish rotation. The dominant technical structure is bearish.
I may be wrong. Trade safe and prosper.
Trap
GBPUSD Weekly Technical Outlook
GBPUSD market operation on the weekly time frame has broken above the 50 Fib retracement of the bearish swing traceable to May 2021. Last week’s bullish print broke above the area of consolidation that had been in place for two weeks. This, technically, portends bullish ambition to tackle the 61.8 Fib, an area that is some pips below the 1.28590 horizontal resistance area.
GBPUSD price action on daily time frame is in a bullish mode. Further northward move may target the 1.27980 supply area, an area that aligns with the 61.8 Fib retracement of the bearish swing traceable to May 2021. The dominant technical structure is bearish.
GBPUSD price action on the H4 time frame turned sideways after a bullish breakout as it tackles the 1.27000 intraday horizontal resistance. Technical impulse favours further northward movement, which may expose the 1.28590 horizontal resistance area (purple) seen on the daily time frame. However, as the dominant technical structure is bearish, this may soon give way to a southward turnaround.
I may be wrong. Trade safe and prosper.
Trap
XAUUSD Weekly Technical Outlook
XAUUSD market operation on the weekly time frame is in a bearish mode. Last week, market operation broke down the 2355.75/2417.81 horizontal channel which had served as resistance for several weeks. There was a bullish charge towards the upper boundary of the channel two weeks ago but last week a relatively strong bearish drive broke down the channel.
XAUUSD price action on the daily time frame went sideways on Friday after a bearish breakdown of the 2355.75/2417.81 horizontal channel which had served as resistance for several weeks. Presently, price action is tackling the 2333.54 horizontal support area. The technical impulse favours bears more than bulls.
XAUUSD price action on the H4 time frame is presently sideway as it tackles the 2333.54 horizontal support area. However, as the technical impulse favours bears, we may see further southward move in the early part of this week.
I may be wrong. Trade safe and prosper.
Trap
USDJPY Weekly Technical Outlook
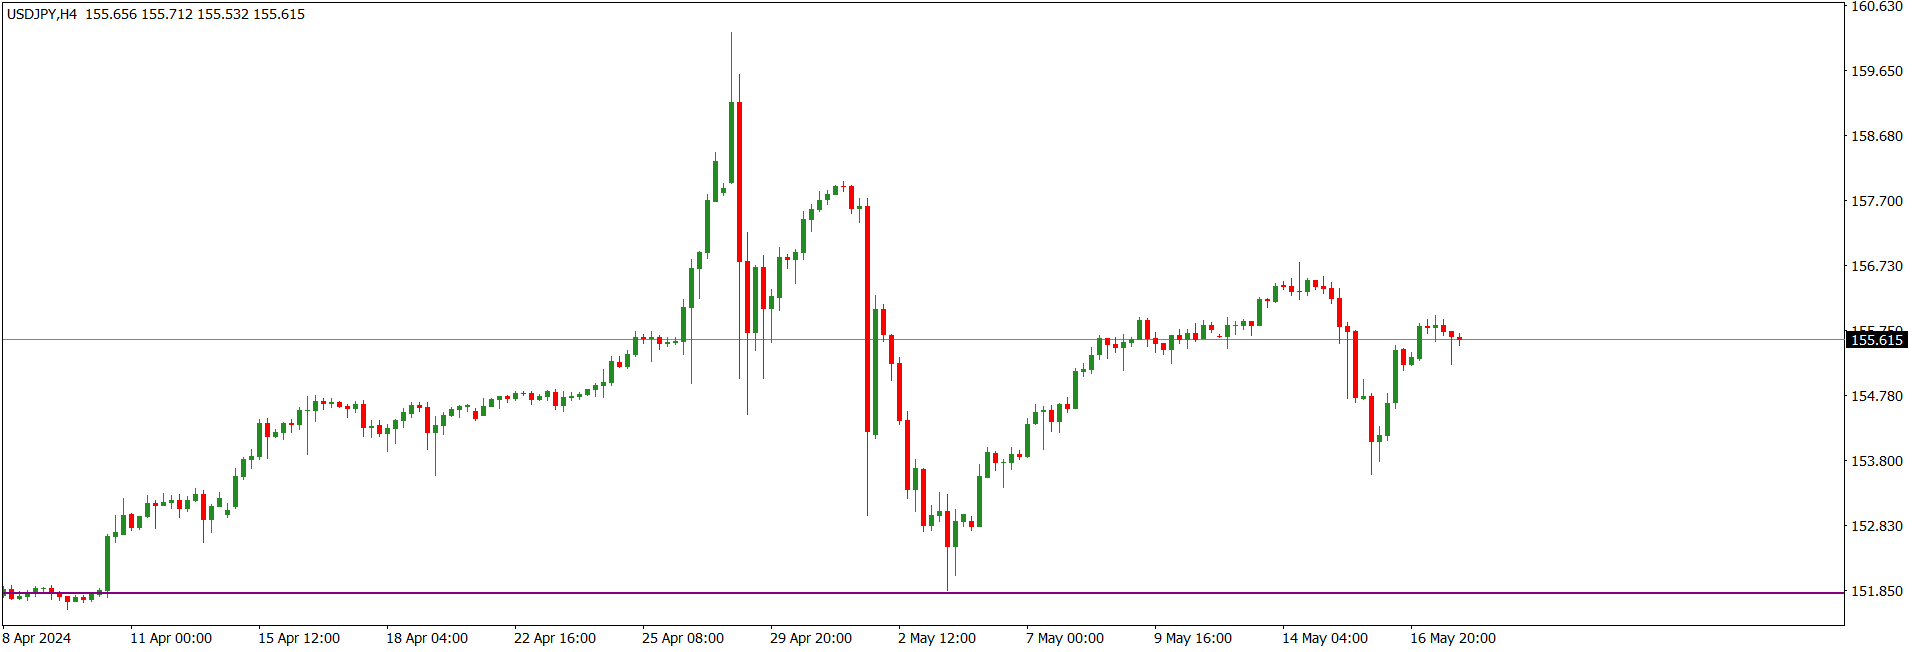
Last week, USDJPY market operation on the weekly time frame resumed a bullish mode after the sideways of two weeks ago.
The USDJPY price action on the daily time frame is presently sideways. Price action had pushed towards the 157.00 area but suffered a decline in momentum. The technical impulse is a bit ambivalent.
Although USDJPY price action on the H4 time frame is sideways as it tackles the 157.00 area, we may still see further northward move. The area was broken down on May 1, 2024.
I may be wrong. Trade safe and prosper.
Trap
EURUSD Weekly Technical Outlook
EURUSD market operation on the weekly time went sideways last week upon a retest of the 50 Fib area of the bearish swing that began in May 2021. There was a relatively strong bullish charge at the area two weeks ago, but bears effected a push back last week. However, the bearish push back was minimal.
EURUSD price action retested the 1.08950 horizontal resistance on May 16 before a bearish push back. The area is in alignment with the 50 Fib area of the bearish swing that began in May 2021. Thereafter price action went sideways for a few days before further bearish move on Wednesday. On Friday, bulls challenged further southward move. Should bulls be successful in their challenge, we may see further northward move to retest an intra-day area of value before a southward rotation. The preceding technical impulse favours bears more than bulls.
Although the EURUSD price action on the H4 time frame is presently sideways, the short-term momentum favours further northward move. However, as the dominant technical structure is bearish, any northward momentum will be short lived.
I may be wrong. Trade safe and prosper.
Trap
GBPUSD Weekly Technical Outlook
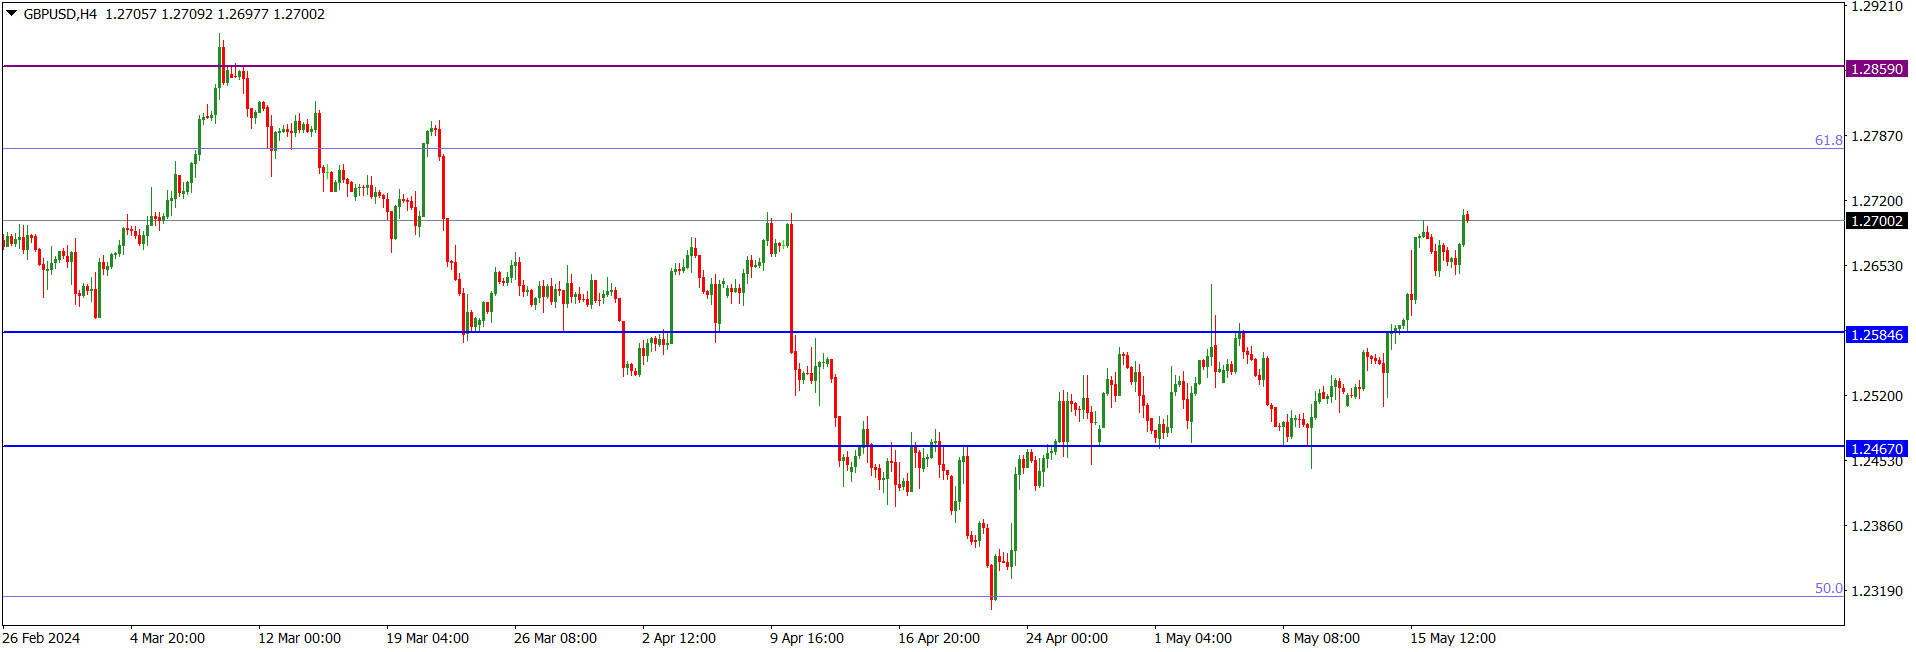
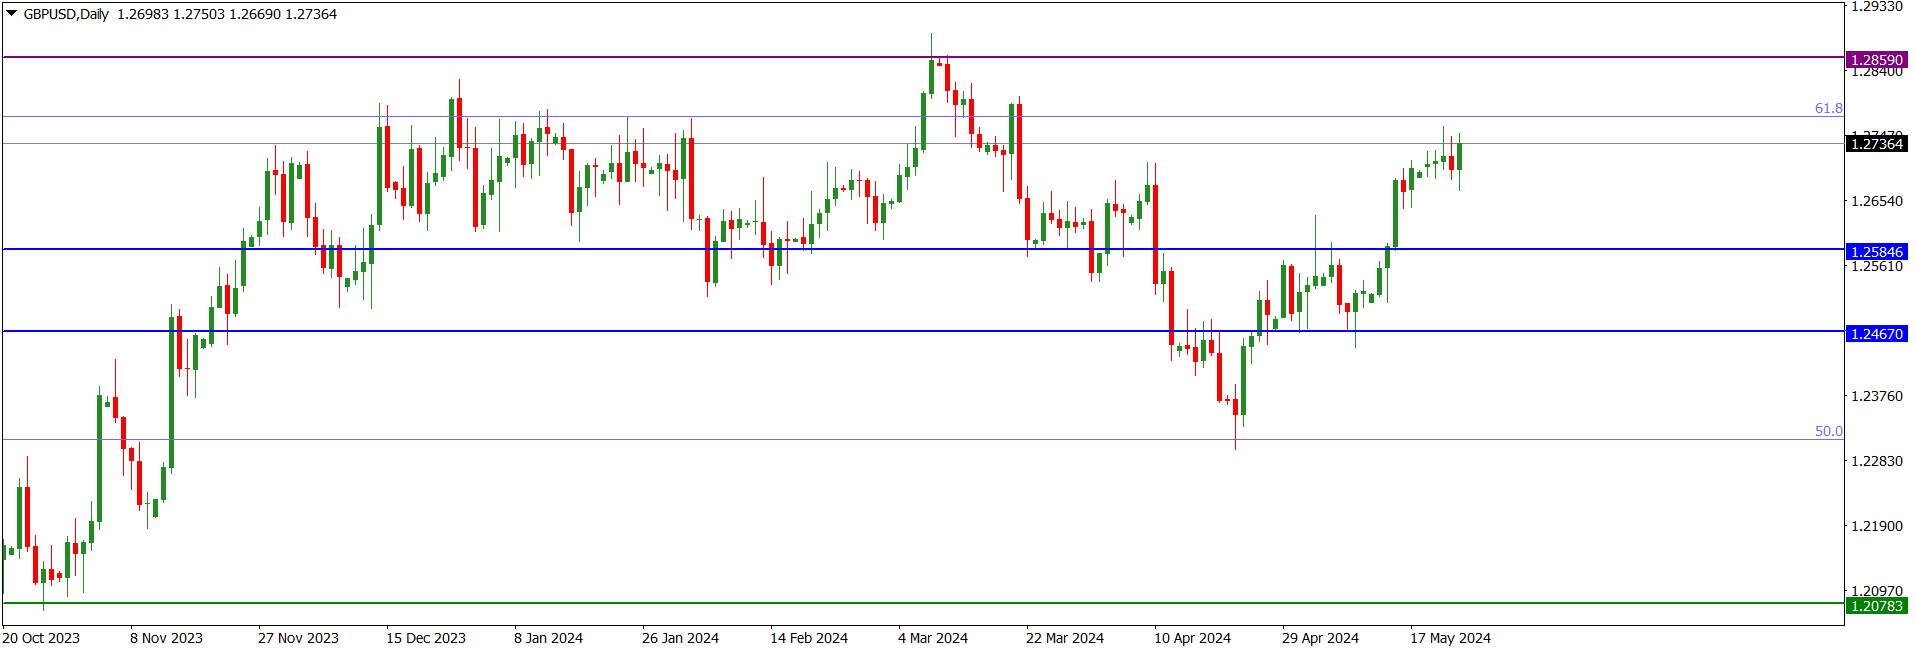
GBPUSD market operation on the weekly time went sideways last week upon a retest of the 68 Fib area of the bearish swing that began in May 2021. There was a relatively strong bullish charge at the area two weeks ago, but further bullish move last week was curtailed by a bearish challenge.
GBPUSD price action on the daily time frame made a bullish charge at the 68 Fib area of the bearish swing that began in May 2021 on Friday but was resisted by bears, resulting in a long-tailed doji. Further bullish charge at the area occurred on Friday. Technically, we may see a further northward move in the early part f this week. But the dominant technical structure is bearish, and such northward momentum would be short lived.
Although GBPUSD price action on the H4 time frame is presently sideways. The short-term impulse favours further northward move. Nevertheless, the dominant technical structure is bearish.
I may be wrong. Trade safe and prosper.
Trap
XAUUSD Weekly Technical Outlook
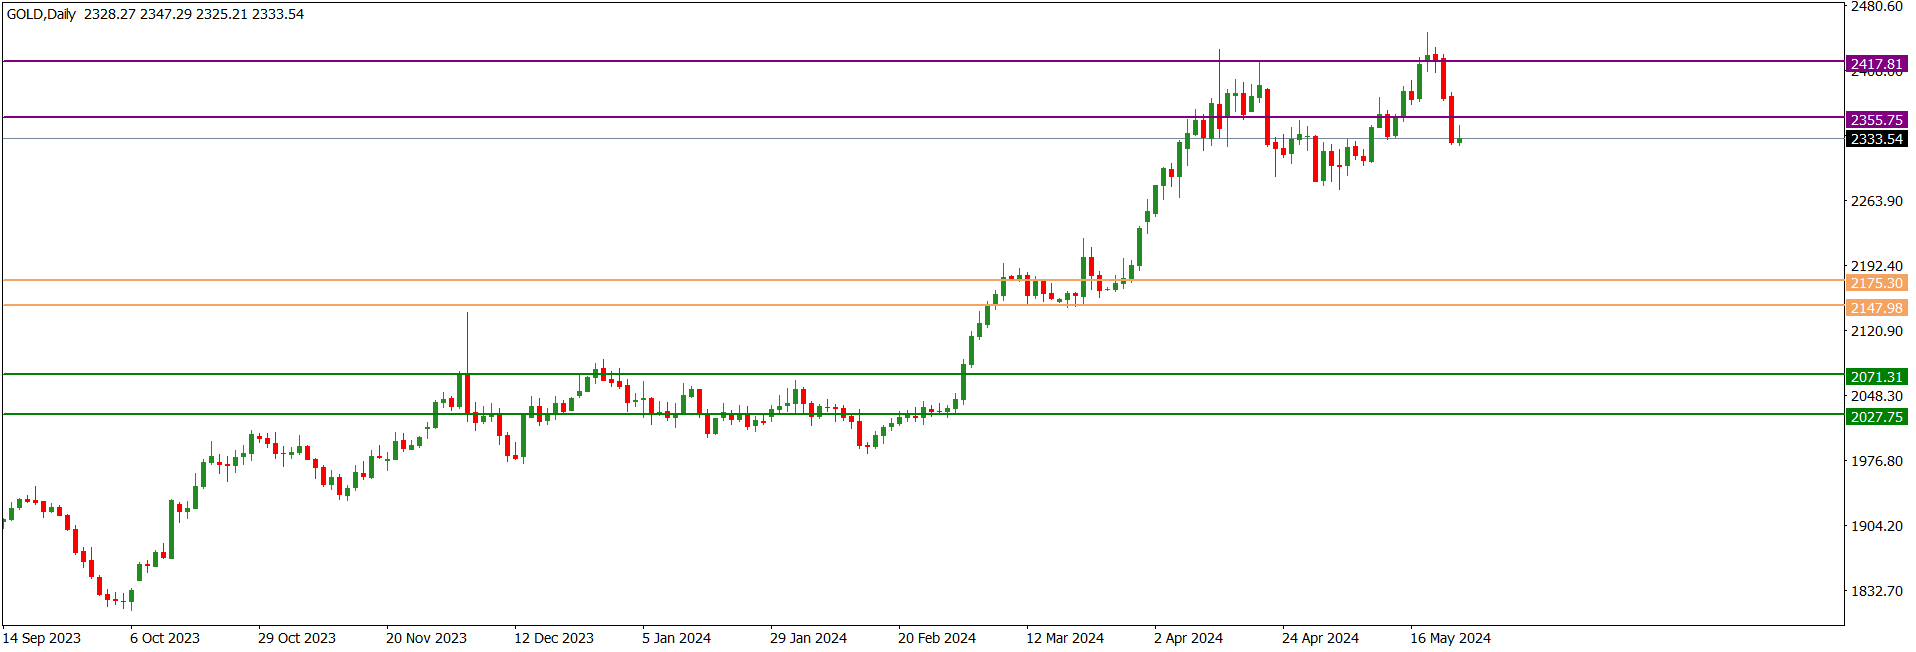
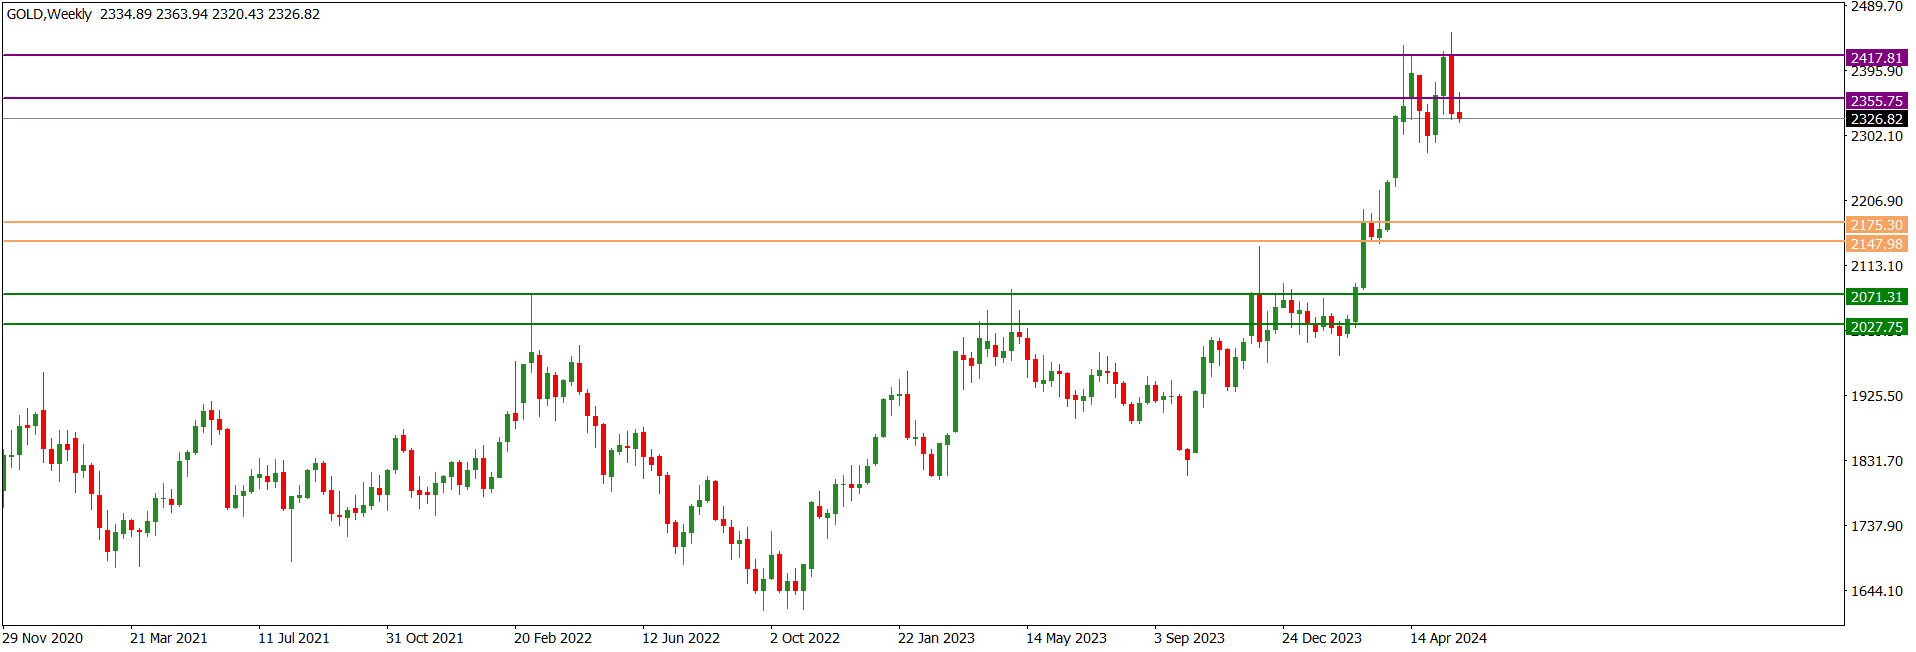
XAUUSD market operation on the monthly time frame continued a bullish disposition in May. However, bears put up a strong challenge to stymie the bullish drive as market operation printed another all-time high in May.
XAUUSD market on the weekly time frame went sideways last week after the bearish breakdown of the 2355.75 horizontal support area in the previous week.
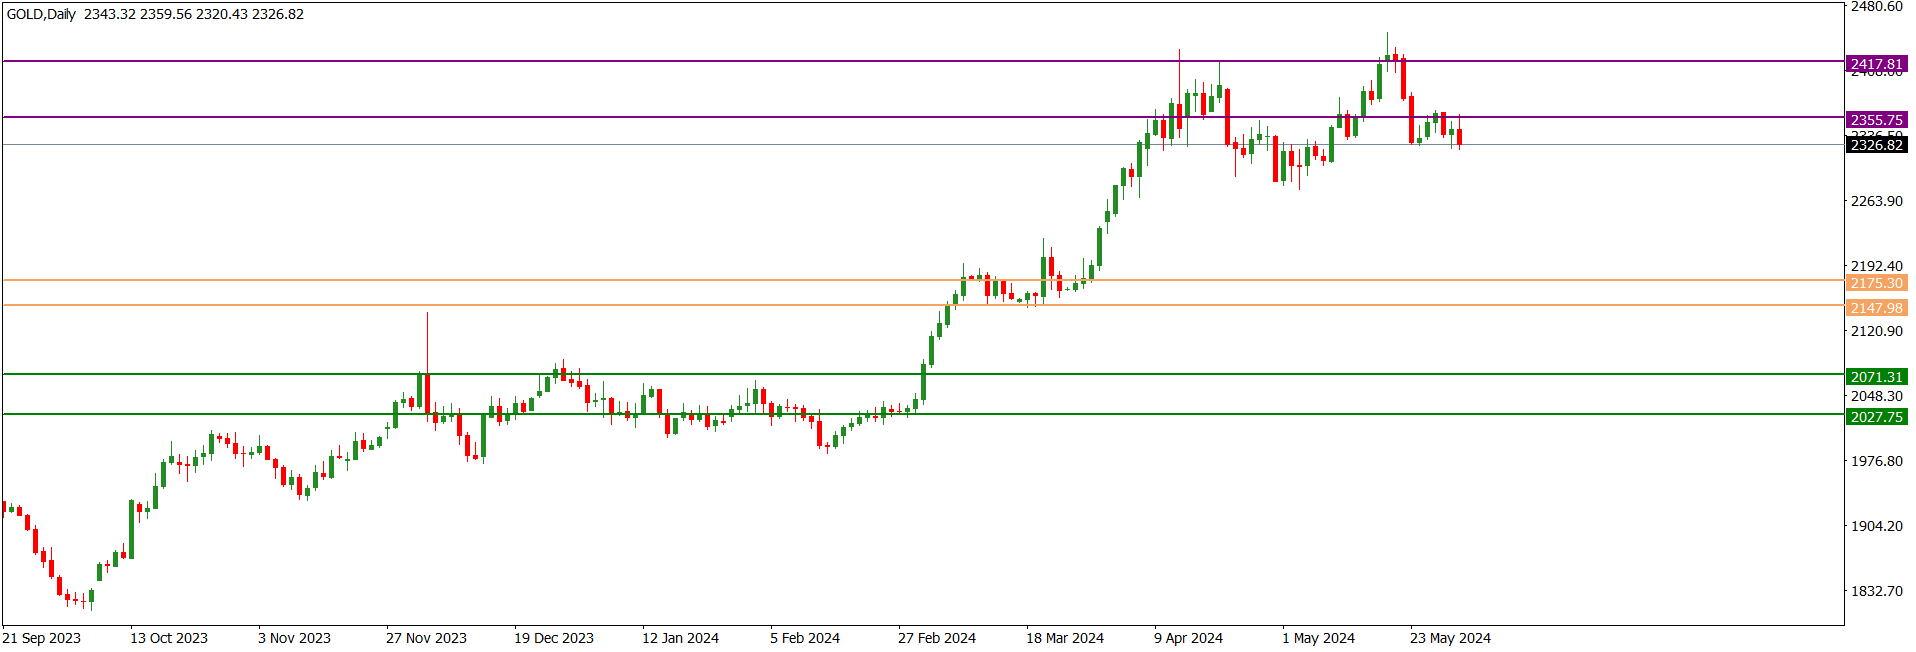
XAUUSD price action on the daily time frame is presently sideways. However, recent technical patterns favour a southward liquidity sweep to a value area.
I may be wrong. Trade safe and prosper.
Trap