USDJPY Weekly Tchnical Outlook
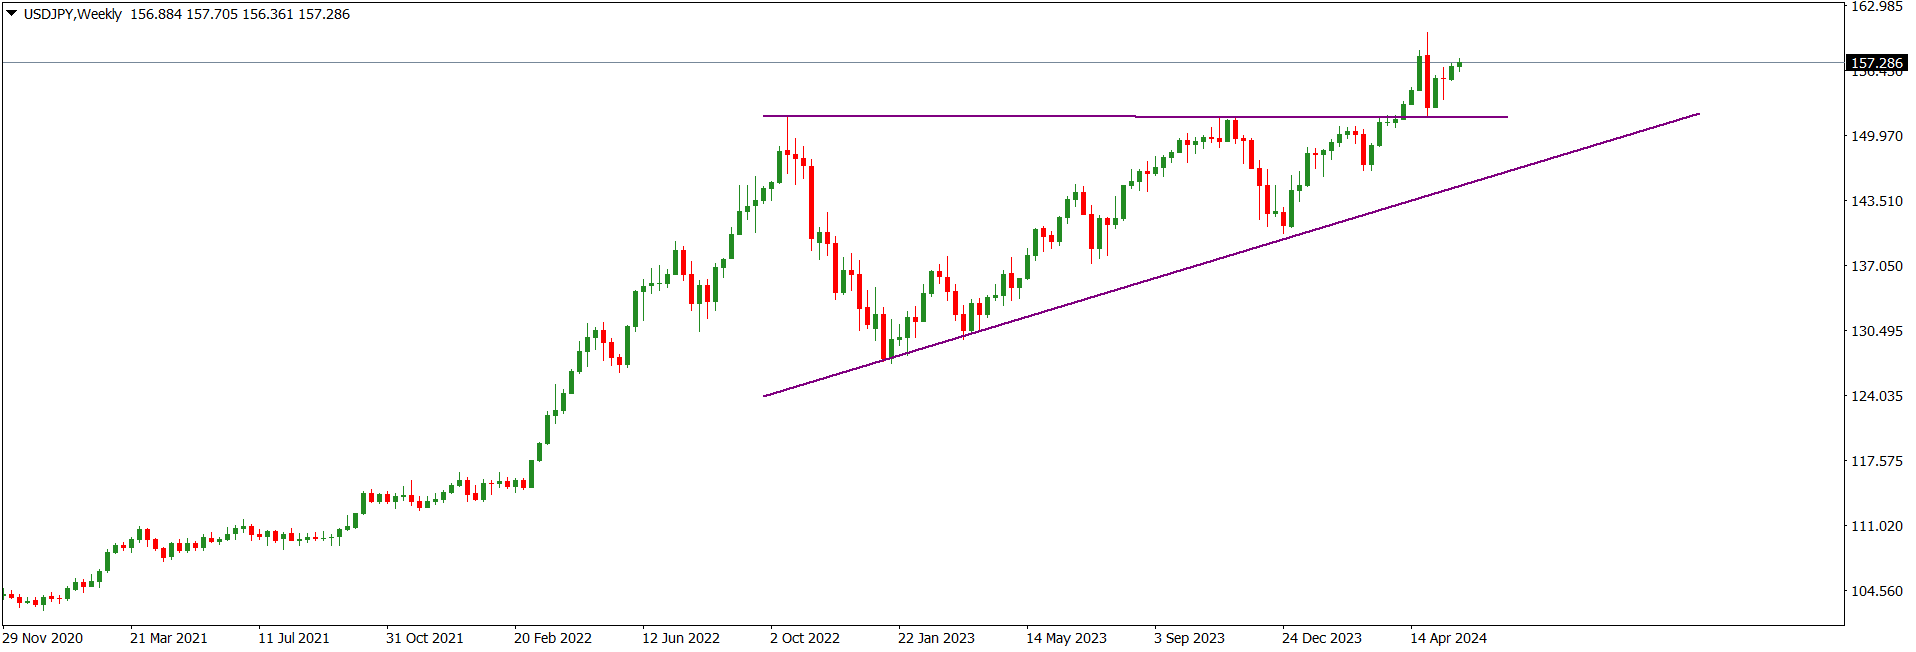
The USDJPY market operation on the monthly time frame retest the 157.290 horizontal resistance area in May but went sideways.
USDJPY market operation on the weekly time frame is experiencing a decline in bullish momentum. Presently, it is tackling the 157.290 horizontal resistance area.
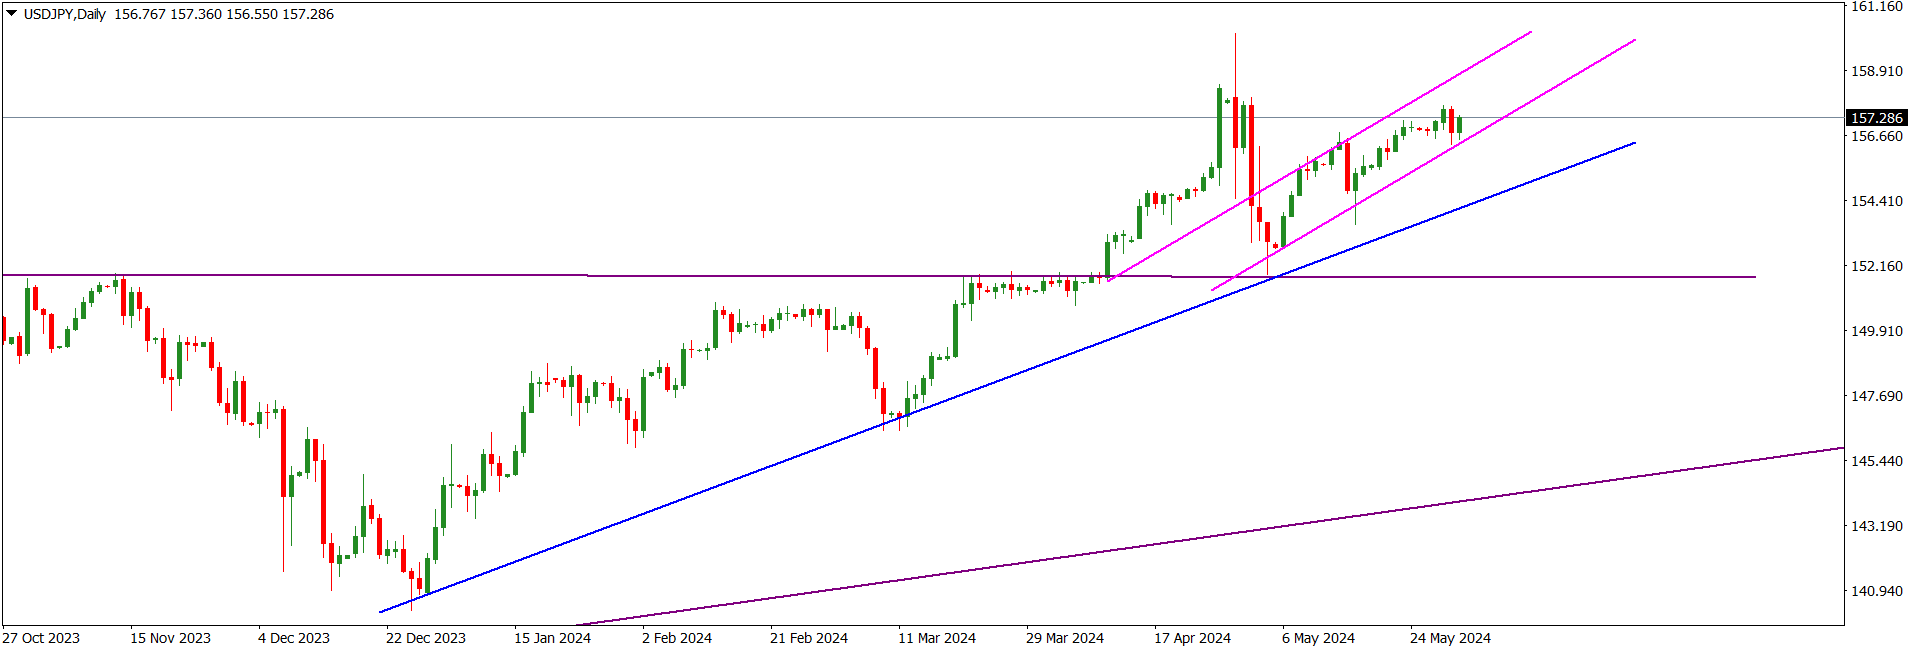
USDJPY price action on the daily time frame went sideways as it tackles the 157.290 horizontal resistance area. Presently, price action is within a rising channel (magenta).
I may be wrong. Trade safe and prosper.
Trap
EURUSD Weekly Technical Outlook
EURUSD market operation assumed a bullish disposition in May to retest the 50 Fib retracement area of the bearish swing that began in May 2021. The dominant technical structure is bearish.
EURUSD market operation on the weekly time frame went sideways last week after a bullish retest of the 50 Fib retracement area of the bearish swing traceable to May 2021. The dominant technical structure is bearish.
Last Friday, EURUSD price action on the daily time frame retest the 1.08840 horizontal resistance area (blue), which is a few pips below the 50 Fib retracement area of the bearish swing that began in May 2021. The 1.08840 area has remained as a horizontal resistance for several days. The bullish drive to the area on Friday met a bearish pushback. Should bulls fail to significantly break out of the area, we may see a southward rotation. Presently, a rising trendline (purple) is acting as a support.
I may be wrong. Trade safe and prosper.
Trap
GBPUSD Weekly Technical Outlook
GBPUSD market operation on the monthly time frame was bullish in May after breaking out of the area of consolidation created in the previous three months. The bullish candlestick of May retested the 61.8 Fib retracement area of the bearish swing that began in May 2021.
GBPUSD market operation on the weekly time frame went sideways last week after a bullish retest of the 61.8 Fib retracement area of the bearish swing that began in May 2021. The technical are presently ambivalent.
GBPUSD price action on the daily time frame is tackling the 61.8 Fib retracement area of the bearish swing that began in May 2021. There was a bullish charge at te area on Monday, but bears pushed for the next two days. A bullish retest of the rea was initiated on Friday but was challenged by bears. The area is in confluence with the 1.27630 horizontal resistance area. Should bears succeed in their challenge for market control, we may see a southward disposition which could target a an area of value such as the 1.2600 horizontal support area (blue).
I may be wrong. Trade safe and prosper.
Trap
XAUUSD Weekly Technical Outlook
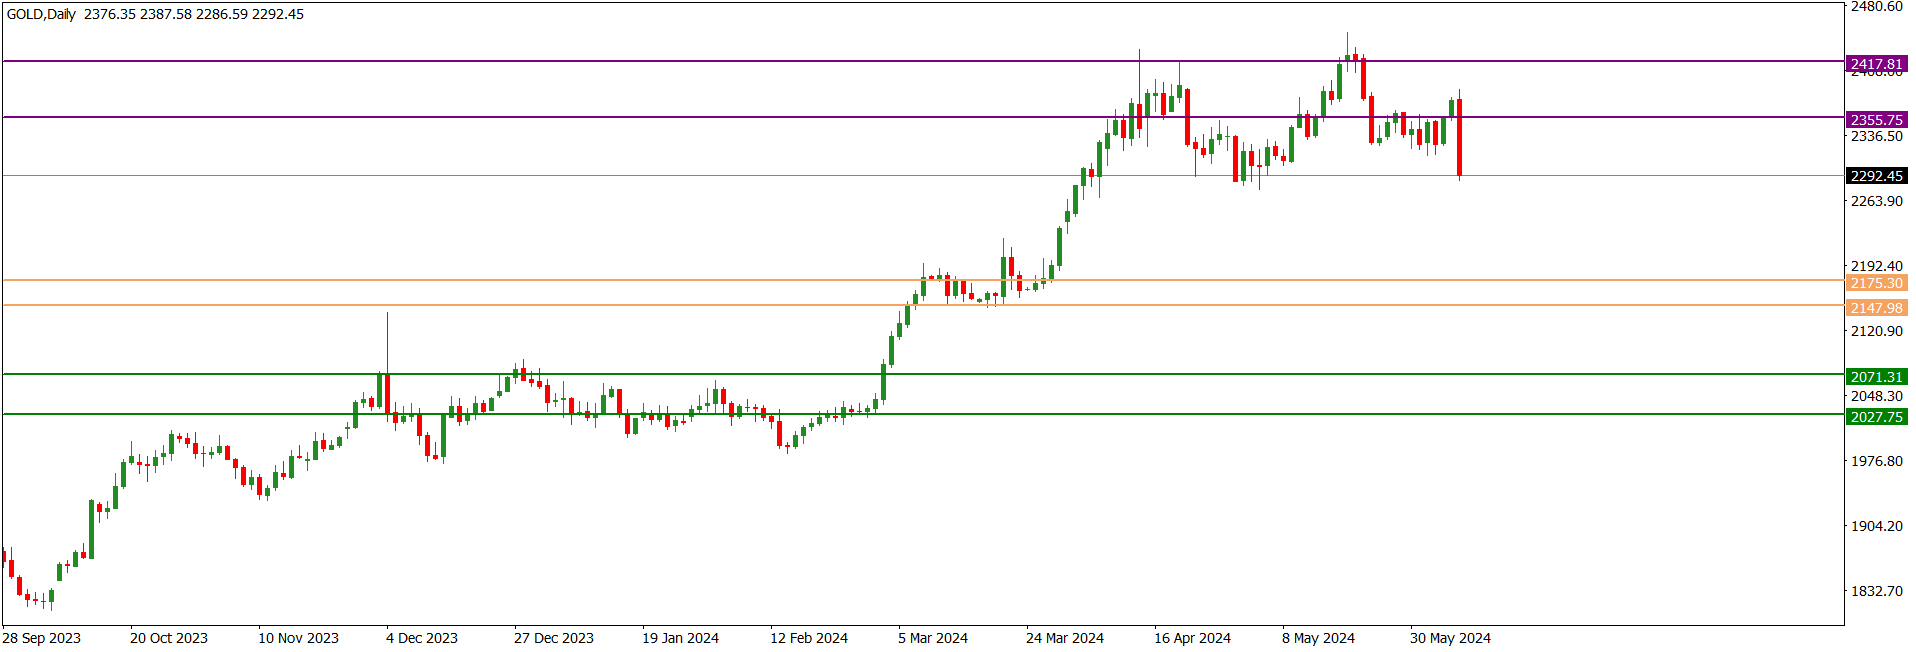
XAUUSD market operation on the weekly time frame maintained a bearish disposition last week. Presently, it is retesting the 2292.45 horizontal support area.
XAUUSD price action on the daily time frame resumed a bearish disposition on Friday after breaking down an area of consolidation created some days ago. Presently, it is retesting the 2292.45 horizontal support area. Should bears break down the 2292.45 horizontal support area, we would see further southward move in the early part of this week.
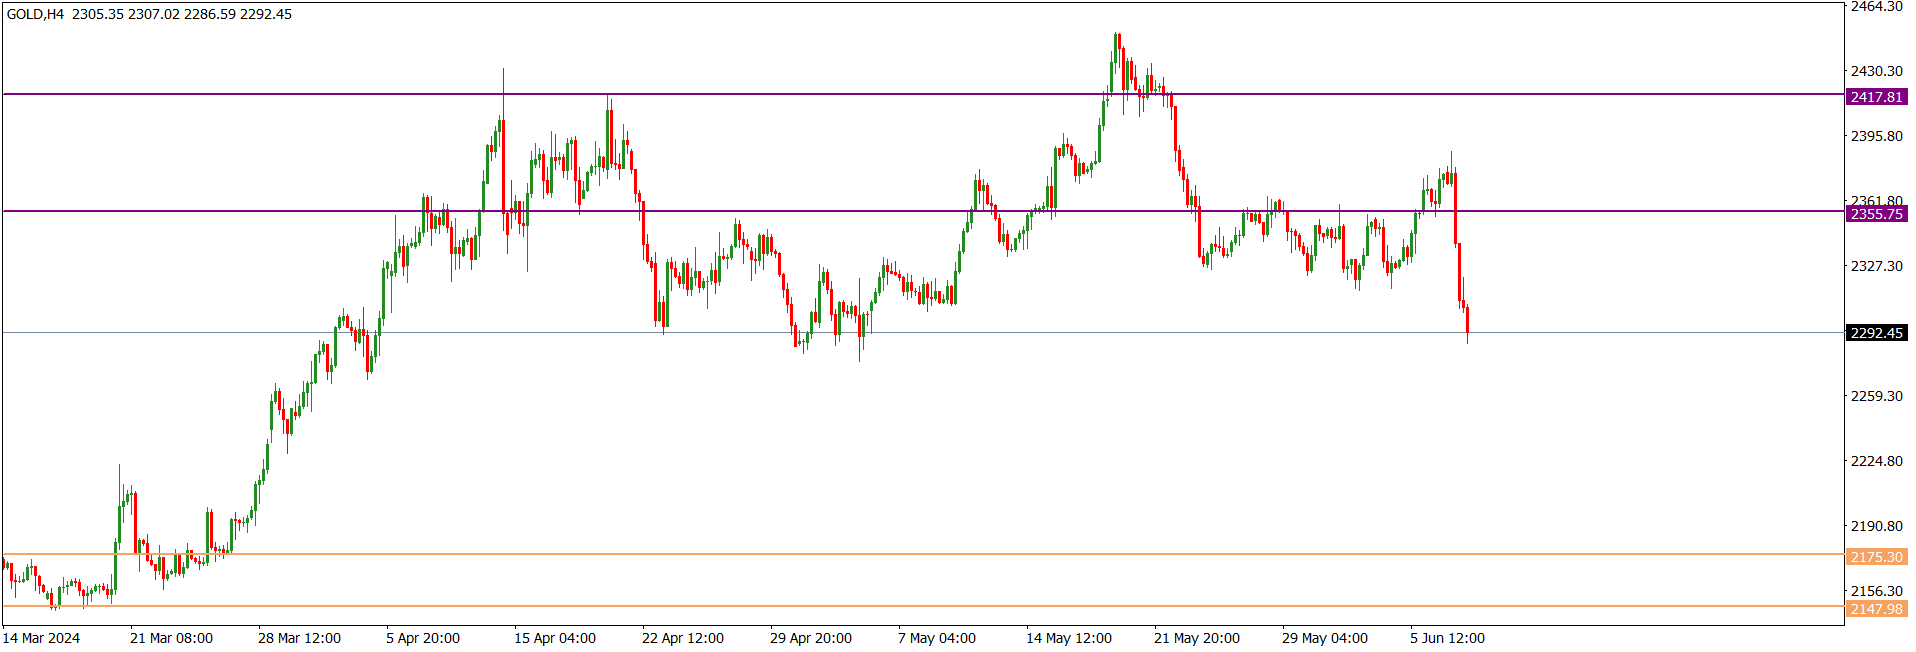
The technical impulse of XAUUSD price action on the H4 time frame is bearish. Presently, it is located at the 2292.45 horizontal support area, but a successful bearish breakdown of the area would see further southward move.
I may be wrong. Trade safe and prosper.
Trap
USDJPY Weekly Technical Outlook
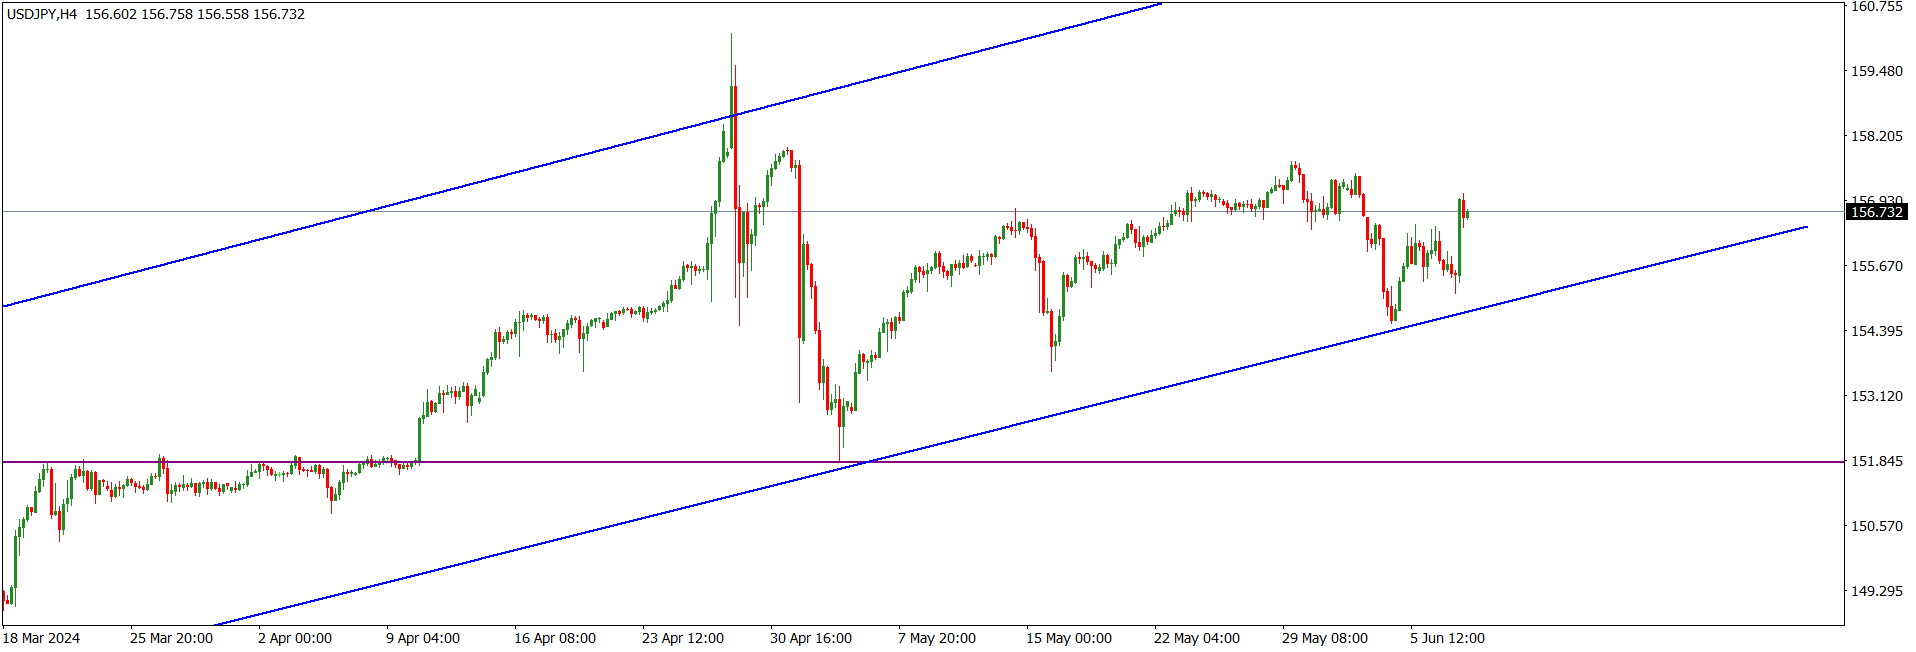
USDJPY market operation has remained sideways at the 156.730 horizontal resistance area for the past four weeks. Technically, the market operation is within a rising channel (blue).
USDJPY price action on the daily time frame is operating in a rising channel (blue) and retesting the 156.730 horizontal resistance area. A successful bullish breakout of price action from the area would see further northward drive.
USDJPY price action on the H4 time went sideways in the latter part of Friday after a bullish drive to the 156.700 horizontal resistance. Recent technical pattern favours a northward liquidity sweep.
I may be wrong. Trade safe and prosper.
Trap
EURUSD Weekly Technical Outlook
EURUSD market operation on the weekly time remains sideways for three weeks at the 50 Fib retracement area of the bearish swing that began in May 2021. There was a bullish charge at the area four weeks ago, but bears resisted the bullish drive. However, there has not been a bearish follow-through since. The area is in confluence with the 1.08840 horizontal resistance (blue)
EURUSD price action on the daily time frame disposed bearish on Friday after breaking down a mini area of consolidation that was in place for the three previous days. Presently, it is tackling the 1.08000 intra-day horizontal support. Recent technical patterns favour further southward move. Successful bearish continuation may eventually target the 38.2 Fib area of the bearish swing that began in May 2021 or the nearby 1.05500 horizontal support area (green).
EURUSD price action on the H4 time frame is bearish. However, there is a decline in bearish momentum as price action tackles the 1.08000 intra-day horizontal support. However, we cannot rule out further southward drive in the early part of this week.
I may be wrong. Trade safe and prosper.
Trap
GBPUSD Weekly Technical Outlook
GBPUSD market operation on the weekly time remains sideways for three weeks at the 61.8 Fib retracement area of the bearish swing that began in May 2021. There was a bullish charge at the area four weeks ago. The area is in confluence with the 1.27500 horizontal resistance.
GBPUSD price action on the daily time frame became bearish on Friday after breaking down a mini area of consolidation that had been in place since Tuesday. Presently, price action is tackling the 1.27150 intra-day horizontal support. Recent technical patterns favour further southward move. Successful bearish continuation may see price action exposing the 1.24800 horizontal support area (Sandybrown).
GBPUSD price action on the H4 time frame disposed bearish earlier on Friday before going sideways as it tackles the 1.27150 intra-day horizontal support. However, we cannot rule out further southward drive in the early part of this week.
I may be wrong. Trade safe and prosper.
Trap
XAUUSD Weekly Technical Outlook
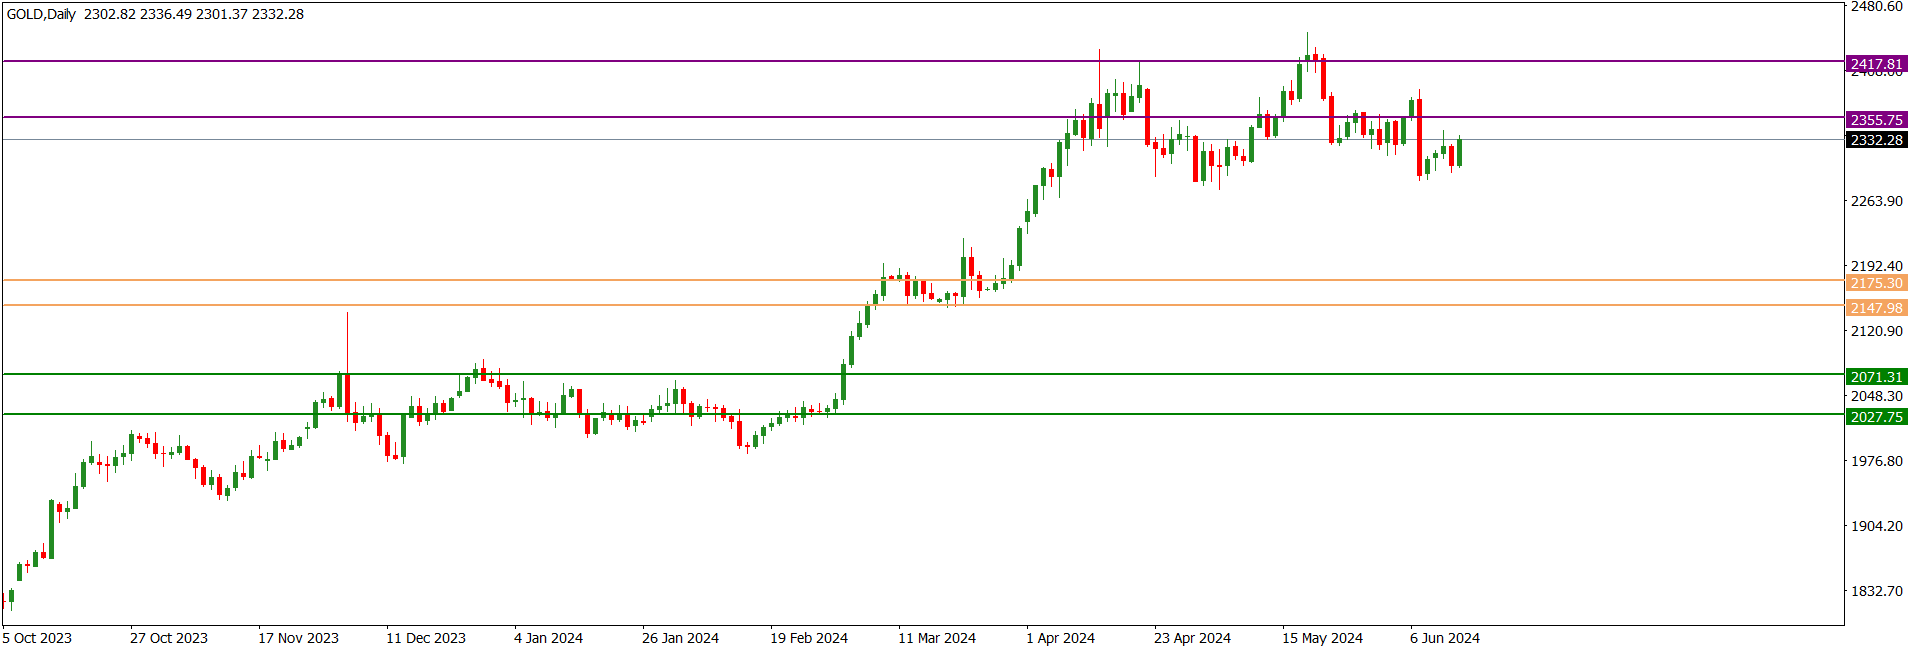
XAUUSD market operation on the weekly time frame went sideways after a bearish rejection of the 2417.81/2355.75 horizontal resistance zone (purple). Last week’s bullish pullback is restricted to the 2332.28 horizontal resistance.
XAUUSD price action on the daily time frame went sideways on Friday as it retested the 2332.28 horizontal resistance. The preceding technical impulse is bearish, but we may still see further northward move to an area of value before a southward drive.
XAUUSD price action on the H4 time frame went sideways in the latter part of Friday after a bullish retest of the 2332.28 horizontal resistance. Although we may still see a northward charge towards an area of value, the technical impulse is bearish.
I may be wrong. Trade safe and prosper.
Trap
USDJPY Weekly Technical Outlook
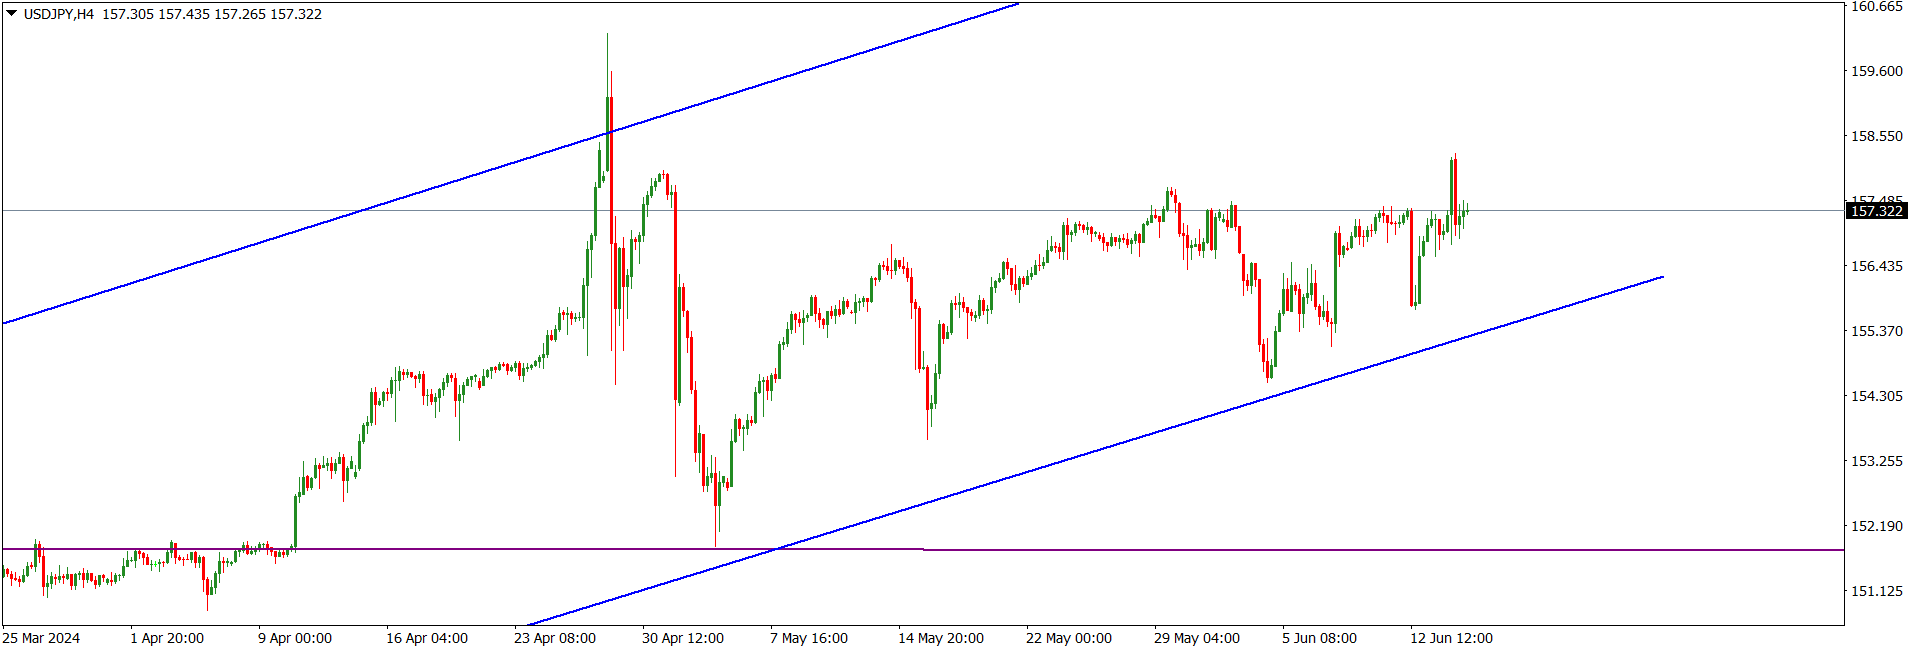
USDJPY market operation on the weekly time frame is presently sideways. Market operation is in a rising channel (blue).
USDJPY price action on the daily time frame went sideways as it tackles the 157.300 horizontal resistance area. Meanwhile, price action is still within a rising channel (blue).
USDJPY price action on the H4 time frame is consolidating within a rising channel (blue). Presently, it is tacking a horizontal resistance at the 157.300 area but we cannot rule out further northward movement in the early part of this week.
I may be wrong. Trade safe and prosper.
Trap
EURUSD Weekly Technical Outlook
EURUSD market operation on the weekly time frame is bearish, but the momentum is weak. Market operation is tackling the 1.07000 horizontal support within the 50/38.2 Fib retracement zone of the bearish swing that began in May 2021.
EURUSD price action on the daily time frame took on a bearish tone on Friday after breaking below the area of consolidation that has been in place since Monday. However, there was no southward follow-through as bulls pushed back. Presently, price action is located at the 1.07000 horizontal support. The technical impulse favours bears more than bulls.
EURUSD price action on the H4 time frame was turned sideways in the latter part of Friday after bulls pushed back a bearish move that began on Thursday. However, the technical impulse favours bears more than bulls.
I may be wrong. Trade safe and prosper.
Trap
GBPUSD Weekly Technical Outlook
GBPUSD market operation on the weekly time frame is sideways. Presently, it is at the 61.8 Fib retracement area of the bearish swing that began in May 2021.
GBPUSD price action on the daily time frame is consolidating within the 1.28000/1.26670 horizontal channel (magenta). The area adjoins the 61.8 Fib retracement of the bearish swing that began in May 2021. Presently, there is a lack of directional technical impulse.
GBPUSD price action on the H4 time frame went sideways in the latter part of Friday after a brief bearish drive during the earlier sessions. Presently, price action is at the lower boundary of the 1.28000/1.26670 horizontal channel (magenta). The dominant technical structure is bearish.
I may be wrong. Trade safe and prosper.
Trap
XAUUSD Weekly Technical Outlook
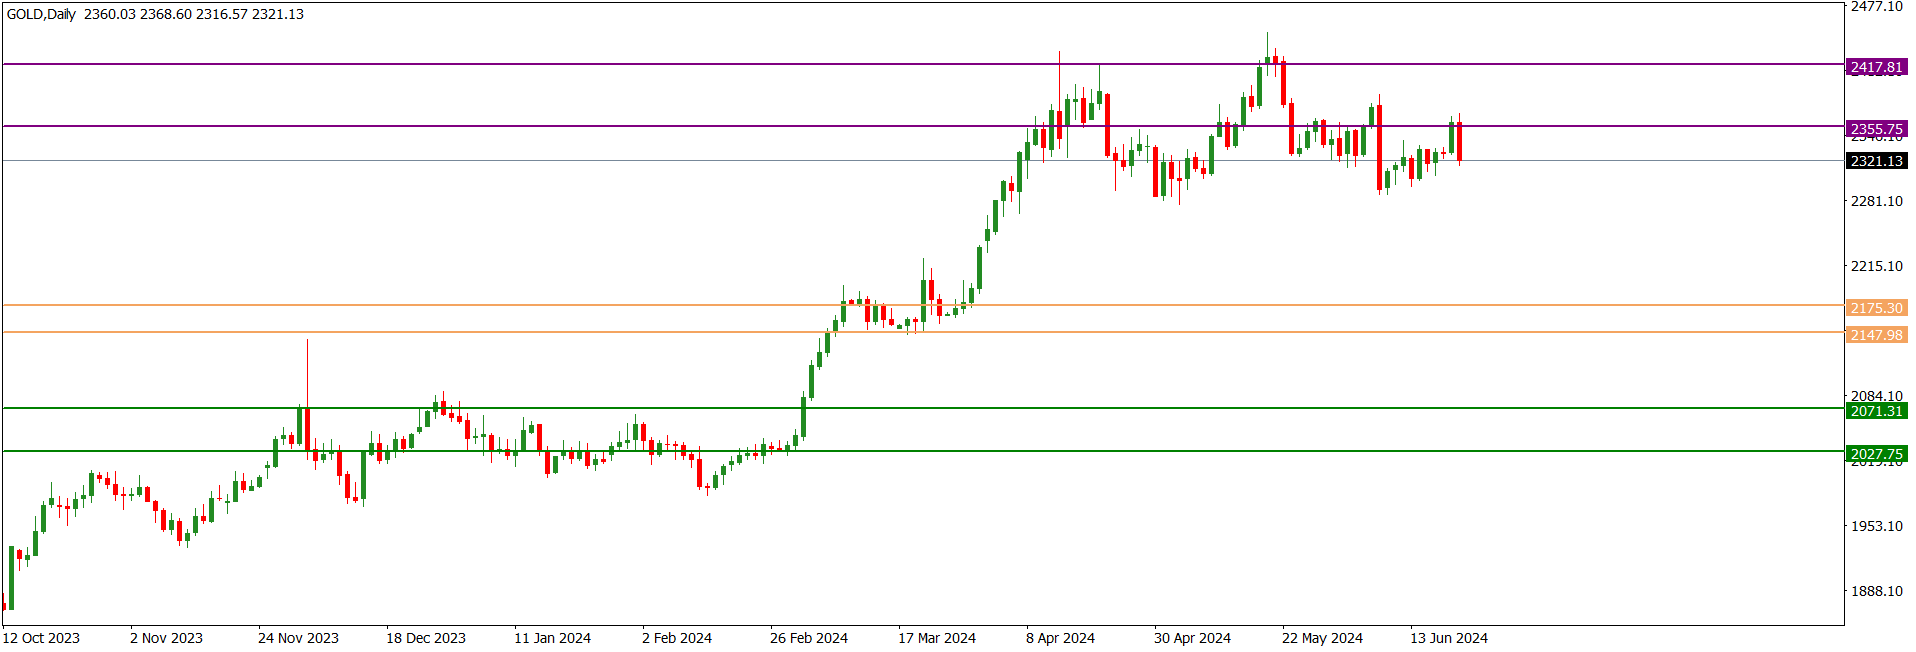
XAUUSD market operation on the weekly time frame printed a bearish pinbar last week. This was a reaction to the bullish print of the previous week. Technically, this portends that we are likely to have a bearish week, particularly with the bearish rejection of the 2417.81/2355.75 horizontal resistance zone (purple).
On Friday, XAUUSD price action made a bearish rejection of the of the 2355.75 horizontal resistance after a bullish retest on Thursday. Presently, price action is tackling the 2321.13 horizontal support. The technical impulse is bearish.
The technical impulse of XAUUSD price action on the H4 time frame is bearish. Presently, price action is tackling the 2321.13 intra-day horizontal support, whose bearish breakdown would incentivize a southward drive.
I may be wrong. Trade safe and prosper.
Trap
USDJPY Weekly Technical Outlook
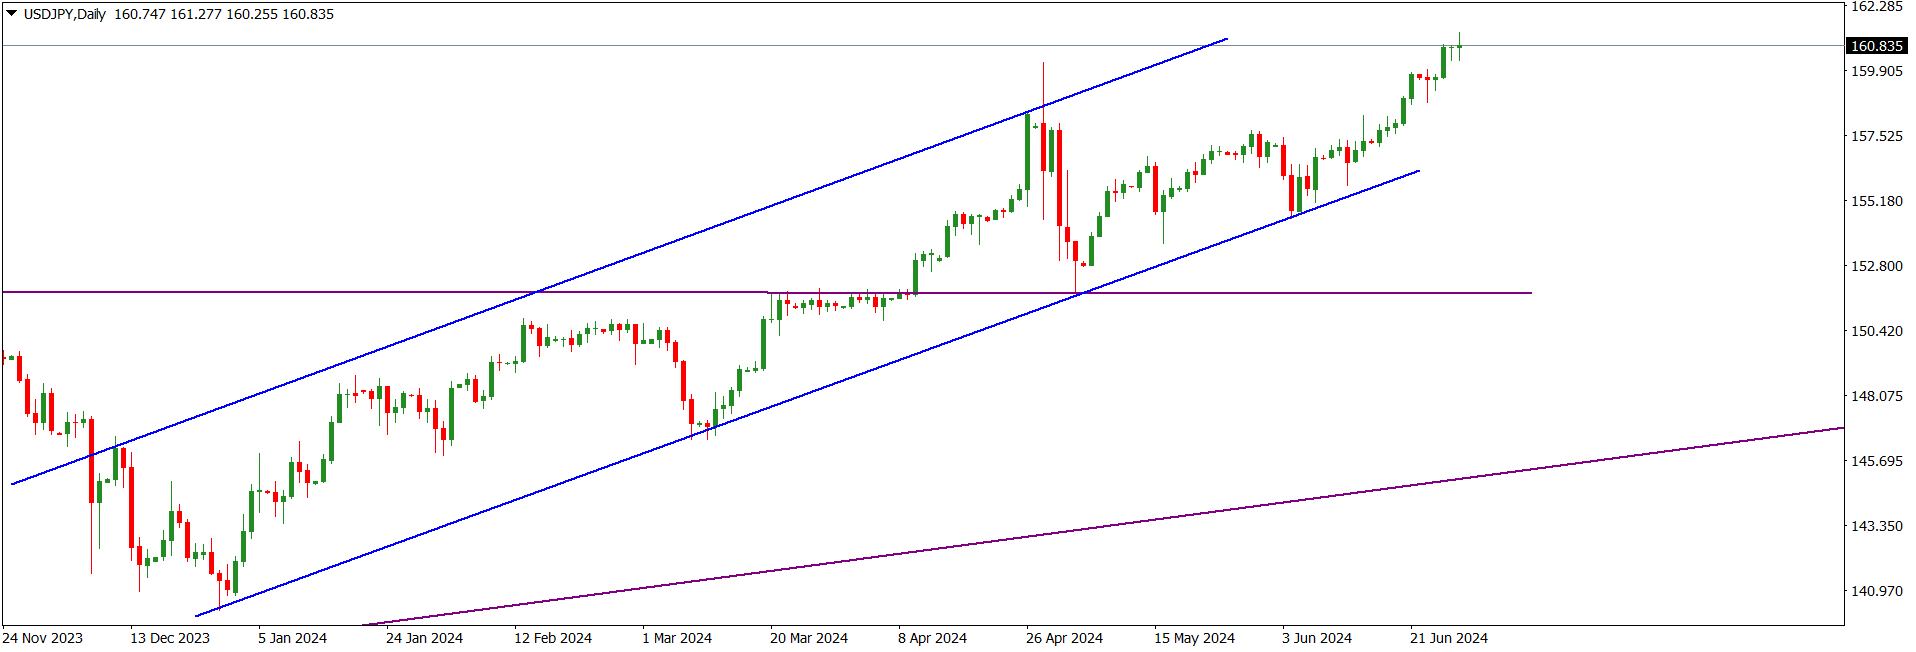
USDJPY market operation on the weekly time frame is bullish. Last week, market operation printed a relatively big bullish candlestick that broke above a 4-week mini-consolidation area. Meanwhile, the market operation is still in a rising channel (blue).
USDJPY price action on the daily time frame is bullish. Presently, price action is tacking the 160.00 all-time high area.
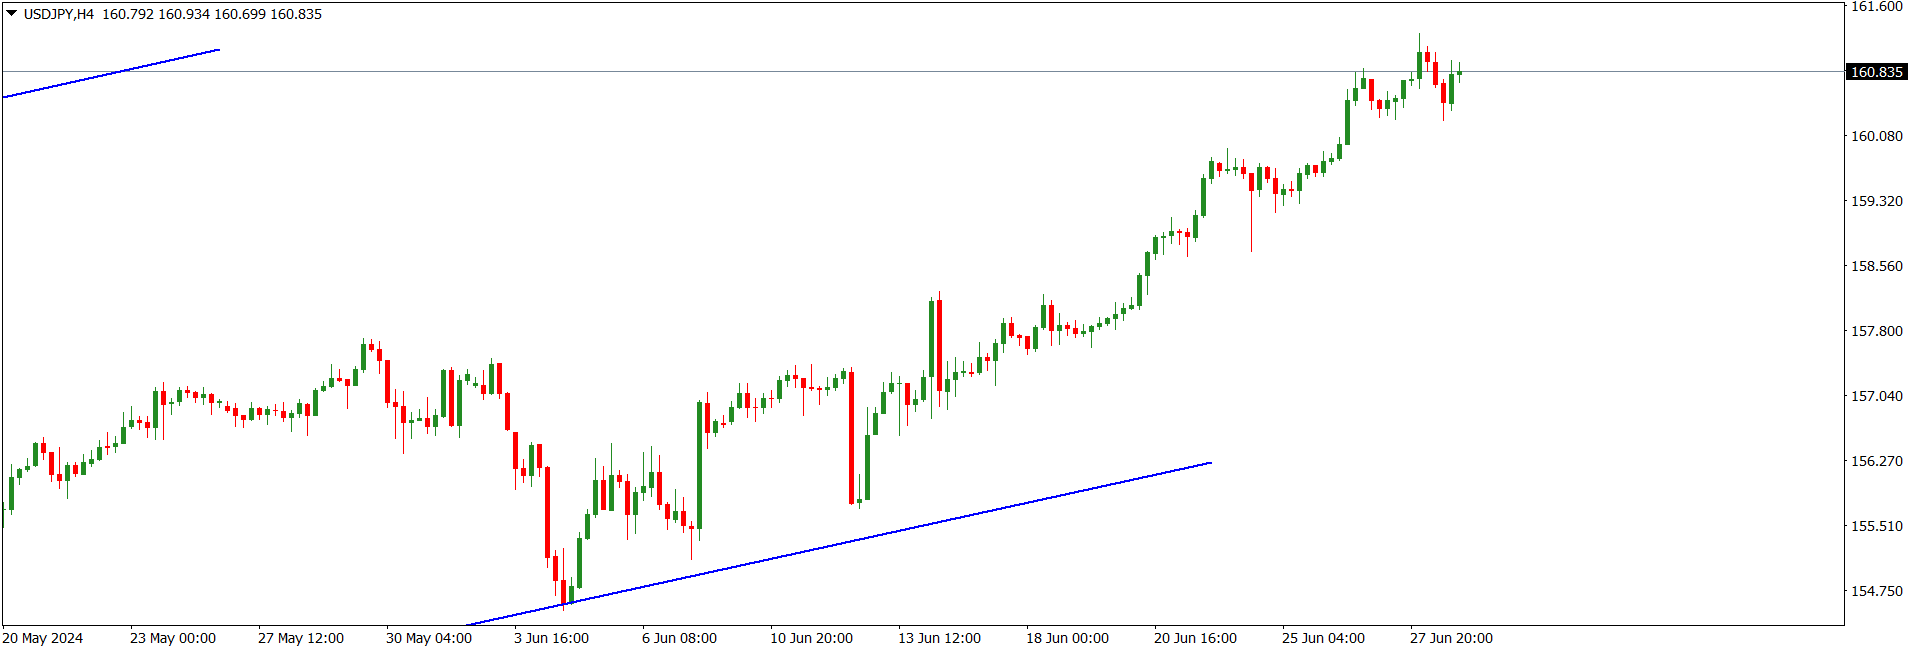
USDJPY price action on the H4 time frame is bullish but the momentum has decreased. We may still see a southward pullback, or sideways, of price action in the early part of this week before a northward drive.
I may be wrong. Trade safe and prosper.
Trap
EURUSD Weekly Technical Outlook
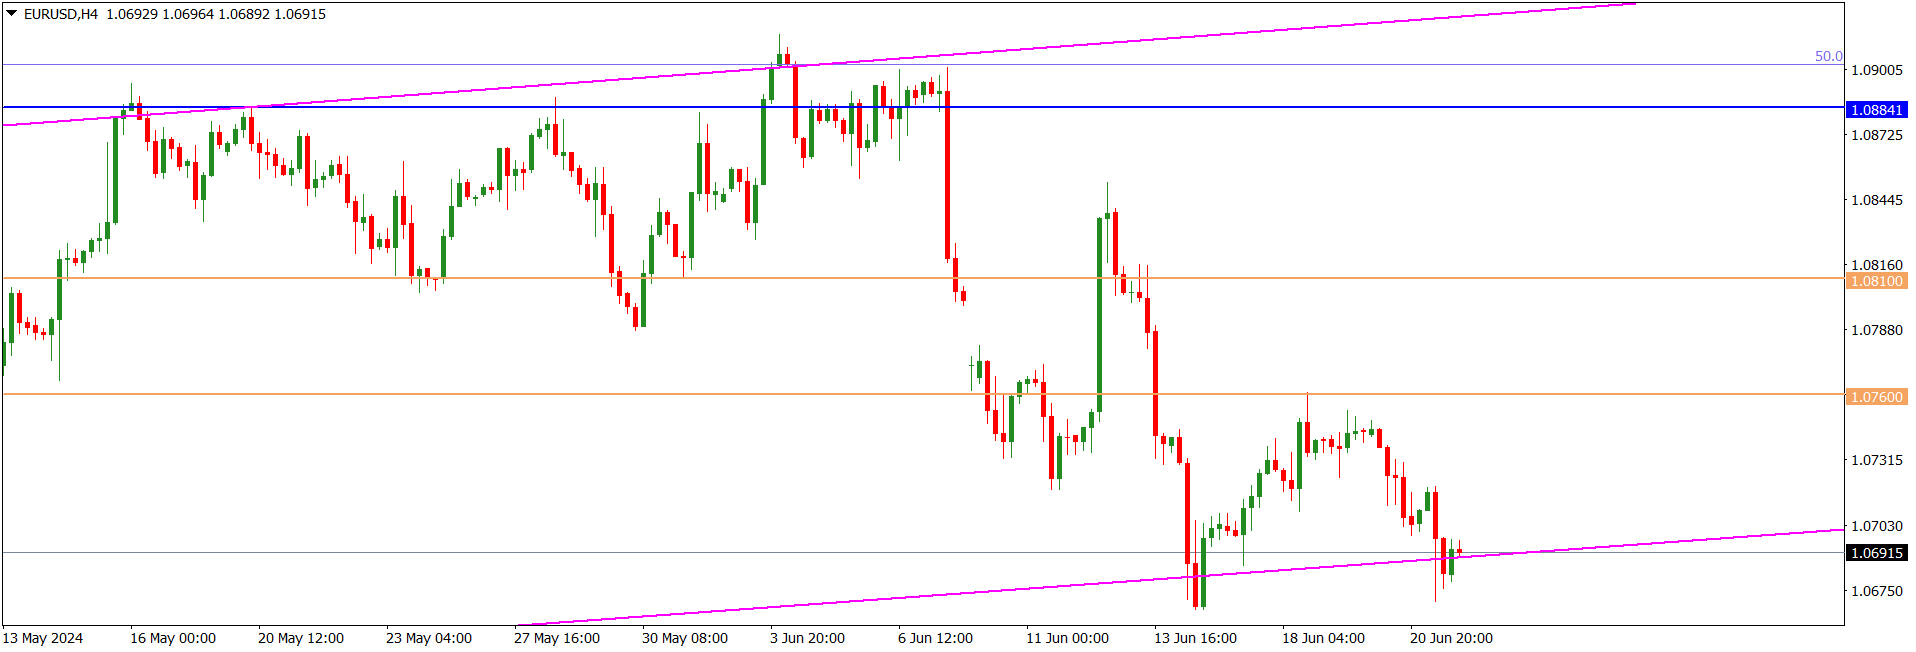
EURUSD market operation on the weekly time frame went sideways last week as it tackled the 1.06910 horizontal support. Nevertheless, the preceding technical impulse was bearish. Presently, market operation is within the 50/38.2 fib retracement zone of the bearish swing traceable to May 2021. The dominant technical structure is bearish.
EURUSD price action on the daily time frame is consolidating in a rising channel (magenta) in the context of a dominant bearish structure. Presently, it is at the lower trendline and tackling the 1.06910 horizontal support. A breakdown of the channel would incentivize a bearish drive, but we may still see a northward pullback to an area of value, such as within the 1.07600/1.08100 market imbalance (Sandy brown), before a southward drive.
The EURUSD price action on the H4 time frame went sideways at the 1.06910 horizontal support on Friday. Although the dominant technical structure is bearish, presently, there is no directional technical impulse. We may still see a northward retest of an area of value, such as the 1.07600/1.08100 area (Sandy brown), before a southward drive.
I may be wrong. Trade safe and prosper.
Trap
GBPUSD Weekly Technical Outlook
GBPUSD market operation on the weekly time frame broke below the 1.28000/1.26670 horizontal channel (magenta) last week. However, there was no bearish momentum, so market operation is still just below the 61.8 Fib area of the bearish swing that began in May 2021.
Last Friday, GBPUSD price action on the daily time frame broke down the 1.28000/1.26670 horizontal channel (magenta) where is it has been consolidating for several days. However, there is no bearish momentum and the bearish candlestick printed on Friday has equal-sized shadows on both ends. We may still see a northward pullback to an area of value in the early part of this week before a southward rotation. The dominant technical structure is bearish.
GBPUSD price action on the H4 time frame is presently sideways at the 1.26400 intra-day horizontal support. Price action has broken below the 1.28000/1.26670 horizontal channel (magenta) where it has been consolidating for several days, but there is no southward momentum. We may see a bullish pullback to an area of value in the early part of this week before a southward turnaround.
I may be wrong. Trade safe and prosper.
Trap
XAUUSD Weekly Technical Outlook
XAUUSD market operation on the weekly time frame remains sideways at the 2326.28 area. There was a bearish rejection of the 2355.75 horizontal resistance five weeks ago but there has not been any significant bearish follow-through.
XAUUSD price action on the daily time frame went sideways after a bullish retest of the 2326.28 horizontal resistance. The technical impulse favoure bears more than bulls.
XAUUSD price action on the H4 time frame made a bullish retest of the 2326.28 horizontal resistance but met with bearish resistance. The technical impulse is bearish.
I may be wrong. Trade safe and prosper.
Trap
USDJPY Weekly Technical Outlook
USDJPY market operation maintained a bullish tone last week. The bullish candlestick printed last week closed at the 160.830 area.
USDJPY price action on the daily time frame turned sideways on Friday after a bullish drive to the 160.830 area on Wednesday.
USDJPY price action on the H4 time frame turned sideways on Friday at the 160.830 intra-day horizontal resistance area. Presently, the bullish momentum is waning.
I may be wrong. Trade safe and prosper.
Trap
EURUSD Weekly Technical Outlook
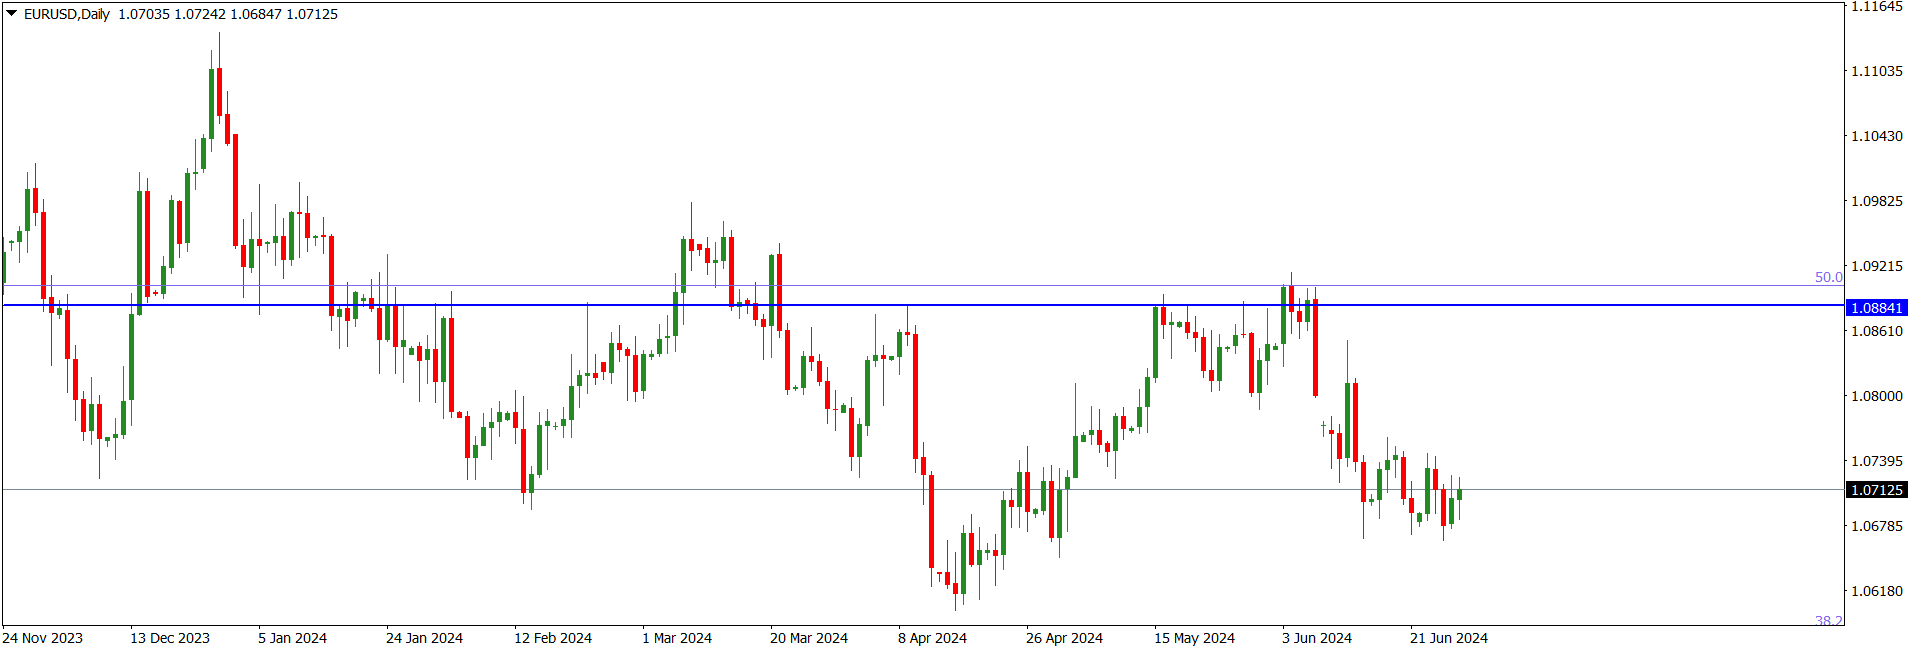
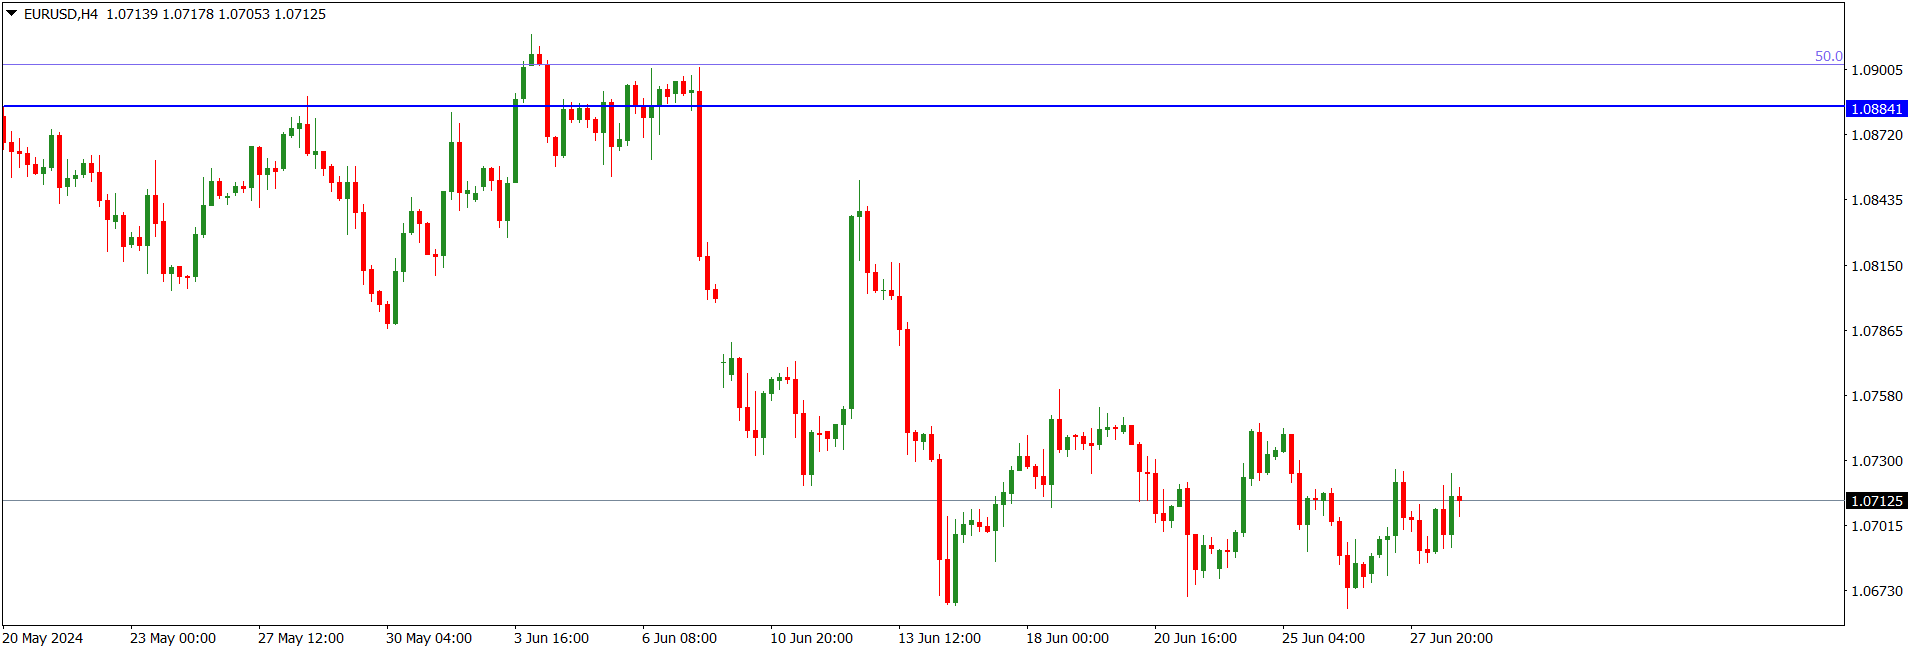
EURUSD market operation on the weekly time frame is sideways at the 1.07120 area. The area is above the 38.2 fib retracement of the bearish swing that began in May 2021.
EURUD price action on the daily time frame is sideways. However, the technical impulse favours bears more than bulls. Price action is at the 1.07120 area which is about 127 pips above the 38.2 fib retracement of the bearish swing that began in May 2021, which may be a technical target of further bearish drive.
EURUSD price action on the H4 timeframe made a bullish pullback of a bearish drive but went sideways for lack of bullish momentum. The technical impulse favours bears.
I may be wrong. Trade safe and prosper.
Trap
GBPUSD Weekly Technical Outlook
GBPUSD market operation on the weekly time frame is sideways. It is at the 1.26670 area, which is about 125 pips below the 61.8 Fib retracement of the bearish swing that began in May 2021. Market operation has been tackling the 1.26670 area in the past two weeks.
GBPUSD price action on the daily time frame has broken down a rising channel (magenta) within which it has been operating since May 2024. On Monday it made a bullish retest of the lower boundary of the channel before a bearish pushback. Presently, price action is sideways below the channel. Technically we may expect a bearish turnround should bulls fail to gain a bullish momentum in the early part of this week.
GBPUSD price action went sideways as it retests the 1.26430 intra-day horizontal resistance. The technical impulse favours bears more than bulls. The dominant technical structure is bearish.
I may be wrong. Trade safe and prosper.
Trap
XAUUSD Weekly Technical Outlook
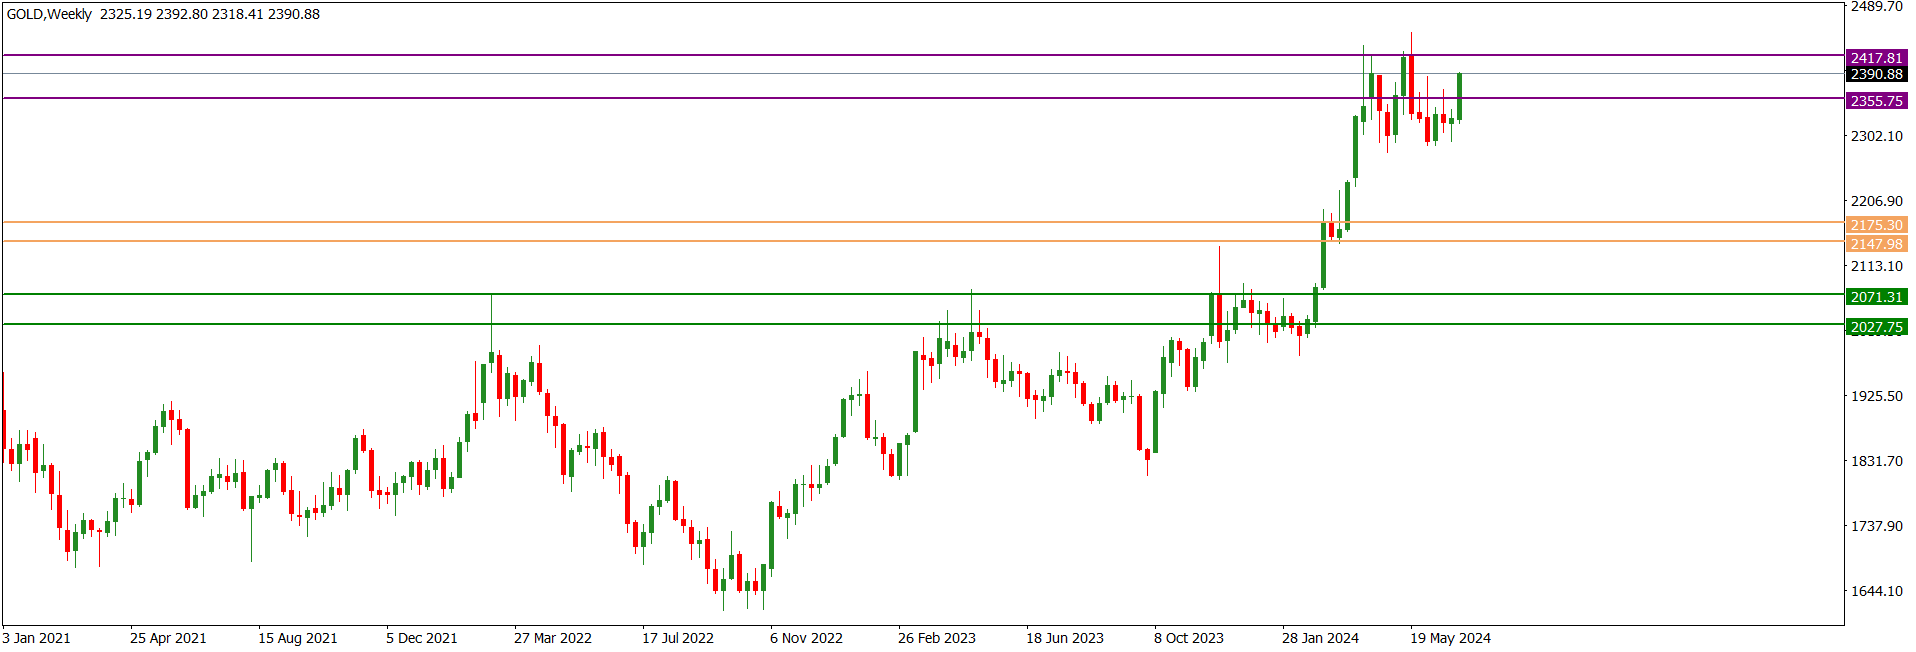
XAUUSD market operation on the monthly time frame went sideways in June. There was a bullish drive into the 2355.75/2417.81 horizontal resistance zone (purple) in June before bears pushed back the bullish charge to below the zone.
Last week, XAUUSD market operation on the weekly time frame broke above a mini area of consolidation that has been in place for two weeks. The bullish candlestick printed last week retested the 2355.75/2417.81 horizontal resistance zone (purple).
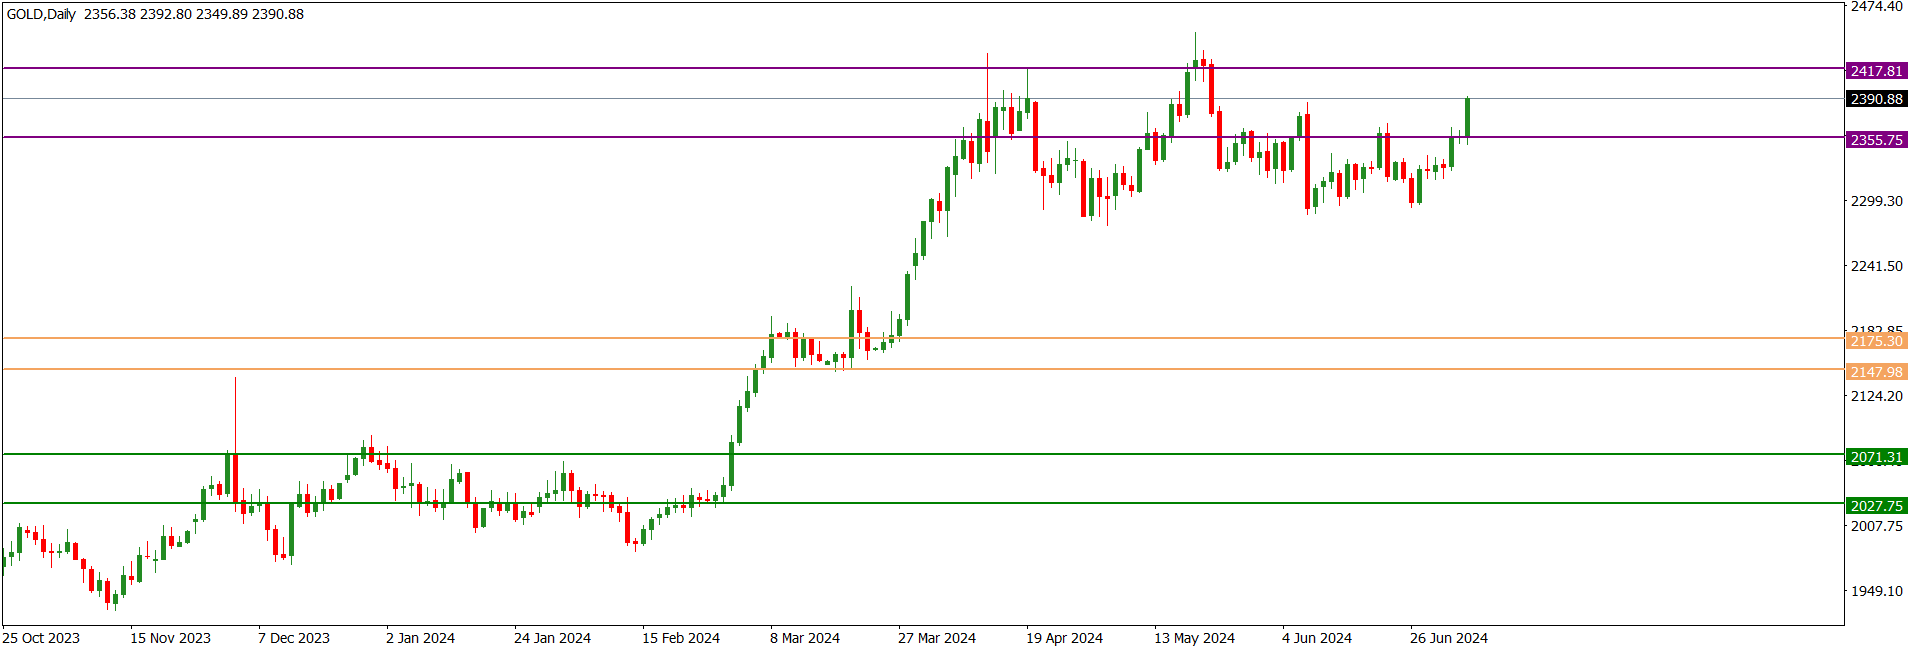
XAUUSD price action on the daily time frame is retesting the 2355.75/2417.81 horizontal resistance zone (purple). Apparently, there is still appetite for further bullish drive
I may be wrong. Trade safe and prosper.
Trap