GBPUSD Weekly Technical Outlook
The GBPUSD market operation on the weekly time frame is sideways as it tackles the 1.25730 horizontal support area. We may still see further southward move. The dominant technical structure is bearish. This is congruent with the lower trendline of the rising wedge (red), within which the market operation has been consolidating for several weeks.
GBPRUSD price action on the daily time frame went sideways after bulls pushed back a bearish breakdown of the rising wedge (red), within which the market operation has been consolidating for several weeks. Presently, price action is retesting the lower wedge trendline. But the dominant technical structure is bearish.
GBPUSD price action on the H4 time frame went sideways at the latter part of Friday close after a bullish retest of the broken down lower trendline of the rising wedge (red), within which it was consolidating. The dominant technical structure is bearish.
I may be wrong. Trade safe and prosper.
Trap
XAUUSD Weekly Technical Outlook
The XAUUSD market operation on the monthly time frame printed an indecision candlestick in the 2646.80/2597.88 horizontal support zone (blue) in December 2024. The zone was flipped as support in October 2024 but the market operation in November issued a bearish retest of the zone.
The XAUUSD market operation on the weekly time frame is consolidating in the 2646.80/2597.88 horizontal support zone (blue). Last week, a small bullish candlestick was printed in the zone.
XAUUSD price action on the daily time frame went sideways at the 2646.80 intra-day horizontal resistance on Friday. However, the immediate technical impulse favours bulls, and we may see a northward market operation to retest an intra-day area of value before a southward drive.
I may be wrong. Trade safe and prosper.
Trap
USDJPY Weekly Technical Outlook
The USDJPY market operation on the monthly time frame printed a bullish candlestick in December 2024. The market operation is presently in the 157.300 horizontal resistance area.
The USDJPY market operation on the weekly time frame is presently sideways at the 157.300 horizontal resistance area. There was a bullish drive to the area three weeks ago but there was no significant bullish follow-up two weeks ago. Last week, the market operation printed an indecision candlestick in the area. Technically, the USDJPY market operation is consolidating within a rising channel (purple), and presently at the upper part of the channel.
USDJPY price action on the daily time frame is presently sideways at the 157.300 horizontal resistance area. However, the technical impulse favours bulls more than bears. We may see a northward liquidity to an intra-day are of value in the early part of this week before a southward correction.
I may be wrong. Trade safe and prosper.
Trap
EURUSD Weekly Technical Outlook
The EURUSD market operation on the monthly time frame maintained a bearish disposition in December 2024 to retest the 1.04050/1.03240 horizontal support zone (green). This zone is just above the 23.6 fib retracement of the bearish swing traceable to May 2021.
The EURUSD market operation on the weekly time frame produced a bearish continuation candlestick last week to close below the 1.04050/1.03240 horizontal support zone (green). The dominant technical structure is bearish.
EURUSD price action on the daily time frame went sideways towards the end of last week after a bearish breakdown of the 1.04050/1.03240 horizontal support zone (green). Although the dominant technical structure is bearish, we may still see some bullish corrective price action or northward market engineering before further bearish drive.
I may be wrong. Trade safe and prosper.
Trap
GBPUSD Weekly Technical Outlook
The GBPUSD market operation on the monthly time frame printed a bearish continuation candlestick in December 2024 to break down the rising wedge within which it has been consolidating for several months. The dominant technical structure is bearish.
The GBPUSD market operation on the weekly time frame broke down the rising wedge within which it had been consolidating and after two weeks of sideways around the lower wedge trendline. Presently, the market operation is at the 1.23300 horizontal support area, which is proximal to the 50-fib retracement of the bearish swing traceable to May 2021. The dominant technical structure is bearish.
After a period of consolidation in the early part of last week, GBPUSD price action on the daily time printed a bearish candlestick on Thursday to break below the intra-day area of consolidation. However, bulls briefly pushed back on Friday, ending the week in a sideway mode. Although the dominant technical structure is bearish, we cannot rule out northward market engineering before further bearish drive.
I may be wrong. Trade safe and prosper.
Trap
XAUUSD Weekly Technical Outlook
The XAUUSD market operation on the weekly time frame is consolidating within a narrow triangle (magenta). Last week the market operation printed a bullish candlestick that re-tested the upper trendline. Presently, the market operation is at the 2687.85 horizontal resistance area.
XAUUSD price action on the daily time frame is in a bullish mode. Presently, price action is at the 2687.85 horizontal resistance, where there was a bearish challenge to bullish break of the area on Friday. Nevertheless, we may still see further northward market engineering to re-test an intra-day area of value.
Although XAUUSD price action on the H4 time frame is presently sideways, recent technical prints favour northward market engineering to re-test an intra-day area of value.
I may be wrong. Trade safe and prosper.
Trap
USDJPY Weekly Technical Outlook
The USDJPY market operation on the weekly time frame has been sideways at the 157.630 horizontal resistance area since the past four weeks. The market operation made a bullish drive to the area four weeks ago but met with a relatively strong bearish challenge. Apparently, a southward correction is in the offing.
USDJPY price action on the daily tie frame is presently sideways. It has been tackling the 157.630 horizontal resistance area for several days. Although the preceding technical impulse is bullish but we may see a southward correction before further bullish drive.
USDJPY price action on the H4 time frame is consolidating in a rising channel (magenta), Recent technical prints favour bears more than bulls.
I may be wrong. Trade safe and prosper.
Trap
EURUSD Weekly Technical Outlook
The EURUSD market operation on the weekly time frame is still bearish. Last week, bulls attempted a pushback of the bearish drive that happened two weeks ago. But bears wrestled the control of the market to restore the southward disposition. This led to the printing of a bearish pinbar near the 23.6 fib-retracement area of the bearish swing traceable to May 2021.
EURUSD price action on the daily time frame is in a bearish mode after a breakdown of the 1.04050/1.03240 horizontal support zone (green). Presently, price action is tackling the 23.6 fib-retracement area of the bearish swing traceable to May 2021. We cannot rule out a northward retest of an intra-day area of value before further southward drive.
EURUSD price action on the H4 time frame is sideways. After a bearish breakdown of the 1.04050/1.03240 horizontal support zone (green), price action declined in directional momentum. But on Friday, bears pushed for further southward move, which waned at the 1.02400 intra-day horizontal support. We cannot rule out a northward retest of an intra-day area of value before further southward drive.
I may be wrong. Trade safe and prosper.
Trap
GBPUSD Weekly Technical Outlook
The GBPUSD market operation on the weekly time frame is bearish. Two weeks ago, the market operation broke down the rising wedge (red) within which market operation had been consolidating for several weeks. Last week, the market operation printed a relatively big bearish continuation-candlestick.
GBPUSD price action on the daily time frame is bearish. Several days ago, the price action broke down the rising wedge (red) within which price action had been consolidating. There was a bullish retest of the channel on Monday. But there was a bearish rejection on Tuesday. And since then, there has been the printing of bearish continuation candlesticks. Presently, price action is at the 1.21980 horizontal support, which is about 100 pips below the 50-fib retracement of the bearish swing traceable to May 2021.
Although GBPUSD price action on the H4 time frame is bearish, there is a decline in southward momentum. We cannot rule out northward market engineering before a southward rotation.
I may be wrong. Trade safe and prosper.
Trap
XAUUSD Weekly Technical Outlook
The XAUUSD market operation on the weekly time frame is in a bullish mode. However, the bullish momentum is waning as the market operation tackles the 2702.40 horizontal resistance area. Last week, the market operation printed a doji-like candlestick in the area.
XAUUSD price action on the daily time frame turned sideways on Friday as it tackles the 2714.90 horizontal resistance. Nevertheless, the technical impulse favours bulls more than bears. Technically, we may still see further northward momentum before a southward pullback.
XAUUSD price action on the H4 time frame retested the 2702.39 intra-day horizonal support on Friday. Although we may still see a brief southward move in the early part of this week, the technical impulse favours further northward market engineering.
I may be wrong. Trade safe and prosper.
Trap
USDJPY Weekly Technical Outlook
Last week, the USDJPY market operation on the weekly time frame printed a bearish candlestick with a relatively moderate tail. This supports a bullish challenge, but we may still have southward market engineering this week before a northward turnaround.
USDJPY price action on the daily time frame turned sideways at the 156.250 intra-day horizontal resistance towards the end of last week. As the preceding technical impulse is bearish, we may still see a southward retest of an intra-day area of value before a northward momentum.
USDJPY price action on the H4 time frame made a bullish retest of the 156.250 intra-day horizontal resistance on Friday. However, the technical impulse favours bears more than bulls, and we may still see further southward momentum in the early part of this week.
I may be wrong. Trade safe and prosper.
Trap
EURUSD Weekly Technical Outlook
The EURUSD market operation on the weekly time frame which had been bearish is now sideways as it tackles the 23.6 fib retracement of the bearish swing traceable to May 2021. The area is in congruence with the 1.02300 horizontal support. Last week, market operation printed an indecision candlestick in the area.
EURUSD price action on the daily time frame turned sideways after a bearish rejection of the 1.03240 horizontal resistance. It is located a few pips above the 23.6 fib retracement of the bearish swing traceable to May 2021. Technically, bears are more favoured than bulls. The dominant technical structure is bearish.
EURUSD price action on the H4 time frame is tackling the 1.02675 intra-day horizontal support but there is decline in bearish momentum. However, the dominant technical structure is bearish.
I may be wrong. Trade safe and prosper.
Trap
GBPUSD Weekly Technical Outlook
The GBPUSD market operation on the weekly time frame is bearish. However, the bearish momentum is declining. Presently, the market operation is tackling the 1.21630 horizontal support, and an indecision candlestick was printed in the area last week.
Although the bearish momentum of the GBPUSD price action on the daily time frame is declining, the technical impulse favours bears more than bulls. Besides, the dominant technical structure is bearish.
GBPUSD price action on the H4 time frame is tackling the 1.21630 intra-day horizontal support. Although there is a decline in bearish momentum, the dominant technical structure is bearish.
I may be wrong. Trade safe and prosper.
Trap
XAUUSD Weekly Technical Outlook
The XAUUSD market operation on the weekly time frame is bullish. Last week, it printed a relatively big bullish candlestick to retest the 2770.60 horizontal resistance area.
XAUUSD price action on the daily time frame has made a bullish retest of the 2770.60 horizontal resistance area. However, there is a bearish challenge in the area as the bullish momentum declines. What price action does in the area upon the closing of business on Monday should be watched.
XAUUSD price action on the H4 time frame is sideways at the 2770.60 area. Apparently, bears are challenging further northward drive from the area. We cannot rule out further bearish challenges in the early part of this week.
I may be wrong. Trade safe and prosper.
Trap
USDJPY Weekly Technical Outlook
Two weeks ago, the USDJPY market operation on the weekly time frame made a bearish retest of the 155.400 horizontal support area (blue). But last week, the market operation went sideways in the area. This indicates that bulls were challenging a bearish breakdown of the area.
USDJPY price action on the daily time frame is tackling the 155.400 horizontal support area (blue). Presently, it is sideways in the area. As the preceding technical impulse is bearish, we may still see further southward market engineering.
USDJPY price action on the H4 time frame is in consolidation. It is tackling the 155.400 horizontal support area. As the preceding technical impulse is bearish, we may see a retest of an intra-day area of value before a northward turnaround.
I may be wrong. Trade safe and prosper.
Trap
EURUSD Weekly Technical Outlook
The EURUSD market operation on the weekly time is in a bullish corrective mode. Last week, market operation printed a relatively big bullish candlestick to retest the 1.04998 area which was flipped as resistance six weeks ago. The area is about 800 pips below the 38.2 fib retracement of the bearish swing traceable to May 2021. The dominant technical structure is bearish.
EURUSD price action is in a bullish mode. Last week Frida, price action printed a relatively big bullish candlestick that broke above the 1.04050 intra-day horizontal resistance. Further northward push may see a retest of the 1.05830 horizontal resistance, an area which aligns with the 38.2 fib retracement of the bearish swing traceable to May 2021. Although the dominant structure is bearish, the technical impulse is still bullish. Therefore, we may still see northward market engineering in the early part of this week before a southward rotation.
Although EURUSD price action on the H4 time is presently sideways at the 1.04898 intra-day horizontal resistance, the technical impulse favours further northward move. But this may be short lived as the dominant technical structure is bearish.
I may be wrong. Trade safe and prosper.
Trap
GBPUSD Weekly Technical Outlook
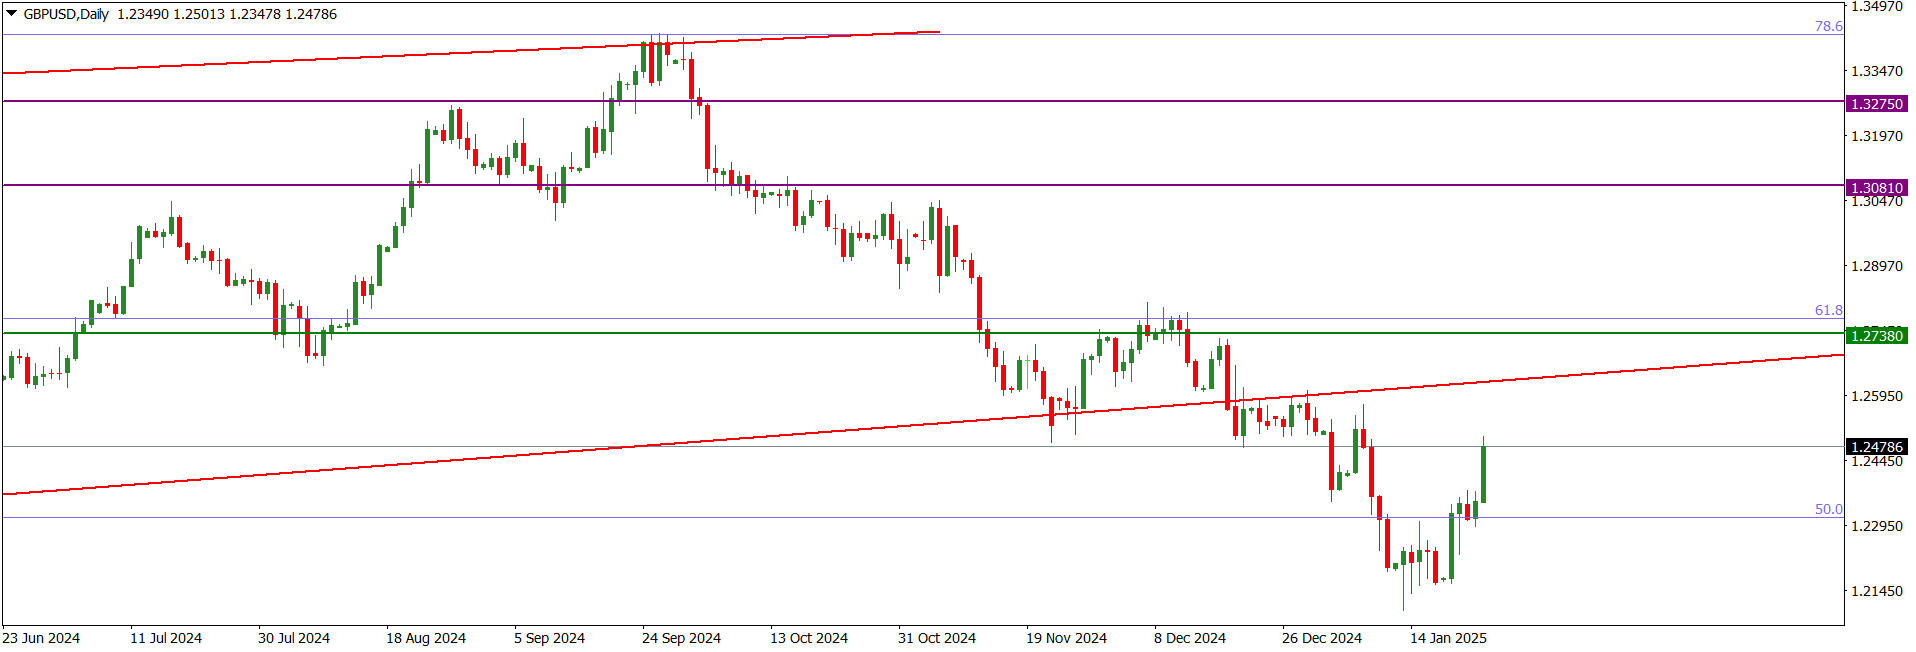
Last week, the GBPUSD market operation on the weekly time frame made a bullish retest of the 1.24790 horizontal resistance area. The area is between the 50/61.8 fib retracement zone of the bearish swing traceable to May 2021. The dominant technical structure is bearish.
GBPUSD price action on the daily time frame is in a bullish corrective mode. On Friday, price action broke above a mini-area of consolidation to retest the 1.24790 horizontal resistance area. Although we may still see further northward market engineering, the dominant technical structure is bearish.
GBPUSD price action on the H4 time frame is making a bullish correction and presently sideways at the 1.24790 horizontal resistance. Nevertheless, we may still see further northward market engineering before a southward turnaround. The dominant technical structure is bearish
I may be wrong. Trade safe and prosper.
Trap
XAUUSD Weekly Technical Outlook
The XAUUSD market operation on the monthly time frame issued a relatively big bullish candlestick in January. Technically, the XAUUSD market is bullish.
The XAUUSD market operation on the weekly time frame is bullish. Last week, it printed a relatively moderate bullish continuation candlestick.
XAUUSD price action on the daily time frame is bullish but the momentum is weakening. On Friday, price action printed an indecision candlestick at the 2796.53 intra-day horizontal resistance. Technically, we may see a bearish challenge in the area. This may lead to a southward correction before further northward momentum.
I may be wrong. Trade safe and prosper.
Trap
USDJPY Weekly Technical Outlook
The USDJPY market operation on the monthly time frame issued a bearish rejection of the 159.880/156.950 horizontal resistance zone (blue) in January. The relatively small bearish candlestick left a top ‘wick’ in the zone and closed at the upper part of the bullish candlestick printed in December 2024. Besides, it also has a tail of similar size to the top wick, which indicates that bulls are still influential in the market. The preceding technical operation in December 2024, with a relatively big bullish candlestick, indicates that the USDJPY market is technically bullish.
The USDJPY market operation on the weekly time frame has been sideways since a relatively weak bearish rejection of the 159.880/156.950 horizontal resistance zone (blue) three weeks ago. The recent technical prints indicate that bulls are more influential in the market than bears.
USDJPY price action on the daily time frame is sideways as bulls retested the 155.170 intra-day horizontal resistance on Friday. The preceding technical impulse is bullish. And recent technical patterns favour a northward liquidity sweep.
I may be wrong. Trade safe and prosper.
Trap
EURUSD Weekly Technical Outlook
The EURUSD market operation on the monthly time frame went sideways in January. It printed an indecision candlestick in the 38.2/23.6 fib retracement zone of the bearish swing traceable to May 2021. The zone contains a horizontal support zone that has been in place since December 2022.
The EURUSD market operation on the weekly time frame went sideways at the 1.04050/1.03240 horizontal support zone (green) after a bearish retest last week. Two weeks ago, there was a bullish flip of the zone from resistance to support. But last week’s bearish print could not break down the zone. Technically, bulls are still more influential in the market than bears, although the dominant technical structure is bearish.
EURUSD price action on the daily time frame is bearish but it is tackling the 1.04050/1.03240 horizontal support zone (green), which was flipped from resistance to support a few days ago. The prominent wicks on the top of the bearish candlesticks printed on Thursday and Friday may incentivize northward engineering in the early part of this week. The dominant technical structure is bearish.
I may be wrong. Trade safe and prosper.
Trap