GBPUSD Weekly Technical Outllook
In January, the GBPUSD market operation on the monthly time frame broke down the rising wedge (red) within which it has been consolidating for several months. The technical structure is bearish. But the candlestick printed in January has a relatively long tail, which indicates that bulls are still influential in the market. Besides, the market operation is presently located at the 50-fib retracement of the bearish swing traceable to May 2021 and we may still see a contention for market influence between bulls and bears in the area.
The GBPUSD market operation on the weekly time frame printed a relatively small bearish candlestick last week. This represents a weak bearish challenge to the relatively strong bullish move of the previous week. That bullish momentum printed a relatively big bullish candlestick. Technically, bulls are presently more influential than bears.
GBPUSD price action on the daily time frame is sideways at an intra-day horizontal support. The preceding technical impulse is bullish. Thus, we may see northward price engineering in the early part of this week. Nevertheless, the dominant technical structure is bearish.
I may be wrong. Trade safe and prosper.
Trap
XAUUSD Weekly Technical Outlook
The XAUUSD market operation on the weekly time frame is bullish. But it is approaching the upper trendline of a rising channel (magenta).
After printing a multi-year high on Friday, the XAUUSD price action on the daily time frame printed a bearish pinbar at the 2860.80 horizontal resistance area. Technically, a bearish correction is imminent.
XAUUSD price action on the H4 time frame is sideways at the 2860.80 intra-day horizontal support. Recent technical prints indicate a potential southward market engineering.
I may be wrong. Trade safe and prosper.
Trap
USDJPY Weekly Technical Outlook
Since a bearish rejection of the 156.950 horizontal resistance area four weeks ago, the USDJPY market operation on the weekly time frame has maintained a bearish mode. Last week, the market operation printed a relatively big bearish candlestick that retested the 152.520/150.810 horizontal support zone (magenta).
USDJPY price action on the daily time frame is bearish, but presently it is tackling the 152.520/150.810 horizontal support zone (magenta). On Friday, price action printed an indecision candlestick in the zone, but we may still see further southward market engineering in the early part of this week.
USDJPY price action on the H4 time frame is presently sideways at the 152.520/150.810 horizontal support zone (magenta). However, the preceding technical impulse favours bears more than bulls. And we may still see further southward market engineering in the early part of this week.
I may be wrong. Trade safe and prosper.
Trap
EURUSD Weekly Technical Outlook
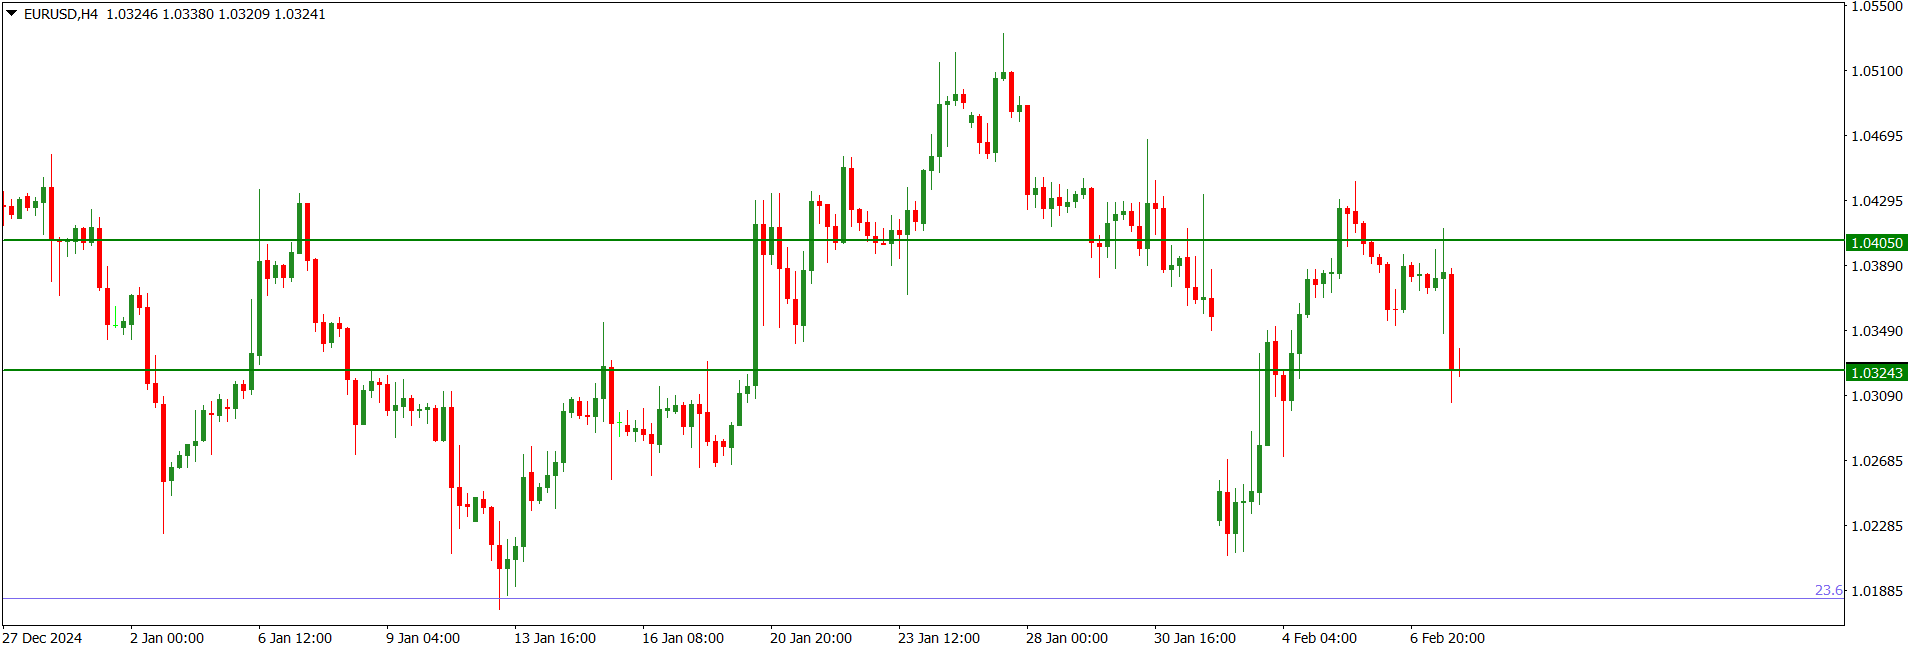
The EURUSD market operation on the weekly time frame is sideways. Last week, the market operation printed a relatively big bullish candlestick but with a prominent top wick as opposed to the relatively big bearish candlestick of two weeks ago. Presently, the market operation is located within the 1.03240/1.04050 zone; a zone which has just been flipped as resistance since December 2022.
EURUSD price action is consolidating within the 1.03240/1.04050 horizontal resistance zone. There was a bullish retest of the zone on Tuesday and Wednesday, but bears challenged the move on Thursday and Friday. Presently, there is no directional clarity, but the dominant technical structure is bearish.
EURUSD price action on the H4 time frame is in consolidation. Presently, price action is at the 1.03240 intra-day horizontal support. Technically there is no directional clarity, but the dominant technical structure is bearish.
I may be wrong. Trade safe and prosper.
Trap
GBPUSD Weekly Technical Outlook
The GBPUSD market operation on the weekly time frame is sideways. Last week, the market operation printed a relatively moderate bullish candlestick with a prominent top wick as opposed to the bearish candlestick of two weeks ago. Presently, the market operation is located at the 50-fib retracement of the bearish swing traceable to May 2021.
GBPUSD price action on the daily time frame is presently in a bearish mode. On Wednesday, bulls made a futile attempt to retest a broken rising channel trendline; but bears resisted the challenge. Recent technical prints favour further southward market engineering. The dominant technical structure is bearish.
GBPUSD price action on the H4 time frame is in consolidation. But recent technical prints favour further southward move, and the dominant technical structure is bearish.
I may be wrong. Trade safe and prosper.
Trap
XAUUSD Weekly Technical Outlook
Last week, the XAUUSD market operation on the weekly time frame retested the upper trendline of the rising channel (red) within which it is consolidating. The bullish print has a relatively long shadow, i.e., a bearish pinbar, and closed at the 2882.38 area: a previous horizontal resistance formed by the bullish print of two weeks ago being flipped as suport.
XAUUSD price action on the daily time frame has disposed bearish. The bearish candlestick printed on Friday broke below the low of the bullish candlestick printed on Thursday. However, price action is presently tackling an intra-day horizontal support in the 2882.38 area. Technically, further southward drive is favoured.
Although the XAUUSD price action is presently sideways as it tackles the 2882.38 intra-day horizontal support, the preceding technical impulse is bearish. And we may see further southward drive. Pattern traders may be interested in the emerging ‘M’ pattern on the H4 time frame.
I may be wrong. Trade safe and prosper.
Trap
USDJPY Weekly Technical Outlook
Last week, the USDJPY market operation on the weekly time frame went sideways after a bullish rejection of the 152.520/150.810 horizontal support zone (magenta). The market operation printed a bearish pinbar in the zone. Although, technically, this favours bears, we may still see a northward retest of an area of value before a southward turnaround.
USDJPY price action on the daily time frame made a bearish retest of the 152.520/150.810 horizontal support zone (magenta) on Friday. But the bearish print in the zone is relatively small and has shadows on both ends. Technically, we may still see a bullish pullback to an intra-day area of value before any bearish momentum.
USDJPY price action on the H4 time frame is presently sideways at the 152.280 intra-day horizontal support. Recent technical prints favour northward market engineering, perhaps to an intra-day area of value, before further southward drive. Generally, the market is retesting a larger horizontal support zone, the 152.520/150.810 horizontal support zone (magenta), seen on the weekly time frame
I may be wrong. Trade safe and prosper.
Trap
EURUSD Weekly Technical Outlook
Although the EURUSD market operation on the weekly time frame printed a relatively big bullish candlestick last week, the market is in a consolidation. Generally, in the last seven weeks, the market operation has been consolidating in the 38.2/23.6 fib retracement zone of the bearish swing traceable to May 2021. Presently, the market operation is retesting the 1.04880 horizontal resistance area.
EURUSD price action on the daily time frame is consolidating in the 1.05140/1.02180 horizontal channel (blue). Presently, the price action is retesting the upper part of the channel. The bullish print in the area on Friday is relatively smaller than the one printed on Thursday, which indicates a decline in bullish momentum. Apparently, a southward turnaround is in the offing.
EURUSD price action on the H4 time frame retested the 1.05140 horizontal resistance on Friday. Although there was a bearish challenge in the area, the challenge was feeble. Nevertheless, it is a technical indication that we may soon see a bearish turnaround in the area or in an intra-day area of value above the area.
I may be wrong. Trade safe and prosper.
Trap
GBPUSD Weekly Technical Outlook
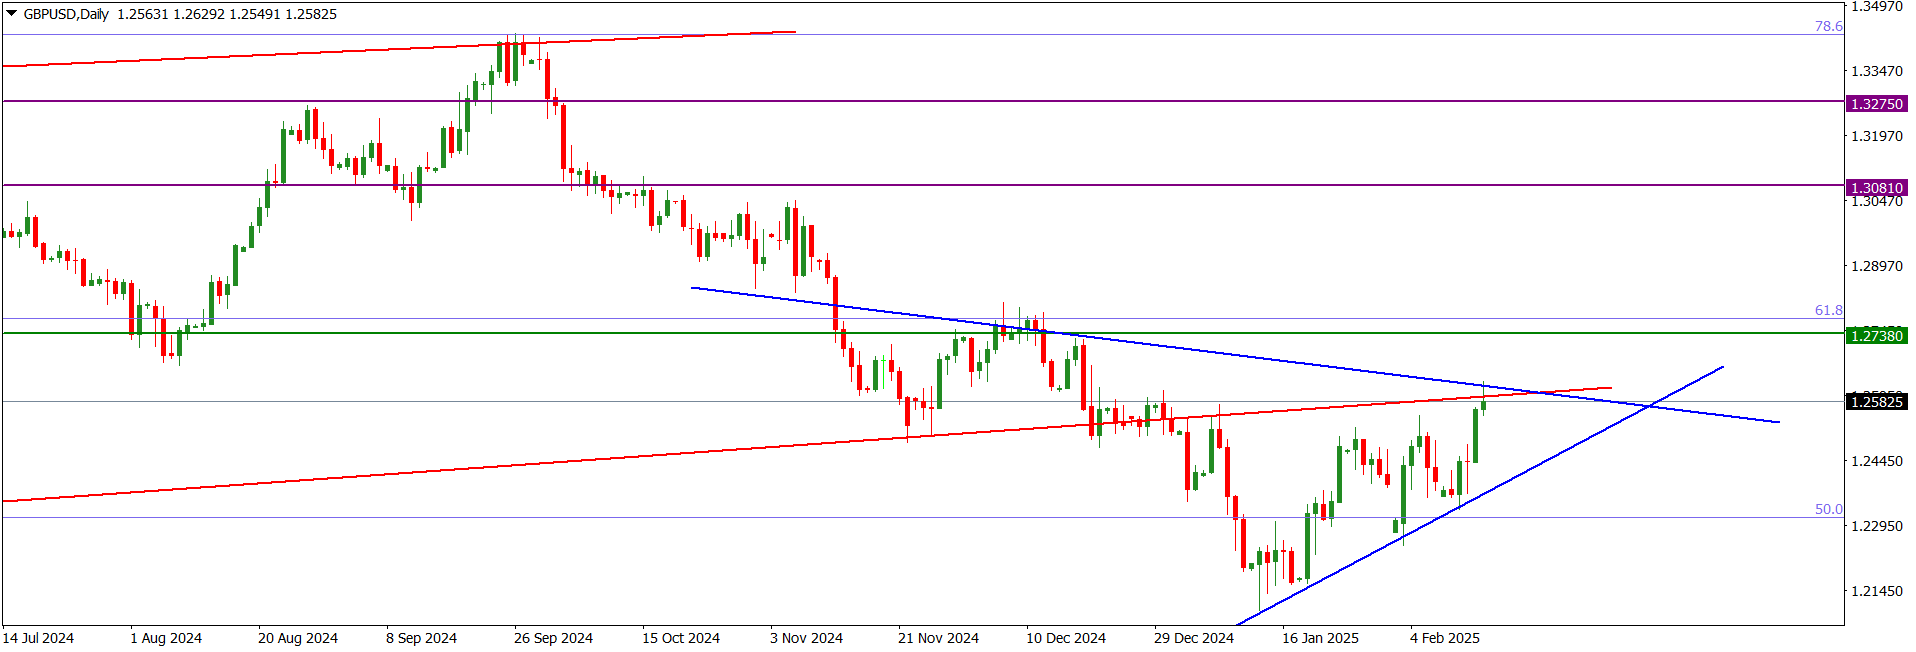
The GBPUSD market operation on the weekly time frame is in consolidation. After a bearish breakdown of the rising channel (red) within which it had operated for several weeks, recent GBPUSD technical prints have formed a symmetrical triangle (blue). The bullish print of last week closed at the upper trendline of the triangle.
GBPUSD price action on the daily time frame is consolidating within a symmetrical triangle (blue). On Friday, price action retested the upper trendline and printed a bearish pinbar in the area. Technically, we may soon see a southward rotation, perhaps after northward liquidity engineering to an intra-day area of value.
GBPUSD price action on the H4 time frame retested the 1.26300 intra-day horizontal resistance on Friday. The area intersects with the upper trendline of a symmetrical triangle (blue) within which the price action is consolidating. Although there was a bearish challenge in the area, the challenge was feeble. Nevertheless, it is a technical indication that we may soon see a southward rotation, perhaps after a brief northward market engineering.
I may be wrong. Trade safe and prosper.
Trap
XAUUSD Weekly Technical Outlook
The XAUUSD market operation on the weekly time frame continues to be disposed bullish. Last week, it printed a relatively moderate bullish candlestick which retested the upper trendline of the rising channel (magenta) within which it has been consolidating for several weeks.
XAUUSD price action on the daily time frame is retesting the upper trendline of the rising channel (magenta) within which it has been consolidating for several weeks. Presently, price action is sideways in the area. The preceding technical impulse is bullish, and we may still see further northward move before a southward rotation.
XAUUSD price action on the H4 time frame is presently sideways. Price action is retesting the upper trendline of the rising channel (magenta) within which it has been consolidating for several weeks. We cannot rule out further northward market engineering.
I may be wrong. Trade safe and prosper.
Trap
USDJPY Weekly Market Outlook
The USDJPY market operation on the weekly time frame resumed a southward mode last week after a bearish breakdown of the 152.520/150.810 horizontal support zone (magenta). But the relatively big bearish candlestick printed last week closed at the 149.220 longer-term horizontal support (green).
Although the USDJPY price action on the daily time frame is presently sideways at the 149.220 horizontal support (green), the technical impulse favours bears more than bulls. Thus, apart from a probable northward corrective move to shake out weak hands in the early part of this week, we will likely see further southward drive.
USDJPY price action on the H4 time frame went sideways at the 149.220 horizontal support (green) after a bearish retest. Although the technical impulse favours bears more than bulls, we cannot rule out a bullish corrective move in the early part of this week.
I may be wrong. Trade safe and prosper.
Trap
EURUSD Weekly Technical Outlook
Last week, the EURUSD market operation on the weekly time frame went sideways at the 1.04000/1.05140 horizontal resistance zone (blue). Technically, this is about 150 pips below the 38.2 fib retracement of the bearish swing traceable to May 2021.
EURUSD price action on the daily time frame is presently sideways within the 1.04000/1.05140 horizontal resistance zone (blue). Although the dominant technical structure is bearish, we may still see northward market engineering to an intra-day area of value before a southward drive.
EURUSD price action on the H4 time frame is sideways. Presently, it is at the 1.04570 intra-day horizontal support. But as the preceding technical impulse is bullish, we may still see northward marketing engineering in the early part of this week.
I may be wrong. Trade safe and prosper.
Trap
GBPUSD Weekly Technical Outlook
The GBPUSD market operation on the weekly time frame retested the 1.26320 horizontal resistance area last week but met a bearish challenge. This led to the printing of a relatively small bullish candlestick in the area.
GBPUSD price action on the daily time frame is sideways at the 1.26320 horizontal resistance area. There was a bullish retest of the area on Thursday, but on Friday bears resisted a breakout from the area. However, the bearish candlestick printed in the area on Friday is relatively small. Thus, technically, we may still see further northward market engineering in the early part of this week. Nevertheless, the dominant technical structure is bearish.
GBPUSD price action on the H4 time frame is sideways at the 1.26320 intra-day horizontal support. But the technical impulse favours bulls more than bears, and we may still see further northward market engineering. Nevertheless, the dominant technical structure is bearish.
I may be wrong. Trade safe and prosper.
Trap
XAUUSD Weekly Technical Outlook
The XAUUSD market operation on the monthly time frame is consolidating within a rising channel (magenta). In February, the bullish candlestick printed in February broke above the upper trendline before retracing.
The XAUUSD market operation on the weekly time frame is consolidating at the upper part of a rising channel (magenta). The bearish candlestick printed last week broke below the 2857.45 horizontal support but retraced to close at the area.
The XAUUSD price action on the daily time frame retested the 2857.45 horizontal support area on Friday. The recent technical prints have formed a rising wedge (blue) within a larger rising channel (magenta). The wedge was broken down by the bearish move of Friday but its relatively long tail shows that bulls are still influential in the market. We can expect an imminent northward turnaround, perhaps after a southward liquidity sweep to an intra-day area of value.
I may be wrong. Trade safe and prosper.
Trap
USDJPY Weekly Technical Outlook
The USDJPY market operation on the monthly time frame printed a bearish candlestick in February. The candlestick retested the 149.220 horizontal support area (green) before retracing. Technically, the market operation is still in a consolidation phase as the bearish candlesticks printed in both January and February could not close below the low of the bullish candlestick printed in December 2024.
Last week, the USDJPY market operation on the weekly time frame went sideways after a bullish pullback of the bearish drive to the 149.220 horizontal support area (green) two weeks ago. The bullish print of last week is relatively small in contrast to the bearish print of the previous week.
On Friday, the USDJPY price action on the daily time frame made a bullish pullback to the bearish drive to the 149.220 horizontal support area (green) after a period of consolidation in the early part of last week. The technical impulse favours bears more than bulls. So, a southward turnaround is imminent.
I may be wrong. Trade safe and prosper.
Trap
EURUSD Weekly Technical Outlook
The EURUSD market operation on the monthly time frame turned bullish in February. The bullish candlestick printed in February retested the 1.04000/1.05140 horizontal resistance zone (blue) before closing at the lower boundary, leaving a relatively moderate top-wick within the zone. This contrasts with the indecision candlestick printed in the same area in January. The dominant technical structure is bearish.
The EURUSD market operation on the weekly time frame is sideways in the 1.04000/1.05140 horizontal resistance zone (blue). Market operation has been in the area for a few weeks. The bearish candlestick printed in the area last week had a more prominent upper shadow (wick) than the tail. This technically favours bears more than bulls.
The EURUSD price action on the daily time frame is bearish. However, there is a decline in bearish momentum as price action printed a relatively small bearish candlestick below the 1.04000/1.05140 horizontal resistance zone (blue) on Friday. Although the dominant technical structure is bearish, we may still see northward market engineering.
I may be wrong. Trade safe and prosper.
Trap
GBPUSD Weekly Technical Outlook
The GBPUSD market operation on the monthly time frame made a bullish retest of the 1.24700/1.27100 horizontal resistance zone (red) in February. There was a bearish breakdown of the area in January.
The GBPUSD market operation on the weekly time frame is sideways within the 1.24700/1.27100 horizontal resistance zone (red). There was a bullish retest of the area three weeks ago.
The GBPUSD price action on the daily time frame is consolidating within a rising wedge (blue). Presently it is in a bearish mode as the price action retested the lower wedge trendline on Friday. It is also at the intersection of the trendline and an intra-day horizontal support. This may result in a bullish rejection of the area, at least in the short term. Nevertheless, the dominant technical structure is bearish.
I may be wrong. Trade safe and prosper.
Trap
XAUUSD Weekly Technical Outlook
The XAUUSD market operation on the weekly time frame printed a relatively moderate bullish candlestick last week. However, the market operation is in a sideway mode as bulls are retesting a horizontal resistance area after a bearish breach.
The XAUUSD price action on the daily time frame is sideways at the 2909.02 horizontal resistance area. As the preceding technical impulse is bullish, we may still see a further northward momentum in the early part of this week.
The XAUUSD price action on the H4 time frame is consolidating within a rising triangle (blue). However, the preceding technical impulse is bullish. So, we may still see a further northward momentum in the early part of this week.
I may be wrong. Trade safe and prosper.
Trap
USDJPY Weekly Technical Outlook
The USDJPY market operation on the weekly time frame resumed a bearish mode last week after it printed a relatively moderate bearish candlestick that broke down the 149.220 horizontal support area (green).
The USDJPY price action on the daily time frame retested the 147.996 horizontal support on Thursday. But a bearish attempt to break down the area on Friday met with a strong bullish challenge. This led to the printing of a bullish pinbar in the area. Technically, this favours further northward move, at least in the short term.
Recent technical prints of the USDJPY price action on the H4 time frame show a consolidation within a falling wedge or triangle (blue). Presently, the price action is sideways at the upper wedge-trendline and at the 147.996 intra-day horizontal resistance. Apparently, the price action is making a bullish correction of the bearish breakdown of the 149.220 horizontal support area (green) seen on the weekly time frame. We can still expect a further northward move in the early part of this week.
I may be wrong. Trade safe and prosper.
Trap
EURUSD Weekly Technical Outlook
The EURUSD market operation on the weekly time frame turned bullish last week. The market operation printed a very big bullish candlestick that broke above the 1.05142 horizontal resistance area. After displacing more than 300 pips above the area, the bullish candlestick retested the 1.08876 weekly supply area, which is aligned with the 50-fib retracement area of the bearish swing traceable to May 2021.
The EURUSD price action on the daily time frame is bullish. Presently, the price action is retesting the 1.08876 weekly supply area, which is aligned with the 50-fib retracement area of the bearish swing traceable to May 2021. Although the prominent upper wick on the bullish print of Friday indicates bearish pressure in the area, we may still see further northward move in the early part of this week.
The EURUSD price action on the H4 time frame is consolidating at the 1.08290 intra-day horizontal support after a bearish retest. Although the technical impulse favours further northward move, such a move may be short lived.
I may be wrong. Trade safe and prosper.
Trap