GBPUSD Weekly Technical Outlook
Last week, the GBPUSD market operation on the weekly time printed a relatively big bullish candlestick that retested the 1.30800 horizontal resistance area. But the market operation is technically sideways on the weekly time frame. Presently, market operation is located about 300 pips above the 61.8 fib-retracement of the bearish swing traceable to May 2021. It is also located around the 78.6 fib-retracement of the most recent bearish swing. Technically, we may see a bearish correction in the area.
The GBPUSD price action on the daily time printed a bullish continuation candlestick on Friday to retest the 1.30800 horizontal resistance. Recent candlestick prints in the area indicate that bears are resisting further northward drive. Thus, we may see a bearish correction in the early part of this week.
The GBPUSD price action on the H4 time frame turned sideways on Friday after a bullish drive to retest the 1.30800 horizontal resistance area. The technical prints in the past few days favour a southward market engineering.
I may be wrong. Trade safe and prosper.
Trap
XAUUSD Weekly Technical Outlok
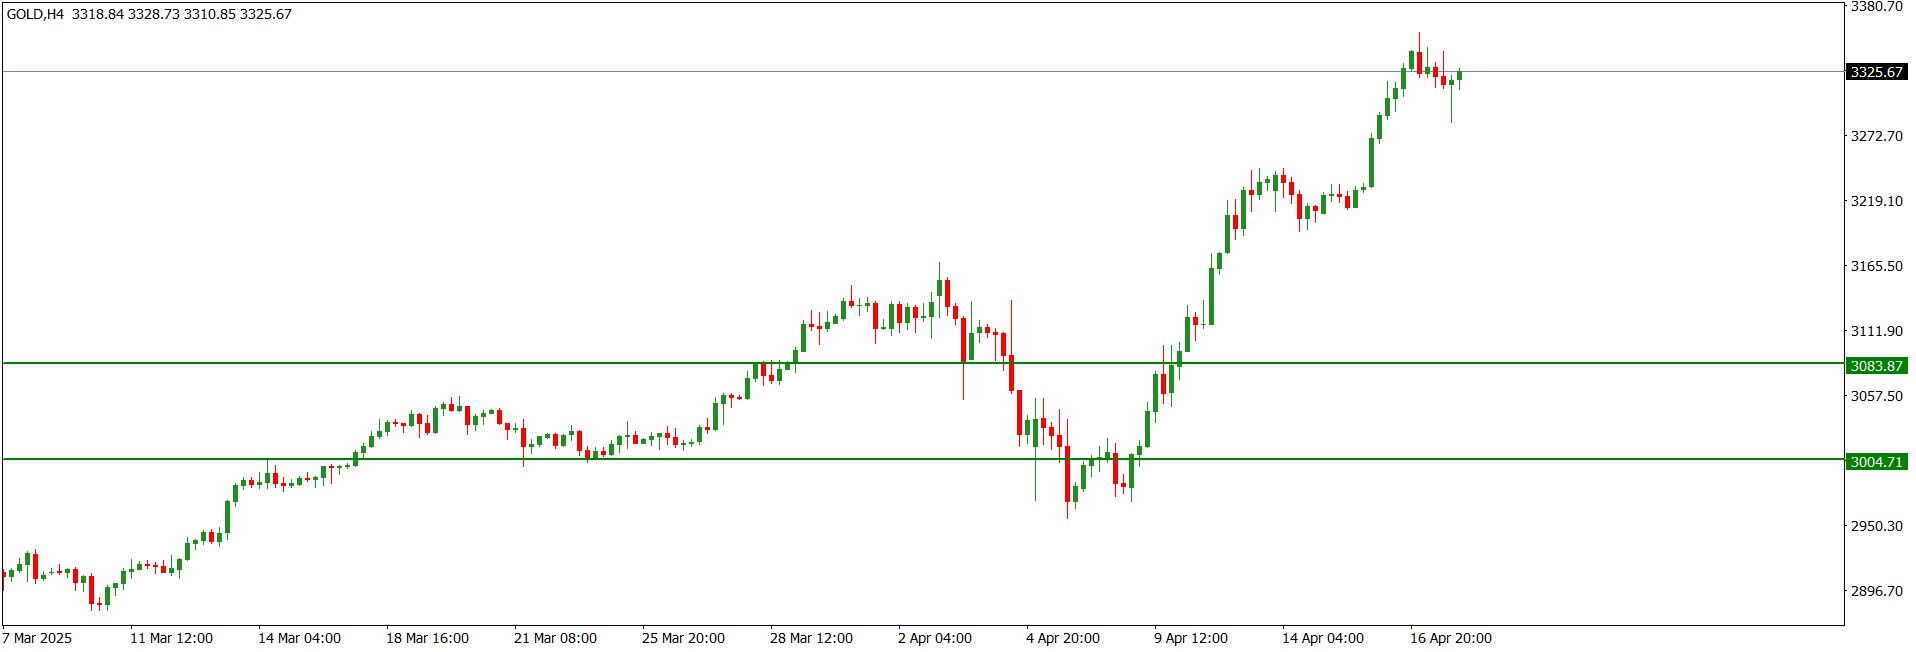
The XAUUSD market operation on the weekly time frame is bullish. Last week, the market operation printed a bullish continuation candlestick that produced a multi-year high before retracing.
The XAUUSD price action on the daily time frame is in bullish mode. On Friday, the price action printed a bullish pinbar after a relatively big bullish print on Thursday. We can expect further northward move before a bearish pullback.
Although the XAUUSD price action on the H4 time frame is sideways at the 3325.67 intra-day horizontal resistance, the technical impulse favours bulls. Thus, we may see further northward drive before a bearish pullback.
I may be wrong. Trade safe and prosper.
Trap
USDJPY Weekly Technical Outlook
The USDJPY market operation on the weekly time frame is bearish. Last week, the market operation printed a bearish continuation candlestick that broke down the rising channel within which the market operation has been consolidating for several weeks. We may still see further southward drive before a bullish pullback.
The USDJPY price action on the daily time frame is sideways at the 142.100 horizontal support area. Nevertheless, the technical pattern favours southward market engineering.
Although the USDJPY price action on the H4 time frame is sideways at the 142.100 horizontal support area, the preceding technical impulse is bearish. Thus, we may still see further southward drive to an intra-day area of value.
I may be wrong. Trade safe and prosper.
Trap
EURUSD Weekly Technical Outlook
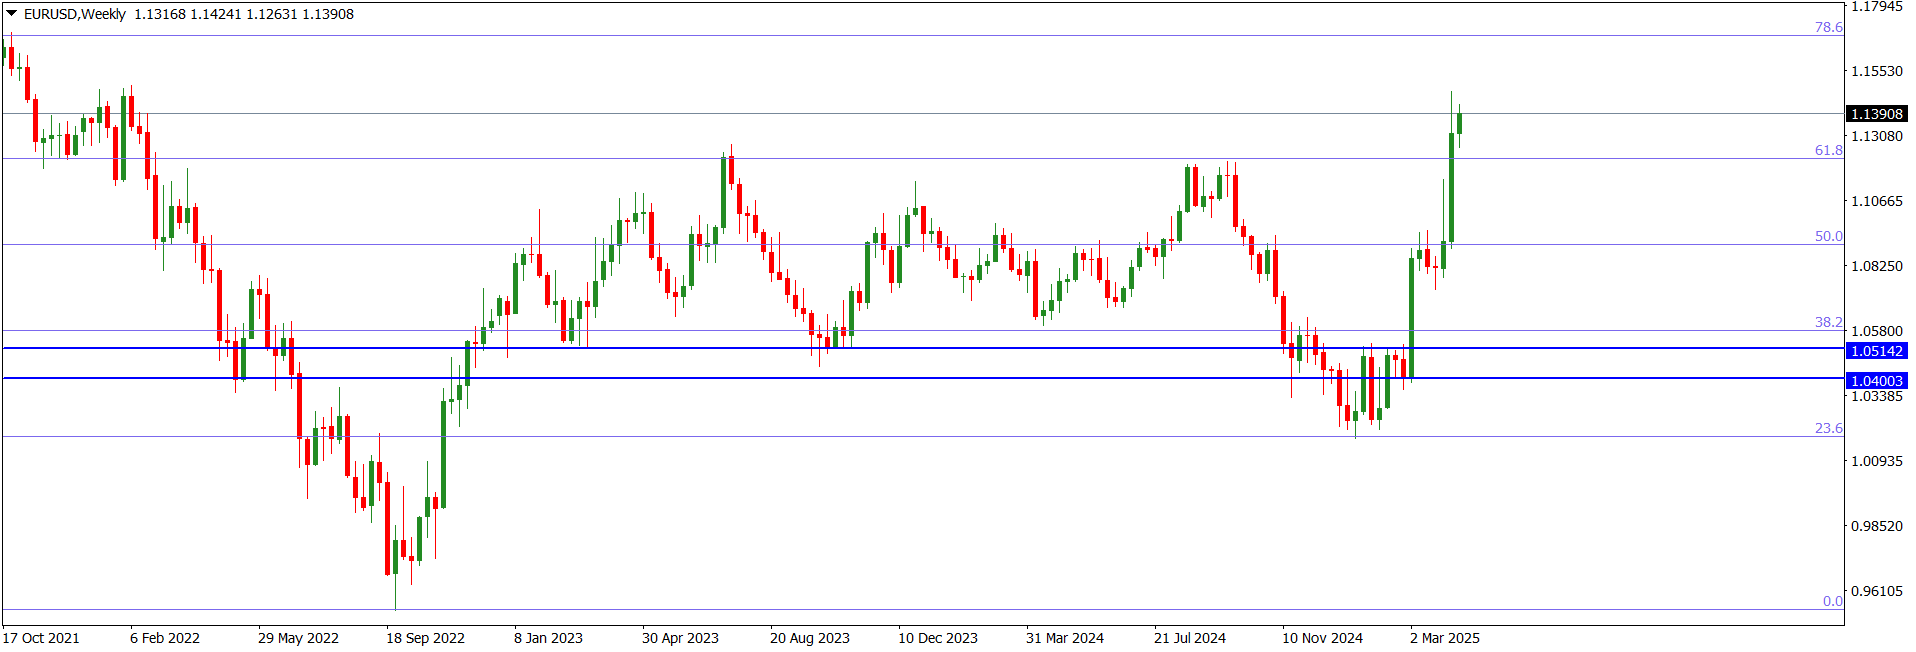
The EURUSD market operation on the weekly time frame printed a bullish candlestick last week. However, the candlestick is relatively smaller than the bullish candlestick printed two weeks ago and failed to retest its high. This indicates a decline in bullish potency.
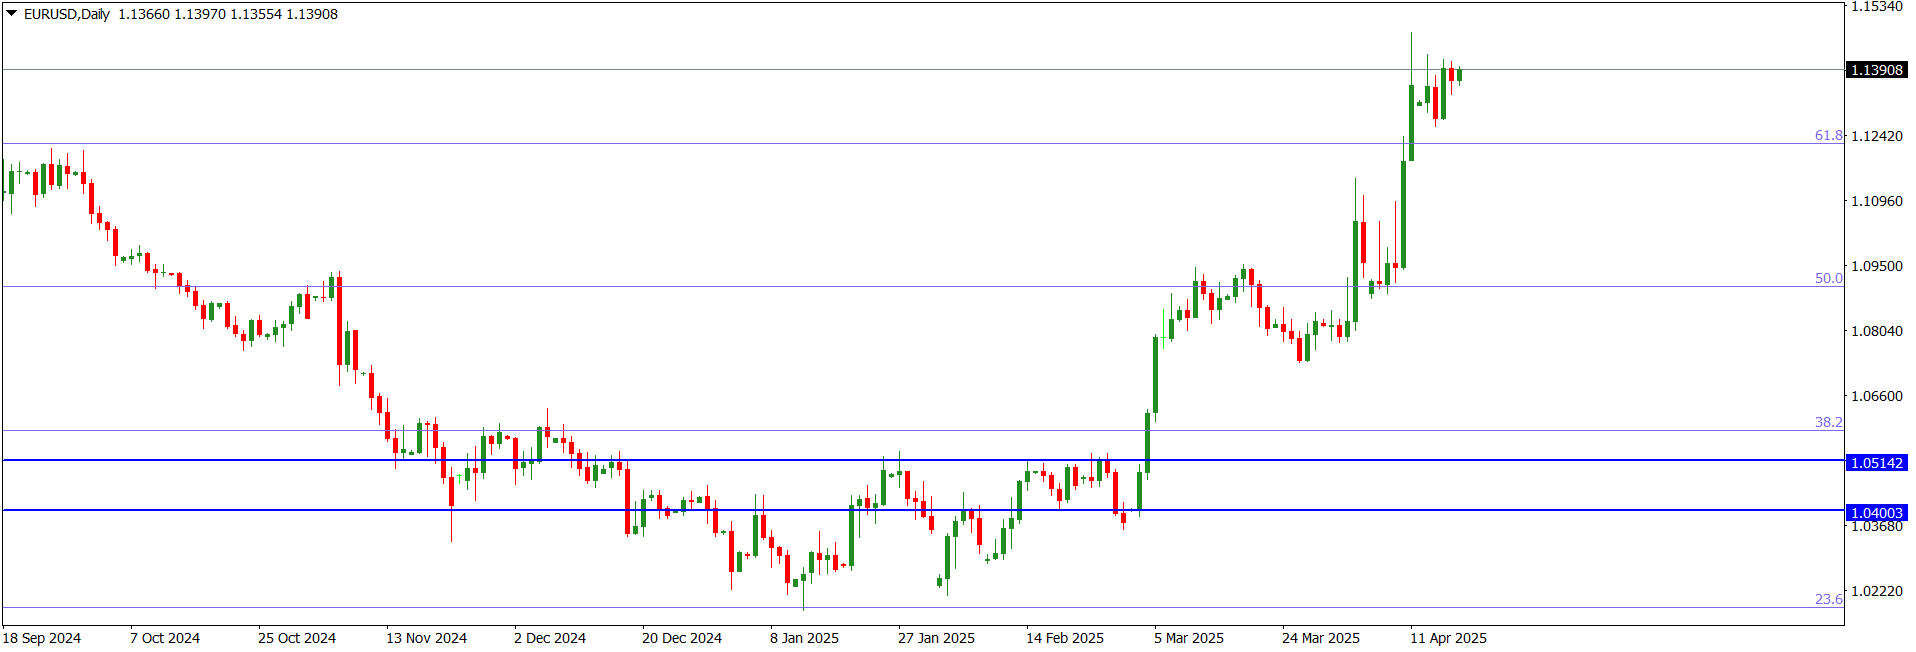
The EURUSD price action on the daily time frame went sideways at the 1.13908 intra-day horizontal resistance after a bullish drive above it. Nevertheless, we may still see further northward move before a southward rotation.
Although, presently, the EURUSD price action on the H4 time frame is sideways at the 1.13908 intra-day horizontal resistance, we may still see further northward move before a southward rotation.
I may be wrong. Trade safe and prosper.
Trap
GBPUSD Weekly Technical Outlook
The GBPUSD market operation on the weekly time frame is bullish. Last week, the market operation printed a bullish continuation candlestick that breached the high of the bearish pinbar printed three weeks ago. Technically, further northward move may target the 1.34300 horizontal resistance area, which aligns with the 78.6 fib-retracement of the bearish swing traceable to May 2021.
The GBPUSD price action on the daily time frame is bullish. Although there is a decline in bullish momentum, we may still see further northward move of price action which could target the 1.34300 horizontal resistance area; an area that aligns with the 78.6 fib-retracement of the bearish swing traceable to May 2021.
Although there is a decline in bullish momentum of the GBPUSD price action on the H4 time frame, based on the technical structure of the weekly time frame we may still see further northward move of price action. This could target the 1.34300 horizontal resistance area, which aligns with the 78.6 fib-retracement of the bearish swing traceable to May 2021.
I may be wrong. Trade safe and prosper.
Trap
Got a little bounce down at 5 PM today with Bessent’s de-escalation. Caught some nice pips.
1 Like
XAUUSD Weekly Technical Outlook
The XAUUSD market operation on the weekly time frame is experiencing a bearish challenge to the rapid bullish drive that produced a multi-year high recently. Last week, the market operation printed a relatively big bearish pinbar. Technically, this portends a southward rotation of market operation.
The XAUUSD price action on the daily time frame turned sideways after a bearish pushback to the bullish charge at the 3500.00 multi-year high. We may see a southward drive before a significant bullish pushback.
Although the XAUUSD price action on the H4 time frame is retesting the 3318.14 intra-day horizontal resistance, we may see further southward drive this week.
I may be wrong. Trade safe and prosper.
Trap
USDJPY Weekly Technical Outlook
Last week, the USDJPY market operation on the weekly time frame printed a bullish candlestick to retest the 143.640 broken down horizontal support. But technically the market operation is consolidating.
The USDJPY price action on the daily time frame is retesting the broken down 143.640 broken down horizontal support. There was sideways of price action below the area on Wednesday and Thursday. But, on Friday, the price action made a bullish push to retest the area. However, the bullish momentum is weak. Nevertheless, we may still see further northward movement in the early part of this week.
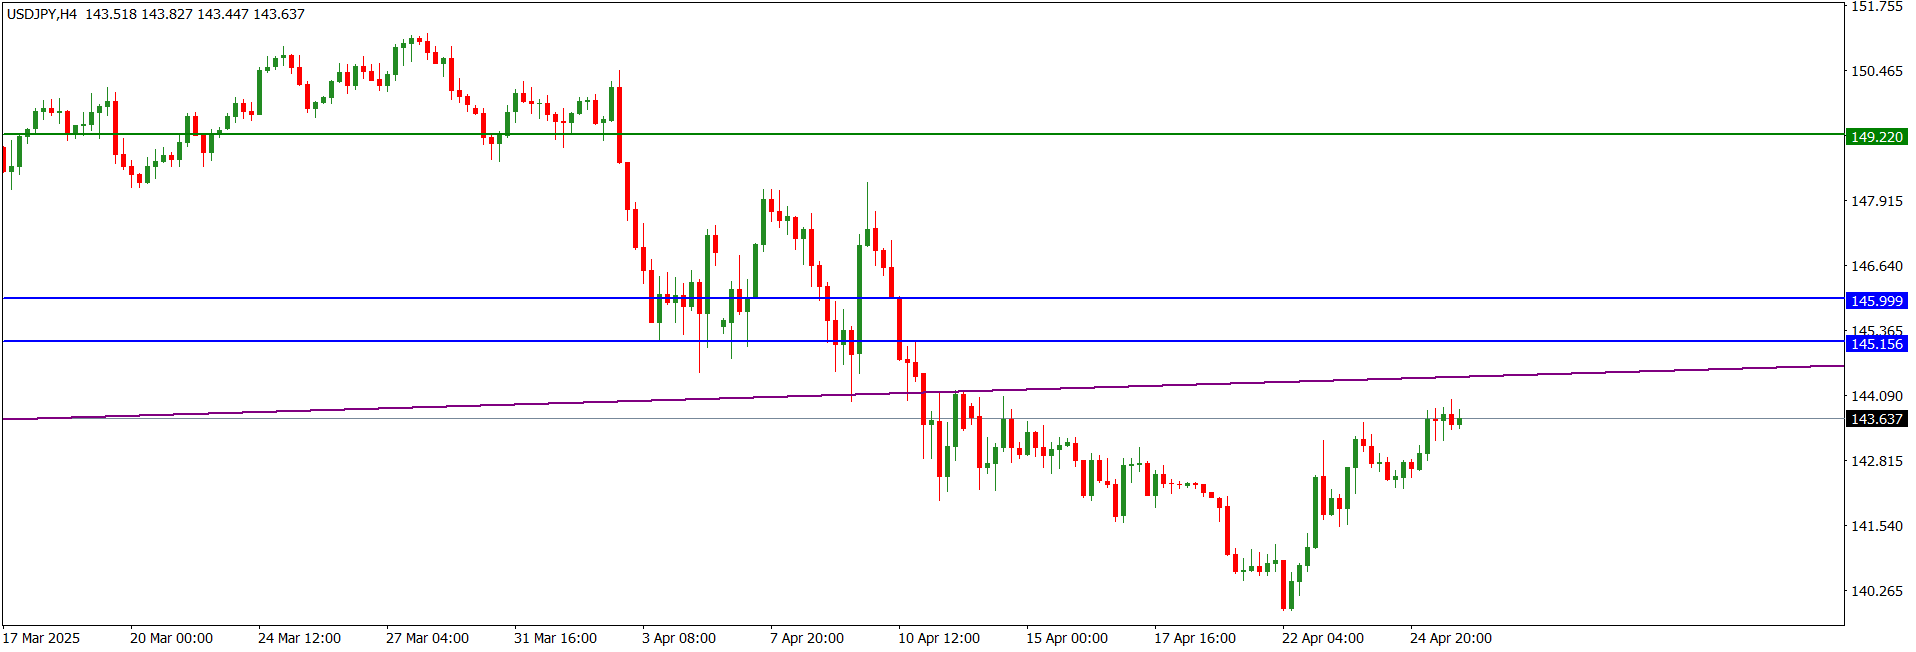
The USDJPY price action on the H4 time frame turned sideways on Friday after a bullish pullback to retest the 143.640 broken down horizontal support. Technically, we cannot rule out further northward market engineering, perhaps to retest an intra-day area of value such as the market imbalance within the 145.150/146.000 zone (blue).
I may be wrong. Trade safe and prosper.
Trap
EURUSD Weekly Technical Outlook
Last week, the EURUSD market operation on the weekly time frame printed a bearish candlestick after retesting the 1.15750 horizontal resistance area. The area was last visited in November 2021. Technically, apart from a bullish retest of an intra-day area of value, this portends a southward drive of market operation.
The EURUSD price action on the daily time frame turned sideways after a bearish drive to the 1.13600 horizontal support. We may still see further southward drive of price action.
The EURUSD price action on the H4 time frame turned sideways after a bearish pullback of a bullish charge to the 1.15750 horizontal resistance area, an area that was last visited in November 2021. Recent technical patterns favour a southward market engineering.
I may be wrong. Trade safe and prosper.
Trap
GBPUSD Weekly Technical Outlook
Last week, the GBPUSD market operation on the weekly time frame made a bullish drive to retest the 78.6 fib-retracement of the bearish swing traceable to May 2021. The area aligns with the 1.34300 horizontal resistance. Thereupon, the candlestick print turned out to be a bearish pinbar.
The GBPUSD price action on the daily time frame turned sideways after a bearish pullback from the 1.34300 horizontal resistance. Presently, the price action is consolidating at the 1.33074 intra-day horizontal resistance. Technically, there is a decline in bullish momentum, and we may see further southward drive this week.
The GBPUSD price action on the H4 time frame is in consolidation. There is a decline in bullish momentum, and we may see increased bearish pressure for southward liquidity sweep.
I may be wrong. Trade safe and prosper.
Trap
XAUUSD Weekly Technical Outlook
In April, the XAUUSD market operation on the monthly time frame printed a bullish continuation candlestick. However, after producing a multi-year high of 3499.94 the candlestick retraced, leaving a prominent upper shadow.
The XAUUSD market operation on the weekly time frame has issued an evening star pattern. Technically, this portends a bearish rotation. But we may still see a northward market engineering before a southward turnaround.
The XAUUSD price action on the daily time frame turned sideways on Friday at the 3240.08 horizonal support after a bearish drive below it. Although the bigger picture favours bears, we may still see a bullish pullback before further southward drive.
I may be wrong. Trade safe and prosper.
Trap
USDJPY Weekly Technical Outlook
In April, the USDJPY market operation on the monthly time frame printed a bearish continuation candlestick that broke down the rising channel (purple) within which it has been consolidating for several months.
Last week, the USDJPY market operation on the weekly time frame made a bullish pullback into the broken-down rising channel (purple) within which it had been consolidating. The bullish candlestick printed last week also retested the 145.150/146.00 horizontal resistance zone (blue).
The USDJPY price action on the daily time frame turned sideways on Friday after a bullish retest of the 145.150/146.00 horizontal resistance zone (blue). The preceding technical impulse and recent candlestick patterns favour a northward liquidity sweep to an intra-day area of value.
I may be wrong. Trade safe and prosper.
Trap
EURUSD Weekly Technical Outlook
Last month, the EURUSD market operation on the monthly time frame maintained a bullish mode. In April, the market operation printed a relatively big bullish candlestick. The candlestick left an upper shadow in the 61.8/78.6 fib zone of the bearish swing traceable to May 2021.
Last week, the EURUSD market operation on the weekly time frame was bearish. The bearish candlestick printed last week retested the 1.12957 horizontal support area.
The EURUSD price action on the daily time frame went sideways on Friday as it retested the 1.12957 horizontal support area. Nevertheless, we cannot rule out a bullish pullback before further southward drive.
I may be wrong. Trade safe and prosper.
Trap
GBPUSD Weekly Technical Outlook
The GBPUSD market operation on the monthly time frame maintained a bullish mode in April. The market operation retested the 1.34257 area, an area that aligns with the 78.6 fib-retracement of the bearish swing traceable to May 2021.
Last week, the GBPUSD market operation on the weekly time frame went sideways at the 1.32640 area afterbay bearish pullback. There was a bullish drive to the 1.34257 area two weeks ago. This situation represents a decline in bullish momentum.
The GBPUSD price action on the daily time frame turned sideways on Friday after a bearish challenge of the bullish drive to the 1.34257 /1.34360 area. Presently, the price action is tackling the 1.32640 intra-day horizontal support. Nevertheless, we may still see a bullish pullback before a southward turnaround.
I may be wrong. Trade safe and prosper.
Trap