GBPUSD Weekly Technical Outlook
The GBPUSD market operation on the weekly time frame turned bullish last week. The market operation printed a relatively big bullish candlestick that broke above the 1.27100 horizontal resistance. After displacing more than 200 pips above the area, the bullish candlestick retested the 1.29160 horizontal resistance area, which is above the 61.8-fib retracement area of the bearish swing traceable to May 2021.
The GBPUSD price action on the daily time frame went sideways at the 1.29160 horizontal resistance area after a bullish retest. The technical impulse favours further northward move.
The GBPUSD price action on the H4 time frame went sideways at the 1.29160 horizontal resistance area after a bullish retest. The technical impulse favours further northward drive, perhaps to retest an intra-day area of value.
I may be wrong. Trade safe and prosper.
Trap
XAUUSD Weekly Technical Outlook
The XAUUSD market operation on the weekly time frame regained a bullish mode last week after a bullish breakout from an area of consolidation that had been in place for four weeks.
The XAUUSD price action on the daily time frame is bullish. But it went sideways on Friday at the 2984.68 horizontal resistance area.
The XAUUSD price action on the H4 time frame is consolidating at the 2984.68 horizontal resistance area. The preceding technical structure is bullish. Thus, we may still see further northward move, at least in the early part of this week.
I may be wrong. Trade safe and prosper.
Trap
USDJPY Weekly Technical Outlook
The USDJPY market operation on the weekly time frame went sideways last week as bulls challenged the bearish breakdown of the 149.220 value area. There was a bearish breakdown of the area two weeks ago, but, last week, bulls made a northward pushback. Nevertheless, it was a feeble attempt, resulting in a relatively small bullish candlestick which closed below the area. Technically, bears are still more influential in the market than bulls.
Presently, the USDJPY price action on the daily time frame is making a bullish correction of the bearish breakdown of the 149.220 horizontal support area. The technical impulse favours bears more than bulls. Thus, although we may still see northward move to an intra-day area of value, a southward turnaround is imminent.
Although the USDJPY price action on the H4 time frame is in a bullish mode, the prevailing technical structure is bearish. Nevertheless, we may still see further northward move in the early part of this week before a southward turnaround.
I may be wrong. Trade safe and prosper.
Trap
EURUSD Weekly Technical Outlook
The EURUSD market operation on the weekly time frame turned sideways last week after the strong bullish drive to the 1.8760 horizontal resistance area two weeks ago. The area aligns with the 50-fib retracement of the bearish swing traceable to May 2021. The dominant technical structure is bearish.
The EURUSD price action on the daily time frame is consolidating at the 50-fib retracement of the bearish swing traceable to May 2021. Although the preceding technical impulse favours bulls, the dominant technical structure is bearish. So, further northward momentum would soon give way to a southward turnaround.
Although the EURUSD price action on the H4 time frame is presently sideways at the 1.8760 horizontal resistance area, the technical impulse favours bulls more than bears. So, we may still see further northward move. Nevertheless, the dominant technical structure is bearish.
I may be wrong. Trade safe and prosper.
Trap
GBPUSD Weekly Technical Outlook
The GBPUSD market operation on the weekly time frame turned sideways last week after the strong bullish drive to the 1.29306 horizontal resistance area two weeks ago. Technically, we may still see further northward move this week. Nevertheless, the dominant technical structure is bearish.
The GBPUSD price action on the daily time frame is consolidating at the 1.29306 horizontal resistance area. As the technical impulse favours bulls, we may still see further northward market operation into an area of value. But the dominant technical structure is bearish.
The GBPUSD price action on the H4 time frame is consolidating as it tackles the 1.29306 horizontal resistance area. As the preceding technical impulse is bullish, we may still see further northward drive before a southward rotation. The dominant technical structure is bearish.
I may be wrong. Trade safe and prosper.
Trap
XAUUSD Weekly Technical Outlook
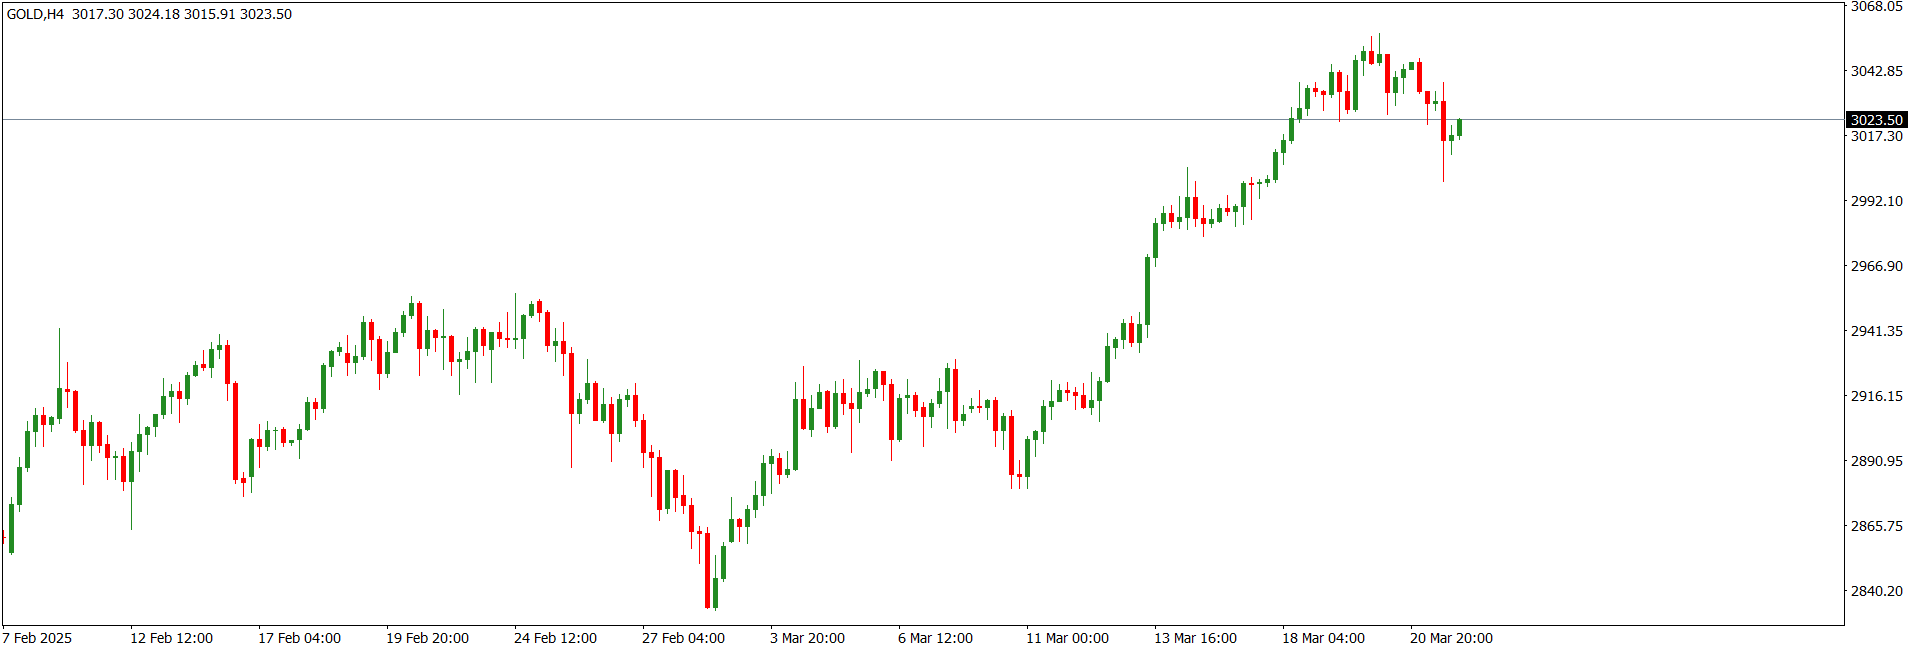
The XAUUSD market operation on the weekly time frame retains a bullish mode. Last week, the market operation printed a bullish continuation candlestick. Presently, market operation is at the 3023.50 area.
The XAUUSD price action on the daily time frame is sideways at the 3023.50 area. Although the technical impulse favours bulls, we may see a southward market engineering for liquidity grab at an intra-day area of value before further bullish drive.
The XAUUSD price action on the H4 time frame is retesting the broken-down 3023.50 intra-day horizontal support. But we may still see a southward liquidity sweep before further bullish drive.
I may be wrong. Trade safe and prosper.
Trap
USDJPY Weekly Technical Outlook
The USDJPY market operation on the weekly time frame broke down the 149.220 horizontal support area (green) three weeks ago. However, in the last two weeks the market operation has made bullish attempts to restore the area as support but to no avail. Last week’s bullish charge at the area produced a doji-like candlestick in the area.
The USDJPY price action on the daily time frame is retesting the broken-down 149.220 horizontal support (green). The technical impulse favours bears more than bulls. And we may soon see a southward turnaround.
The USDJPY price action on the H4 is sideways at the 149.220 area (green). There was a bearish breakdown of the area a few days ago but bulls are resisting further bearish drive below the area. Recent technical prints favour a southward market engineering.
I may be wrong. Trade safe and prosper.
Trap
EURUSD Weekly Technical Outlook
The EURUSD market operation on the weekly time frame is sideways at the 1.08090/1.09432 horizontal resistance zone. Three weeks ago, there was a very strong bullish drive to the zone. But the last two weeks have seen sideways of market operation in the zone.
The EURUSD price action is consolidating at the 1.08090/1.09432 horizontal resistance zone seen on the weekly time frame. The zone has held as resistance since November 8, 2024. And we cannot rule out an increase in bearish price in the early part of this week.
The EURUSD price action on the H4 time frame turned sideways in the latter part of last week after a bearish breakdown of the 1.09432 horizontal resistance area. Presently, it is tackling the 1.08090 intra-day horizontal support.
I may be wrong. Trade safe and prosper.
Trap
GBPUSD Weekly Technical Outlook
The GBPUSD market operation on the weekly time frame is sideways at the 1.28580/1.29720 horizontal resistance zone. Three weeks ago, there was a relatively strong bullish drive to the zone. But the last two weeks have seen sideways of market operation in the zone.
The GBPUSD price action is consolidating at the 1.28580/1.29720 horizontal resistance zone seen on the weekly time frame. The zone has held as resistance since November 8, 2024. And we cannot rule out an increase in bearish price in the early part of this week.
The GBPUSD price action on the H4 time frame turned sideways in the latter part of last week after a bearish breakdown of the 1.29675 horizontal resistance area (blue). Presently, it is tackling the 1.29090 intra-day horizontal support.
I may be wrong. Trade safe and prosper.
Trap
XAUUSD Weekly Technical Outlook
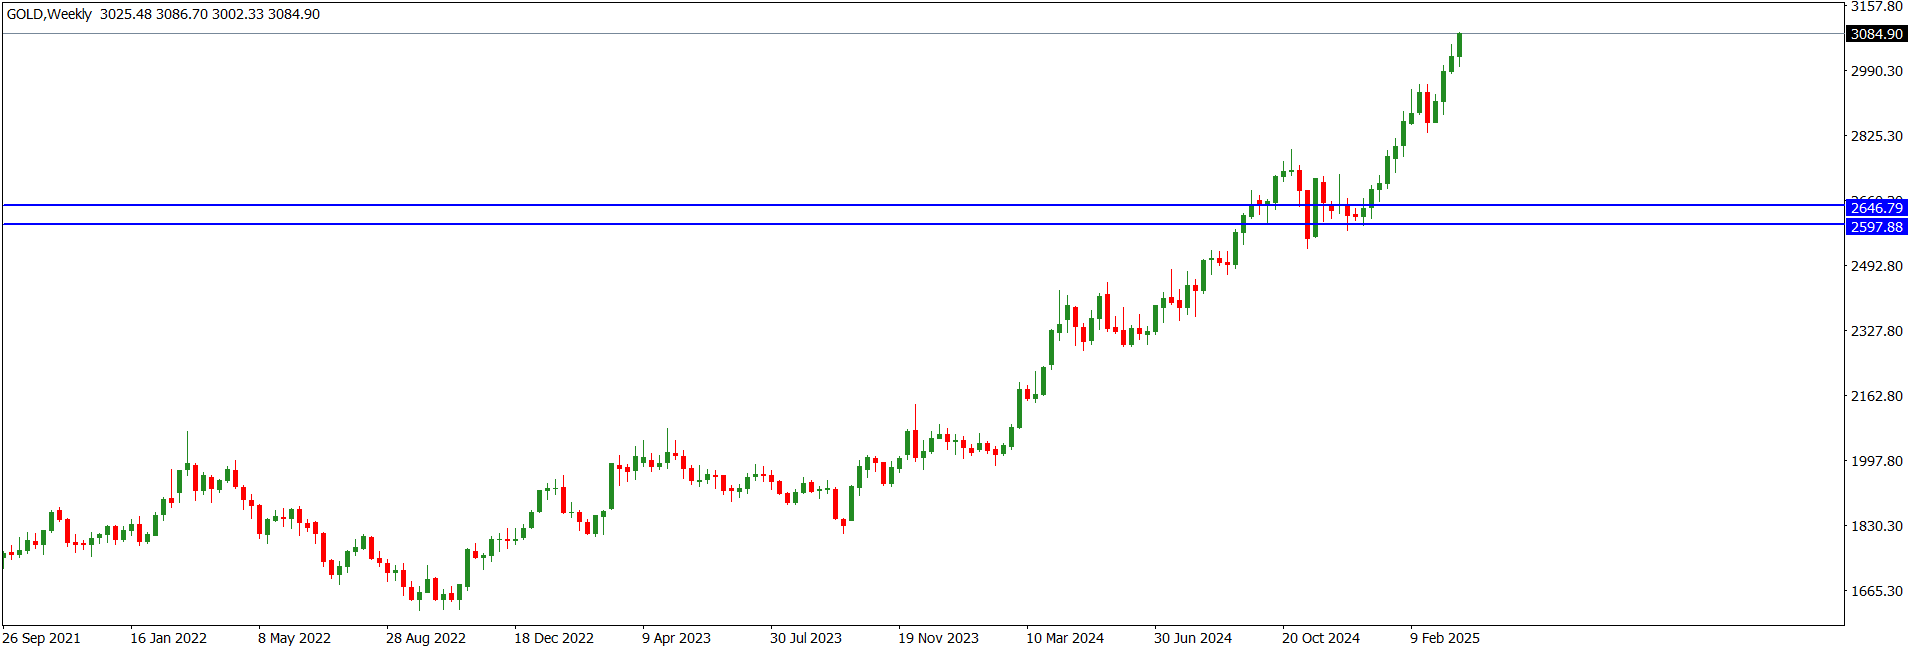
The XAUUSD market operation on the weekly time frame remains bullish. Last week, the market operation printed a relatively strong bullish continuation candlestick, which is bigger than the bullish print of two weeks ago.
The XAUUSD price action on the daily time frame is bullish. Technically, bulls are in control of the market. Nevertheless, we can expect bearish corrections on an intra-day basis.
The XAUUSD price action on the H4 time frame is retesting the 3084.90 intra-day horizontal resistance. The dominant technical structure is bullish, and the technical impulse is bullish. Thus, technically, we should expect further northward drive although intra-day bearish corrections may take place.
I may be wrong. Trade safe and prosper.
Trap
USDJPY Weekly Technical Outlook
The USDJPY market operation on the weekly time frame is sideways at the 149.220 area. Four weeks ago, there was a bearish breakdown of the area. But the past three weeks have seen bullish pullback to the area. Last week, bulls attempted a northward breakout from the area but it was feeble, resulting in the printing of a doji-like candlestick in the area. Technically, though, we may see bullish push in the early part of this week before further bearish drive.
The USDJPY price action on the daily time frame is sideways. The recent candlestick prints are within a triangle (blue). Besides, last Friday, a bearish price action retested the 149.810 intra-day horizontal support after an earlier bullish breach. We should await a directional breakout from the triangle.
The USDJPY price action on the H4 time frame has retested the lower trendline of the triangle or rising wedge (blue) within which it is consolidating. But as the most recent candlestick prints are consolidating within a rising channel (magenta upper trendline) and price action is at the lower trendline, and in confluence with the 149.810 intra-day horizontal support, we may see a northward turnaround within the channel.
I may be wrong. Trade safe and prosper.
Trap
EURUSD Weekly Technical Outlook
The EURUSD market operation on the weekly time frame remains sideways. Last week, the market operation printed a dragon fly doji at the 1.08250 horizontal resistance area. The area has not been breached for the past three consecutive weeks.
The EURUSD price action on the daily time frame made a bullish retest of the 1.08250 horizontal resistance on Friday but failed to break above it. The preceding technical impulse was bullish; and we may still see further northward move in the early part of this week. Nevertheless, the dominant technical structure is bearish.
The EURUSD price action on the H4 time frame went sideways at the 1.08250 horizontal resistance on Friday. But recent technical prints favour further northward liquidity engineering before a southward turnaround.
I may be wrong. Trade safe and prosper.
Trap
GBPUSD Weekly Technical Outlook
The GBPUSD market operation on the weekly time frame remains sideways at the 1.29675 horizontal resistance area. Last week, the market operation printed an indecision candlestick in the area, the third in three consecutive weeks.
The GBPUSD price action on the daily time frame is sideways at the 1.29675 horizontal resistance area. The preceding technical impulse is bullish, and we may still see further northward market engineering to an intra-day area of value. Nevertheless, the dominant technical structure is bearish.
The GBPUSD price action on the H4 time frame is sideways. There was a bullish retest of the 1.29675 horizontal resistance on Thursday before the price action went sideways in the area. Recent technical prints favour northward liquidity engineering before a southward turnaround.
I may be wrong. Trade safe and prosper.
Trap
XAUUSD Weekly Technical Outlook
In March, the XAUUSD market operation on the monthly time frame printed a very big bullish candlestick. This continued a pattern of printing multi-year highs by the XAUUSD market operation.
Although the XAUUSD market operation on the weekly time frame printed a bearish candlestick last week, the market is presently sideways as there was no bearish breakdown of the bullish candlestick printed two weeks ago. Nevertheless, recent technical prints favour bulls more than bears.
The XAUUSD price action the daily time frame printed a bearish candlestick on Friday. The candlestick broke below the intra-day area of consolidation that has been in place since Monday. The bearish candlestick printed on Friday retested the 3004.71/3034.18 demand zone before snapping back. Technically, we can expect a northward turnaround of price action.
I may be wrong. Trade safe and prosper.
Trap
USDJPY Weekly Technical Outlook
In March, the USDJPY market operation on the monthly time frame printed a long-tailed doji-like candlestick. This left the 149.220 area intact as support for four consecutive months.
Last week, the USDJPY market operation on the weekly time frame printed a relatively moderate-size bearish candlestick. The candlestick broke below the low of the relatively small bullish candlestick printed four weeks ago. The recent technical prints and technical impulse favour further southward market engineering.
On Thursday, the USDJPY price action on the daily time frame broke down the 146.890 intra-day horizontal support. But there was a bullish retest of the area on Friday. The technical impulse and recent technical prints favour southward market engineering.
I may be wrong. Trade safe and prosper.
Trap
EURUSD Weekly Technical Outlook
In March, the EURUSD market operation on the monthly time frame printed a bullish candlestick to retest the 1.09570 horizontal resistance area. The area aligns with the 50-fib retracement of the bearish swing traceable to May 2021.
The EURUSD market operation on the weekly time frame is bullish. Last week, the market operation printed a bullish candlestick that closed above a mini area of consolidation that was in place during the previous three weeks. We can expect further bullish market operation.
The EURUSD price action on the daily time frame is in bullish mode. On Thursday, price action printed a relatively big bullish candlestick that broke the 1.09570 horizontal resistance after some days of consolidation at about 100 pips below it. Although there was a bearish retest of the area on Friday, the technical impulse favours northward market engineering.
I may be wrong. Trade safe and prosper.
Trap
GBPUSD Weekly Technical Outlook
In March, the GBPUSD market operation on the monthly time frame printed a bullish candlestick to retest the 1.30180 horizontal resistance area. The area is proximal to the 61.8-fib retracement of the bearish swing traceable to May 2021.
The GBPUSD market operation on the weekly time frame is consolidating just below the 1.30180 horizontal resistance area. The area is proximal to the 61.8-fib retracement of the bearish swing traceable to May 2021. The preceding technical impulse favours bulls.
The GBPUSD market operation on the daily time frame is consolidating around the 1.30180 horizontal resistance area. As the preceding technical impulse favours bulls, we may see further northward market engineering.
I may be wrong. Trade safe and prosper.
Trap
XAUUSD Weekly Technical Outlook
The XAUUSD market operation on the weekly time frame is bullish. Last week, the market operation printed a relatively big bullish candlestick that significantly broke above the area of consolidation that was in place for the previous two weeks.
The XAUUSD price action on the daily time frame is bullish. As the recent price action has been parabolic, we can expect a bearish correction. But it is advisable to await what price action does upon Monday close.
The XAUUSD price action on the H4 time frame is presently sideways at the 3236.61 intra-day horizonal resistance. But the preceding technical impulse was bullish. Nevertheless, we may see a bearish correction to an intra-day value area, such as the 3152 area, which contains a market imbalance and is aligned with the 38.2 fib-retracement area of the most recent bullish swing.
I may be wrong. Trade safe and prosper.
Trap
USDJPY Weekly Technical Outlook
The USDJPY market operation on the weekly time frame is bearish. However, although the bearish candlestick printed last week broke below the 143.450 horizontal support area, it did not close below it. Besides, the candlestick did not significantly break down the rising channel (purple) within which market operation has been consolidating for several weeks.
On Friday, the USDJPY price action on the daily time frame broke down an intraday area of consolidation which had been in place for several days. However, the bearish move lacked momentum and could not close below the nearby 143.450 horizontal support area. But there was a liquidity sweep to the 142.00 value area before a northward retracement. As a medium-term swing trader, I’m not looking to trade the USDJPY. But I advise those interested to await what the USDJPY price action does at the 143.450 area by the close of business on Monday.
The USDJPY price action on the H4 time frame is sideways after a bullish pushback of a bearish breakdown of the 143.450 horizontal support area. Presently, price action is retesting the area, but we may still see further northward correction.
I may be wrong. Trade safe and prosper.
Trap
EURUSD Weekly Technical Outlook
Last week, the EURUSD market operation on the weekly time frame printed a relatively big bullish candlestick. The candlestick retested the 1.14700 horizontal resistance area before snapping back. The area is about 230 pips above the 61.8 fib-retracement of the bearish swing traceable to May 2021. Technically, we may see a bearish correction in the early part of this week.
The EURUSD price action on the daily time frame is bullish. On Thursday and Friday, the price action printed relatively big bullish candlesticks. This was opposed to the doji-like candlesticks printed on Monday through Wednesday. The bullish candlestick printed on Friday retested the 1.14700 horizontal resistance area before snapping back. The long wick on top of the bullish candlestick printed on Friday indicates that bears are resisting further northward drive.
The EURUSD price action on the H4 time frame retested the 1.14700 horizontal resistance but met some bearish pushback. This resulted in a sideways of price action at the 1.13550 area. We cannot rule out further southward move in the early part of this week.
I may be wrong. Trade safe and prosper.
Trap