USDJPY Weekly Technical Outlook
The USDJPY market operation on the weekly time frame is in consolidation at the 145.156/146.000 zone. Two weeks ago, market operation printed a hammer-like candlestick in the zone. But last week, the market operation printed a bearish pinbar in the zone.
The USDJPY price action on the daily time frame turned sideways on Friday after a bearish retest of the 145.156 intra-day horizontal support. Recent technical prints favour a southward liquidity sweep.
The USDJPY price action on the H4 time frame is sideways. Presently, it is operating within the 145.156/146.000 zone (blue), seen on the weekly time frame., which is acting as an intra-day horizontal support zone. Nevertheless, we may see a southward drive to an intra-day area of value.
I may be wrong. Trade safe and prosper.
Trap
EURUSD Weekly Technical Outlook
The EURUSD market operation on the weekly time frame took on a bearish mode five weeks ago. However, since then there has been a decline in bearish momentum. Presently, the market operation is tackling the 1.11600 horizontal support. Last week, the market operation printed an ambivalent candlestick in the area.
The EURUSD price action on the daily time frame is sideways at the 1.11600 area. There was a bearish breakdown of the area on Monday, but bulls retested the area on Tuesday. Since then, the price action has been directionless in the area. Technically, we may still see northward momentum before further southward drive, but it is better to await directional confirmation on a daily closing basis in the early part of the week.
The EURUSD price action on the H4 time frame is consolidating. Presently, the price action is tackling the 1.11600 area and there has not been clear technical impulse in the past few days.
I may be wrong. Trade safe and prosper.
Trap
GBPUSD Weekly Technical Outlook
The GBPUSD market operation on the weekly time frame is sideways within the 1.32017/1.34000 horizontal resistance zone. The zone contains the 78.6 fib retracement of the bearish swing traceable to May 2021.
The GBPUSD price action on the daily time frame is sideways at the 1.32760 area. There was a bearish breakdown of the area on Monday, but bulls retested the area on Tuesday. Since then, the price action has been directionless in the area. Technically, we may still see northward momentum before further southward drive, but it is better to await directional confirmation on a daily closing basis in the early part of the week.
The GBPUSD price action on the H4 time frame is consolidating. Presently, the price action is tackling the 1.32760 area and there has not been clear technical impulse in the past few days.
I may be wrong. Trade safe and prosper.
Trap
XAUUSD Weekly Technical Outlook
Last week, the XAUUSD market operation on the weekly time frame printed a bullish candlestick to retest the 3357.42 horizontal resistance area.
The XAUUSD price action on the daily time frame printed a bullish candlestick on Friday to retest the 3357.42 horizontal resistance area. Technically, we may still see further northward market engineering before a bearish correction.
The XAUUSD price action on the H4 time frame is tackling the 3357.42 horizontal resistance area. Recent technical prints favour further northward market engineering.
I may be wrong. Trade safe and prosper.
Trap
USDJPY Weekly Technical Outlook
The USDJPY market operation on the weekly time frame printed a bearish continuation candlestick last week. Although, presently, the market operation is tackling the 142.530 horizontal support, technically we may still see further bearish momentum.
The USDJPY price action on the daily time frame is bearish. On Friday, price action broke down a minor area of consolidation. Although, presently, the price action is located at the 142.530 horizontal support, the technical impulse favours bears more than bulls. And we may still see further southward market engineering.
Although, presently, the USDJPY price action on the H4 is tackling the 142.530 horizontal support, the technical impulse and recent technical pattern favour further southward drive.
I may be wrong. Trade safe and prosper.
Trap
EURUSD Weekly Technical Outlook
Last week, the EURUSD market operation on the weekly time frame printed a bullish candlestick to retest the 1.13590 horizontal resistance area. The area was flipped from support to resistance three weeks ago. Technically, we may still see further northward market engineering.
The EURUSD price action on the daily time frame is tackling the 1.13590 horizontal resistance. Recent technical prints and price action favours furter northward market engineering.
The EURUSD price action on the H4 time frame is tackling the 1.13590 horizontal resistance. We may still see further northward market engineering for liquidity grab.
I may be wrong. Trade safe and prosper.
Trap
GBPUSD Weekly Technical Outlook
Last week, the GBPUSD market operation on the weekly time frame printed a bullish candlestick to break out of an area of consolidation that had been in place for four weeks. There is still room northward for liquidity grab.
The GBPUSD price action on the daily time frame is bullish. On Friday, the price action printed a relatively big bullish candlestick. The technical impulse favours further northward momentum.
The GBPUSD price action on the H4 time frame is bullish. The technical impulse favours further northward market engineering.
I may be wrong. Trade safe and prosper.
Trap
XAUUSD Weekly Technical Outlook
After an extended bullish drive in May, the XAUUSD market operation on the monthly time frame printed a long doji-like candlestick. The candlestick closed at the 3288.80 horizontal resistance.
The XAUUSD market operation on the weekly time frame went sideways last week at the 3288.80 area. What market operation does in the 3366.20/3239.12 zone (purple) this week would be of interest to me.
The XAUUSD price action on the daily time frame is sideways at the 3288.80 intra-day horizontal support. The 3366.20/3239.12 zone (purple) is serving as a consolidation channel, and we may still see further southward drive in the early part of this week.
I may be wrong. Trade safe and prosper.
Trap
USDJPY Weekly Technical Outlook
In May, the USDJPY market operation on the monthly time frame printed a bearish pinbar after a retest of the 142.000 horizontal support area. The area is part of the larger 142.00/140.00 horizontal support zone (green).
The USDJPY market operation on the weekly time frame went sideways last week after a bullish challenge to the bearish drive of two weeks ago. Recent technical prints favour further southward market engineering. Nevertheless, we cannot rule out patterns of bullish correction along the way.
The USDJPY price action on the daily time frame went sideways after a bearish retest of the 143.996 intra-day horizontal support. Recent technical prints favour southward market engineering.
I may be wrong. Trade safe and prosper.
Trap
EURUSD Weekly Technical Outlook
The EURUSD market operation on the monthly time frame printed a bullish pinbar in May. The candlestick closed at the 61.8 fib-retracement area of the bearish swing traceable to May 2021. Technically, the candlestick pattern favours further northward momentum, but we will still have patterns of bearish correction along the way.
Last week, the EURUSD market operation on the weekly time frame printed a bullish pinbar. The candlestick closed at the 1.13460 horizontal resistance, which is proximal to the 61.8 fib-retracement area of the bearish swing traceable to May 2021. Technically, this pattern favours further northward momentum, but we may see a southward retest of an intra-day value area before further northward drive.
The EURUSD price action on the daily time frame went sideways on Friday after a bullish retest of the 1.13460 horizontal resistance. Recent technical prints favour further northward momentum, but we may see a retest of an intra-day value area in the early part of this week before further northward drive.
I may be wrong. Trade safe and prosper.
Trap
GBPUSD Weekly Technical Outlook
In May, the GBPUSD market operation on the monthly time frame printed an indecision candlestick in the form of a spinning top. The candlestick closed at the 1.34500 horizontal resistance area, which was flipped from support in March 2022. The area is also aligned with the 78.6 fib-retracement of the bearish swing traceable to May 2021.
The GBPUSD market operation on the weekly time frame went sideways last week after a bearish challenge of the bullish drive that breached the 1.34500 horizontal resistance two weeks ago. Although we may still see some southward movement of market operation, recent technical prints favour bulls more than bears.
The GBPUSD price action on the daily time frame is sideways at the 1.34500 intra-day horizontal support. Although we cannot rule out southward market engineering in the early part of this week, recent technical prints favour bulls more than bears.
I may be wrong. Trade safe and prosper.
Trap
XAUUSD Weekly Technical Outlook
Last week, the XAUUSD market operation on the weekly time frame issued a bearish pinbar to reject the 3366.20 horizontal resistance area. This came about as bulls made a retest of the area earlier in the week following a bearish rejection two weeks ago.
The XAUUSD price action on the daily time frame is disposed bearish. However, price action is presently located at the 3309.73 intra-day horizontal support. Nevertheless, recent technical prints favour southward market engineering.
The XAUUSD price action on the H4 time frame is bearish. Recent technical prints favour further southward drive, at least before a bullish correction.
I may be wrong. Trade safe and prosper.
Trap
USDJPY Weekly Technical Outlook
The USDJPY market operation on the weekly time frame is in bullish mode. Last week’s bullish candlestick retested the broken-down rising channel (purple) within which it had been consolidating for several weeks. This present location aligns with the 144.830 horizontal resistance area.
The USDJPY price action on the daily time frame is in a bullish mode. Presently, it is at the 144.830 area, which aligns with the 38.2 fib-retracement area of the most recent intra-day bearish swing. There is potential for further northward market engineering to retest at least the 146.930 area, which aligns with the 61.8 fib retracement.
The USDJPY price action on the H4 time frame turned sideways at the 144.830 area afer a bullish retest of the area. The area aligns with the 38.2 fib-retracement area of the most recent intra-day bearish swing. The intra-day technical impulse favours further northward market engineering.
I may be wrong. Trade safe and prosper.
Trap
EURUSD Weekly Technical Outlook
The EURUSD market operation on the weekly time frame is sideways within the 1.13040/1.14795 horizontal resistance zone (purple). Three weeks ago, there was a bullish retest of the zone after a bearish breakdown that happened five weeks ago. The last two weeks saw limited directional movement within the zone.
The EURUSD price action on the daily time frame is sideways within the 1.13040/1.14795 horizontal resistance zone (purple). Although the technical structure on the weekly time frame is bearish, I will await a strong directional change on a daily closing basis in the early part of this week.
The EURUSD price action on the H4 time frame went sideways at the 1.13940 intra-day horizontal support. The area aligns with the lower trendline of the rising channel (magenta) within which the price action has been consolidating recently. Recent technical prints favour further southward movement.
I may be wrong. Trade safe and prosper.
Trap
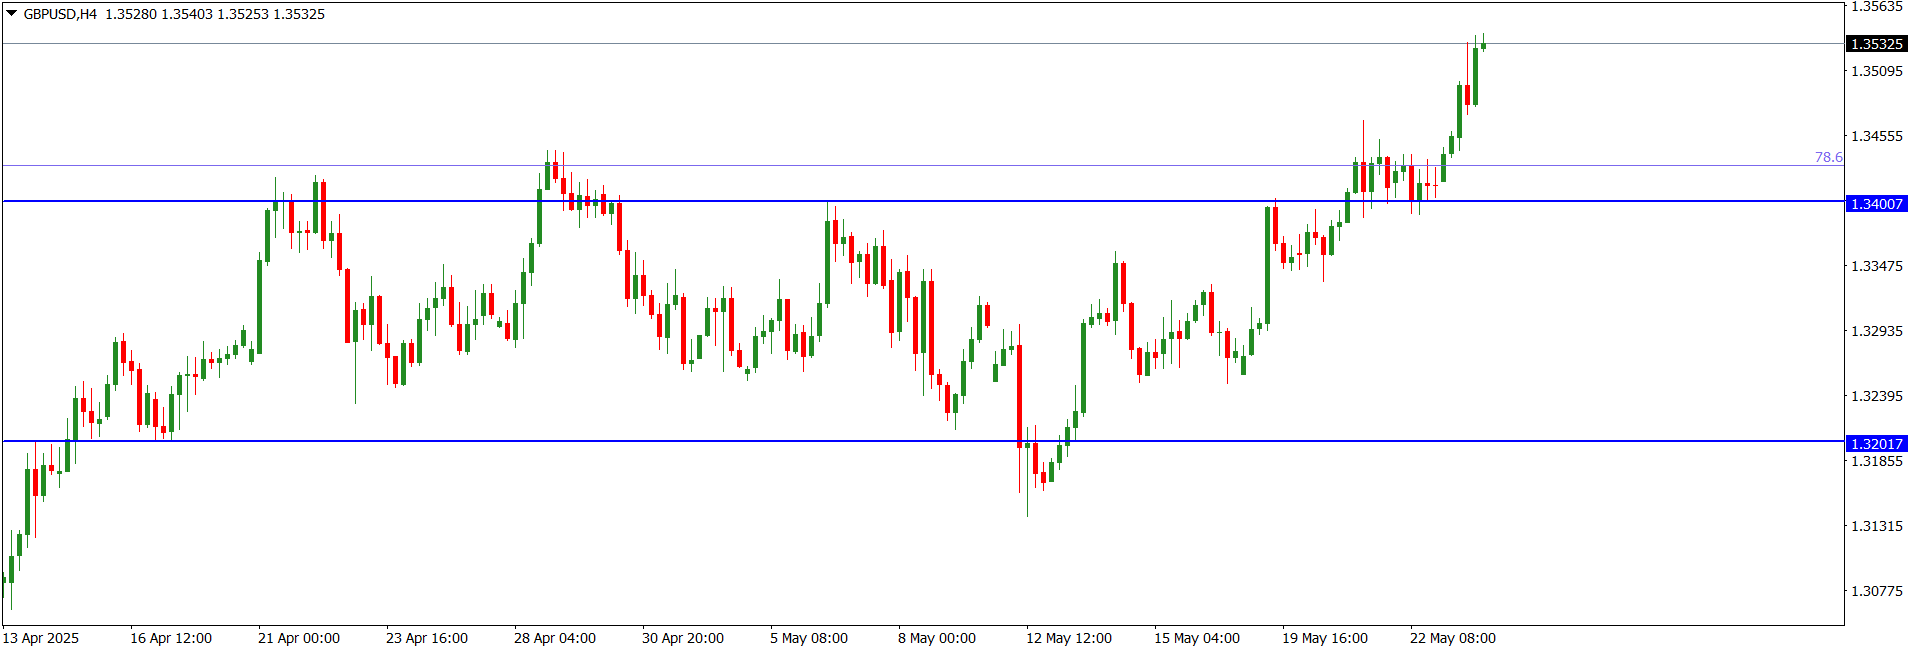
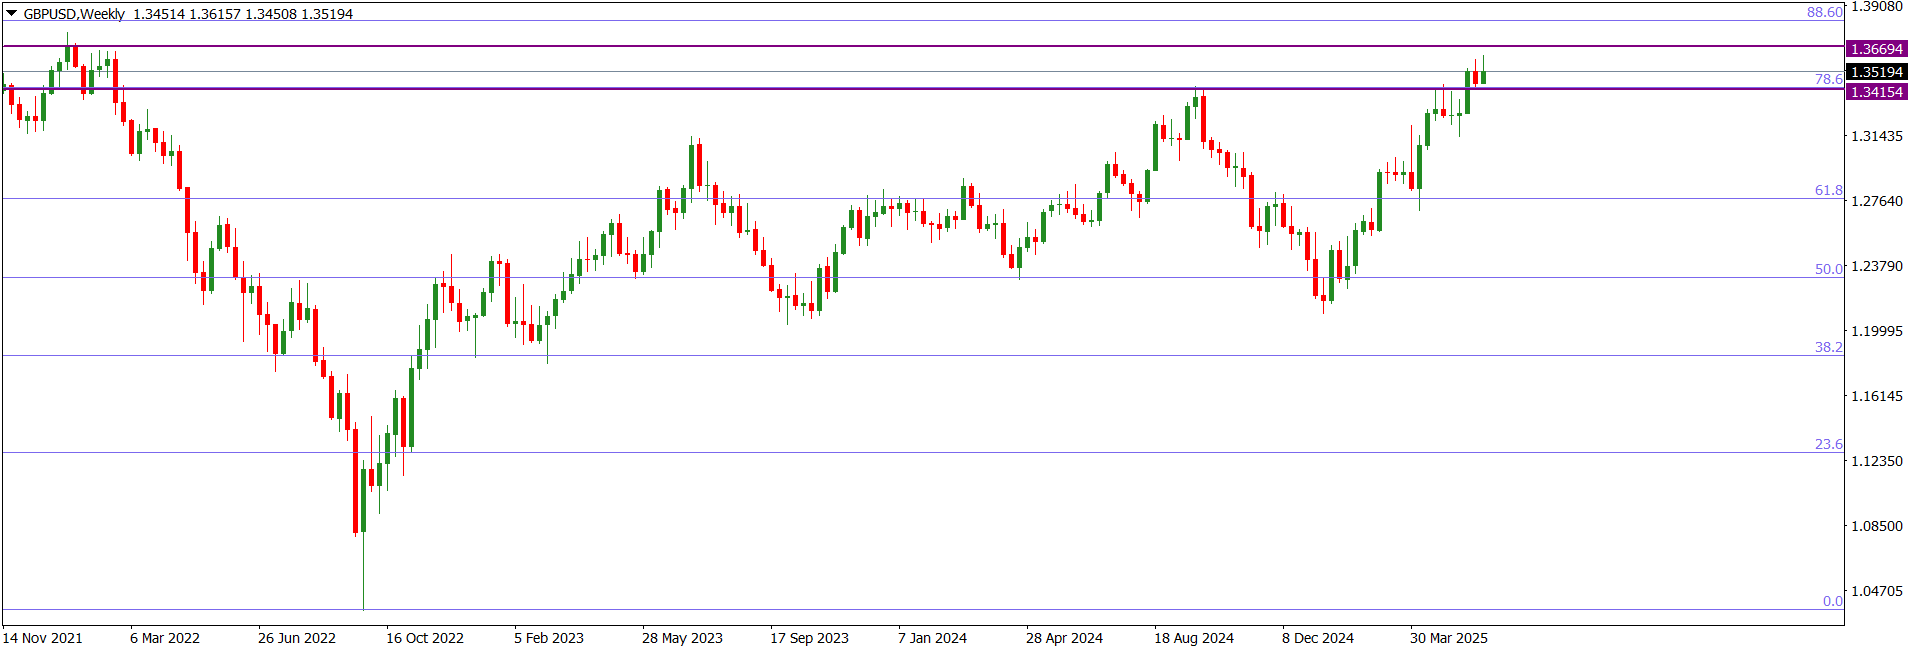
GBPUSD Weekly Technical Outlook
The GBPUSD market operation on the weekly time frame went sideways after a bullish retest of the 1.34154/1.36694 horizontal resistance zone (purple). Presently, market operation is located near the 78.6 fib-retracement zone of the bearish swing traceable to May 2021.
The GBPUSD price action on the daily time frame is sideways within the 1.34154/1.36694 horizontal resistance zone (purple). Although the dominant technical structure is bearish, I will await a strong directional change on a daily closing basis.
The GBPUSD price action on the H4 time frame went sideways at the 1.35194 intra-day horizontal support. The area aligns with the lower trendline of the rising channel (magenta) within which the price action has been consolidating recently. A strong breakdown of the channel may see further southward drive.
I may be wrong. Trade safe and prosper.
Trap
XAUUSD Weekly Technical Outlook
The XAUUSD market operation on the weekly time frame is bullish. Last week, market operation printed a relatively big bullish candlestick that broke above the area of consolidation that has been in place for nine weeks.
The XAUUSD price action on the daily time is bullish. However, the bullish candlestick printed on Friday is located at the 3432.37 horizontal resistance. Technically, we see a bearish challenge in the area. But the liquidity above the area may incentivize northward market engineering before a bearish correction.
Although at present the XAUUSD price action on the H4 time frame is sideways, the technical impulse is bullish. And we may see further northward market engineering.
I may be wrong. Trade safe and prosper.
Trap
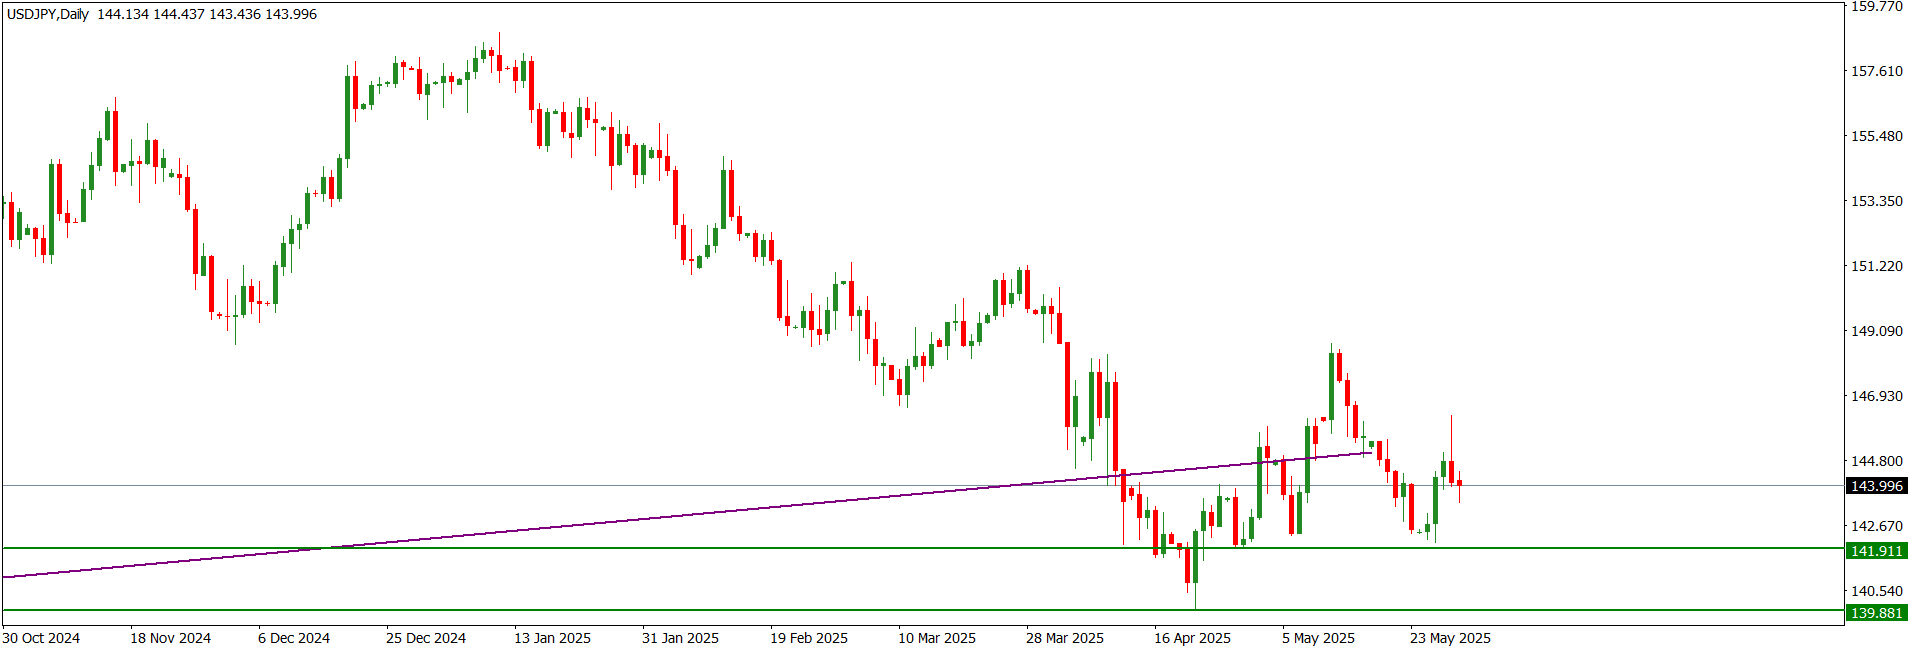
USDJPY Weekly Technical Outlook
The USDJPY market operation on the weekly time frame is sideways. Two weeks ago, the market operation retested the lower trendline of the rising channel (purple) which was broken down four weeks ago. But there was a feeble bearish challenge to the bullish move last week. Recent candlestick prints are respecting a rising trendline (magenta) below the channel (purple).
The USDJPY price action on the daily time frame is sideways at the 144.070 intra-day horizontal resistance. Technically, there is no directional clarity.
The USDJPY price action on the H4 time is sideways. Recent candlestick prints show a market with no directional clarity.
I may be wrong. Trade safe and prosper.
Trap
EURUSD Weekly Technical Outlook
Last week, the EURUSD market operation on the weekly time frame printed a bullish candlestick that retested the 1.15450 horizontal resistance area. However, after the candlestick broke above the area, it closed within it, leaving a prominent upper wick.
The EURUSD price action on the daily time frame went sideways on Friday after a bullish break above the 1.15450 horizontal resistance on Thursday. The prominent tail on the bearish candlestick printed on Friday indicates that bulls are still influential in the market.
The EURUSD price action on the H4 time frame is presently sideways at the 1.15450 horizontal resistance. Recent technical prints favour a northward market engineering.
I may be wrong. Trade safe and prosper.
Trap
GBPUSD Weekly Technical Outlook
Last week, the GBPUSD market operation on the weekly time frame printed an indecision candlestick at the 1.35670 horizontal resistance area. This represents a decline in bullish momentum.
The GBPUSD price action on the daily time frame went sideways on Friday after a bullish break above the 1.35670 horizontal resistance on Thursday. The prominent tail on the bearish candlestick printed on Friday indicates that bulls are still influential in the market.
The GBPUSD price action on the H4 time frame is presently sideways at the 1.35670 horizontal resistance. Technically, the market lacks directional momentum.
I may be wrong. Trade safe and prosper.
Trap