EURUSD Top Down Analysis

Precious Metals Advance as FX Tracks Hormuz (08.11.2026)

Gold climbed above $4,400, reaching a two-month high as Chinese demand strengthened. Gold-backed ETFs recorded their longest inflow streak in months, while the PBOC added around 20 tons to reserves in July, its largest monthly purchase since October 2023.

Chinese inflation slowed to 0.5% in July, while producer price growth eased to 3.5%, pointing to weak domestic demand. Beijing responded with plans for faster fiscal spending and bond issuance, alongside further support for equipment upgrades and consumer trade-ins.

Oil stayed firm as uncertainty over reopening the Strait of Hormuz persisted, with Brent above $84 for a third session. Iran reported progress in talks with Oman but said reopening would take time, while fresh attacks on regional energy infrastructure kept supply risks in focus.

​Economic Calendar

Time Cur. Event Forecast Previous
17:00 USD Existing Home Sales (Jul) 4.05M 4.09M

Euro Holds Near Key Averages

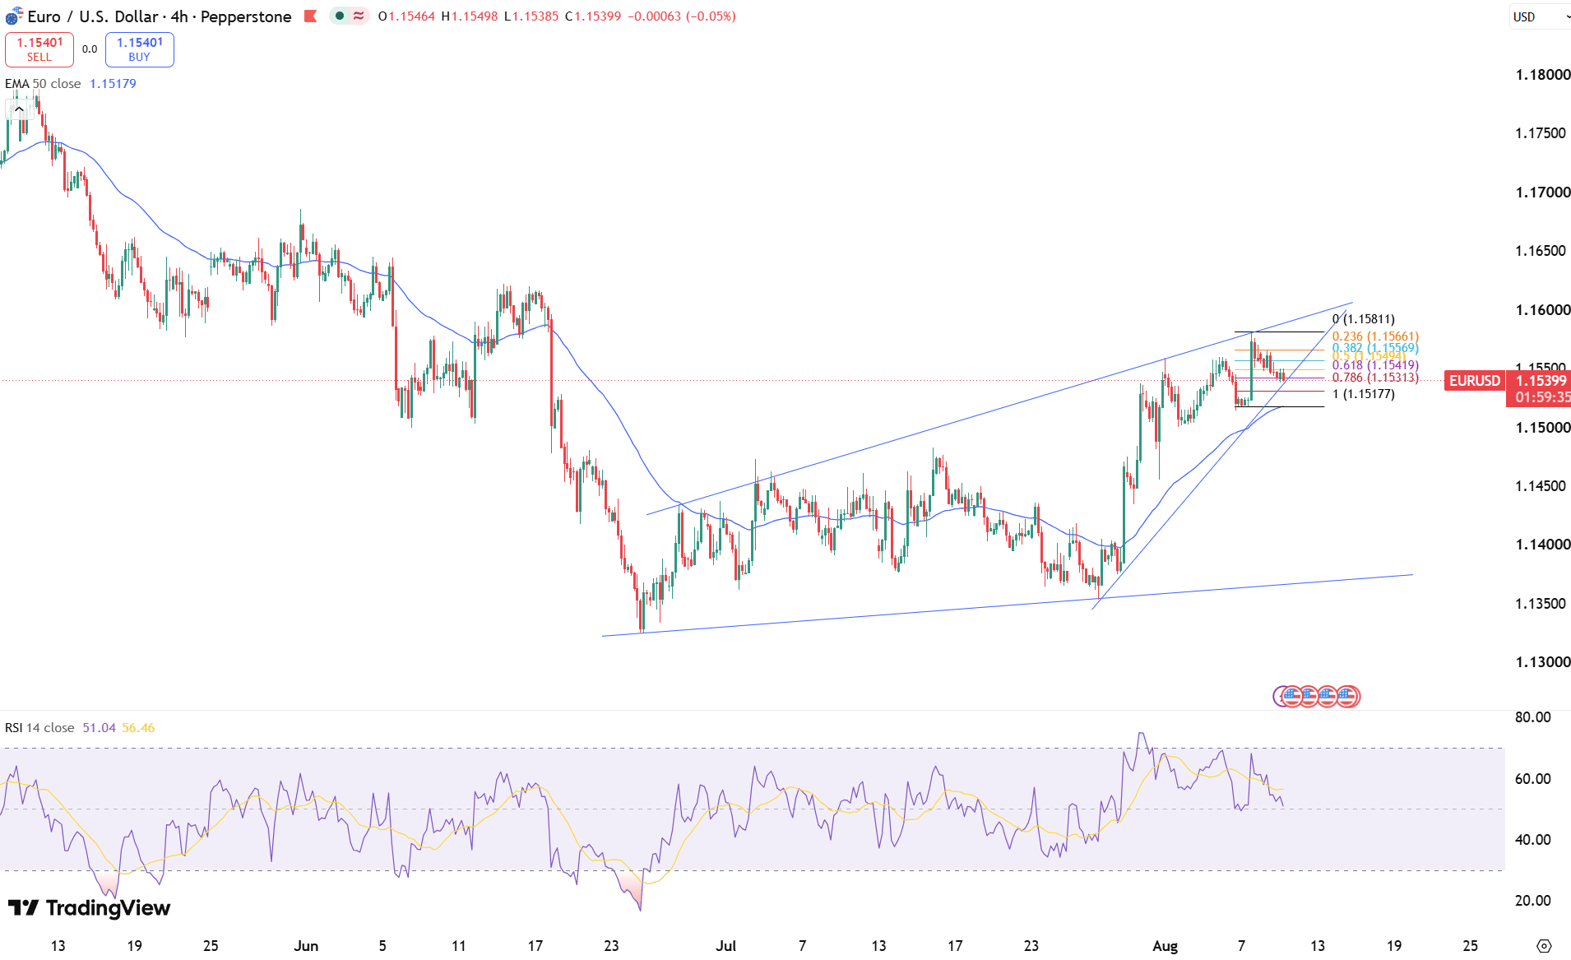
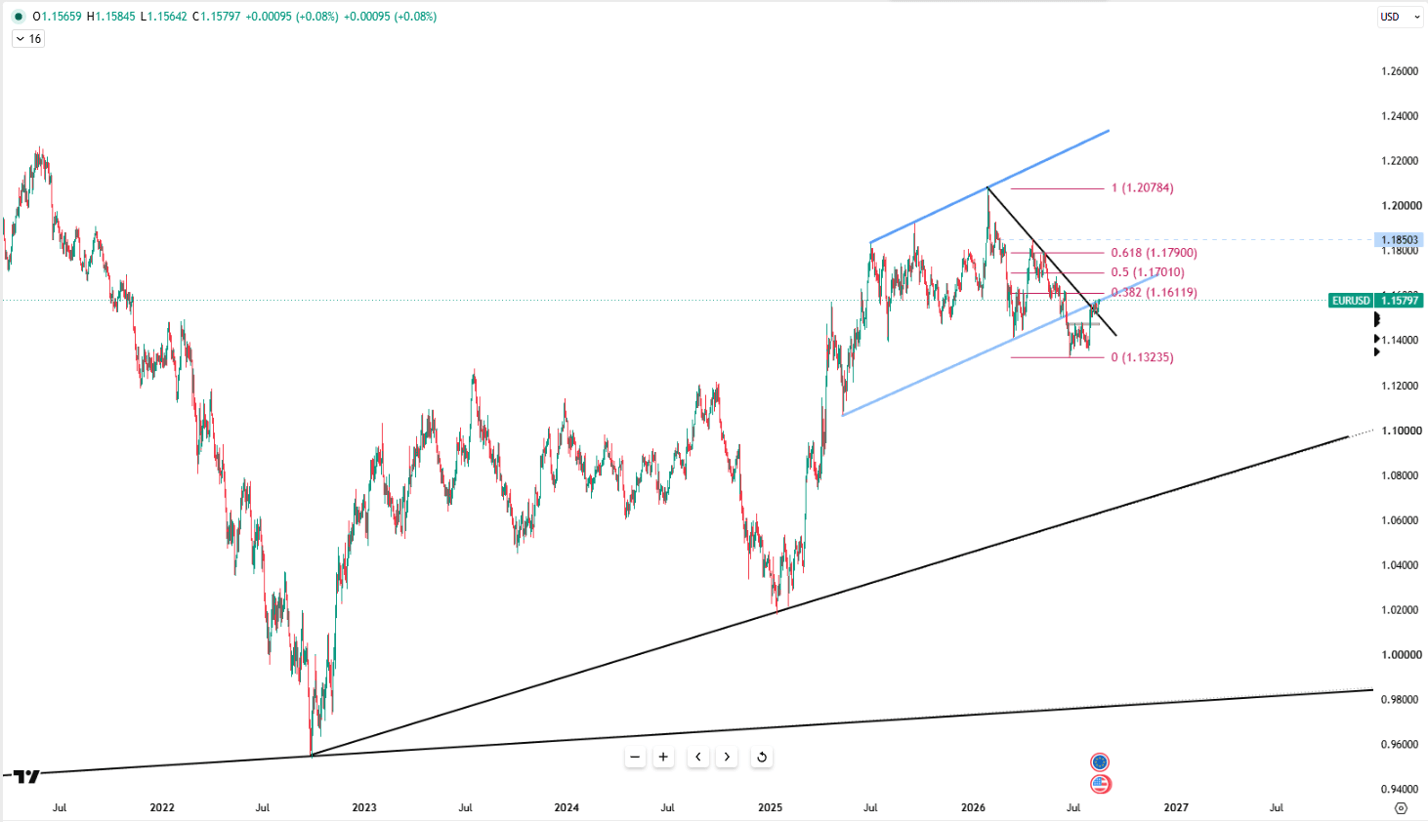
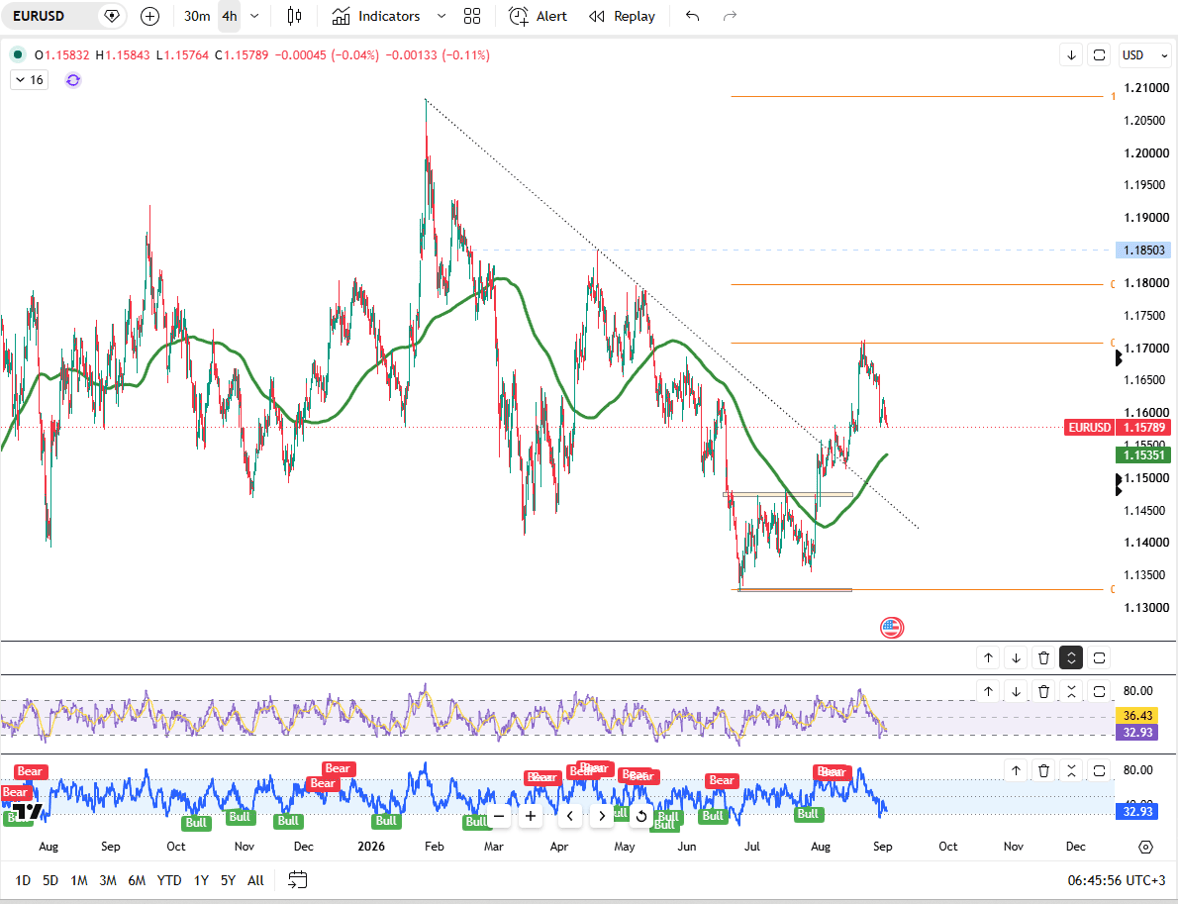
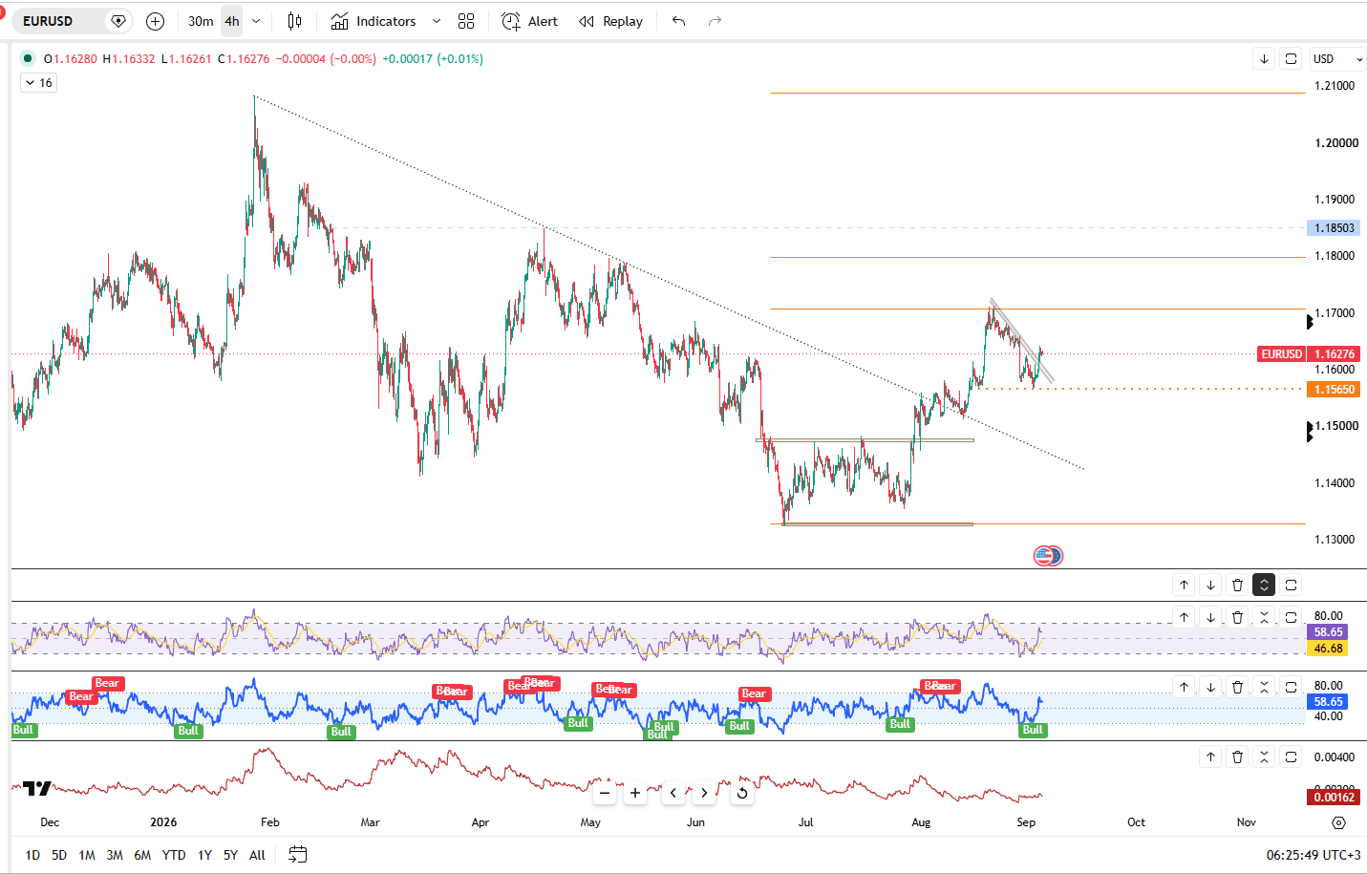
EUR/USD remains pressured near its 100-day moving average despite rebounding past the 50-day level. Strong technical indicators maintain a constructive outlook, where a decisive move above 1.1600 could pave the way toward 1.1700 and the 200-day average.

Markets are weighing conflicting reports regarding the Strait of Hormuz. Iranian officials indicated a shipping agreement with Oman is approaching, though immediate reopening remains unlikely. Meanwhile, improving Eurozone growth expectations provide underlying currency support.

The first resistance is positioned at 1.1570 while the support starts from 1.1500.

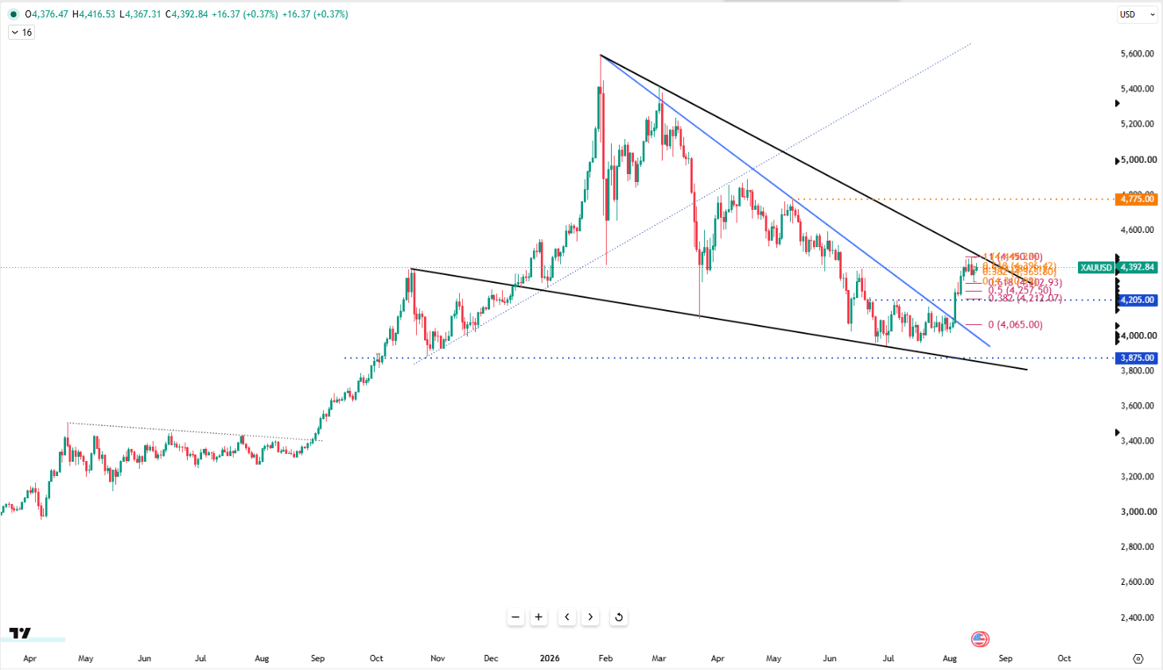
Gold Reaches Two-Month High
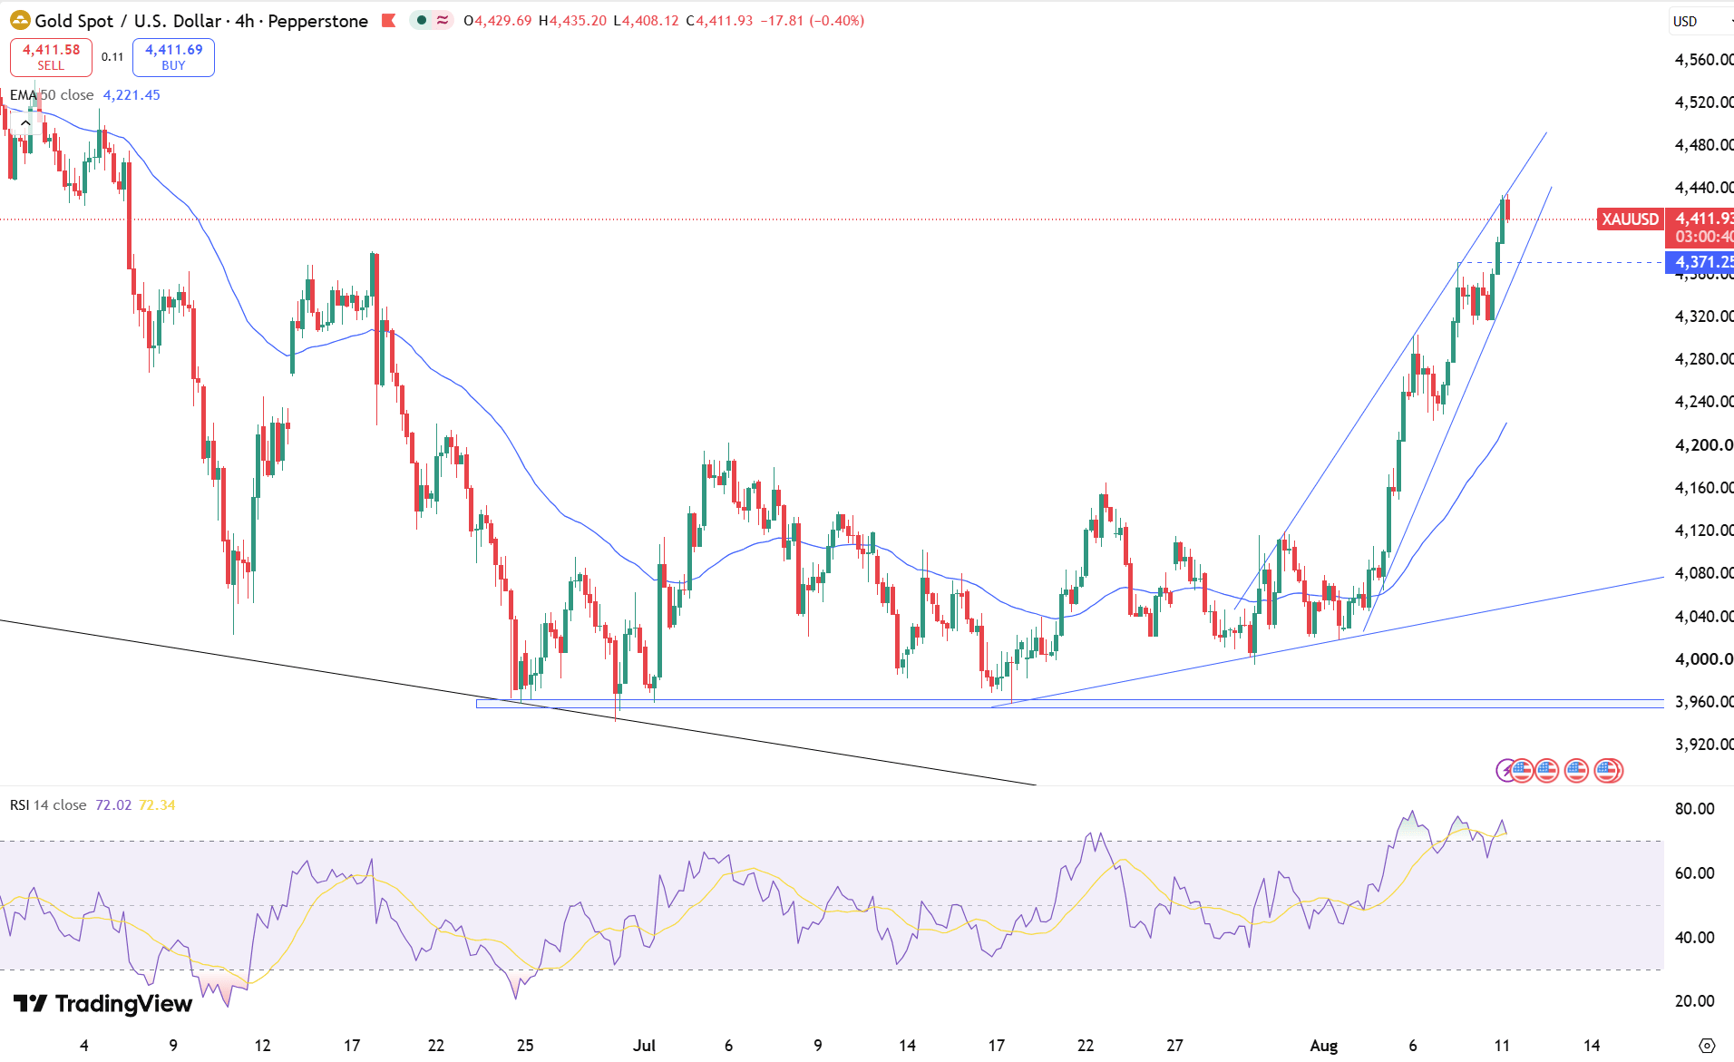
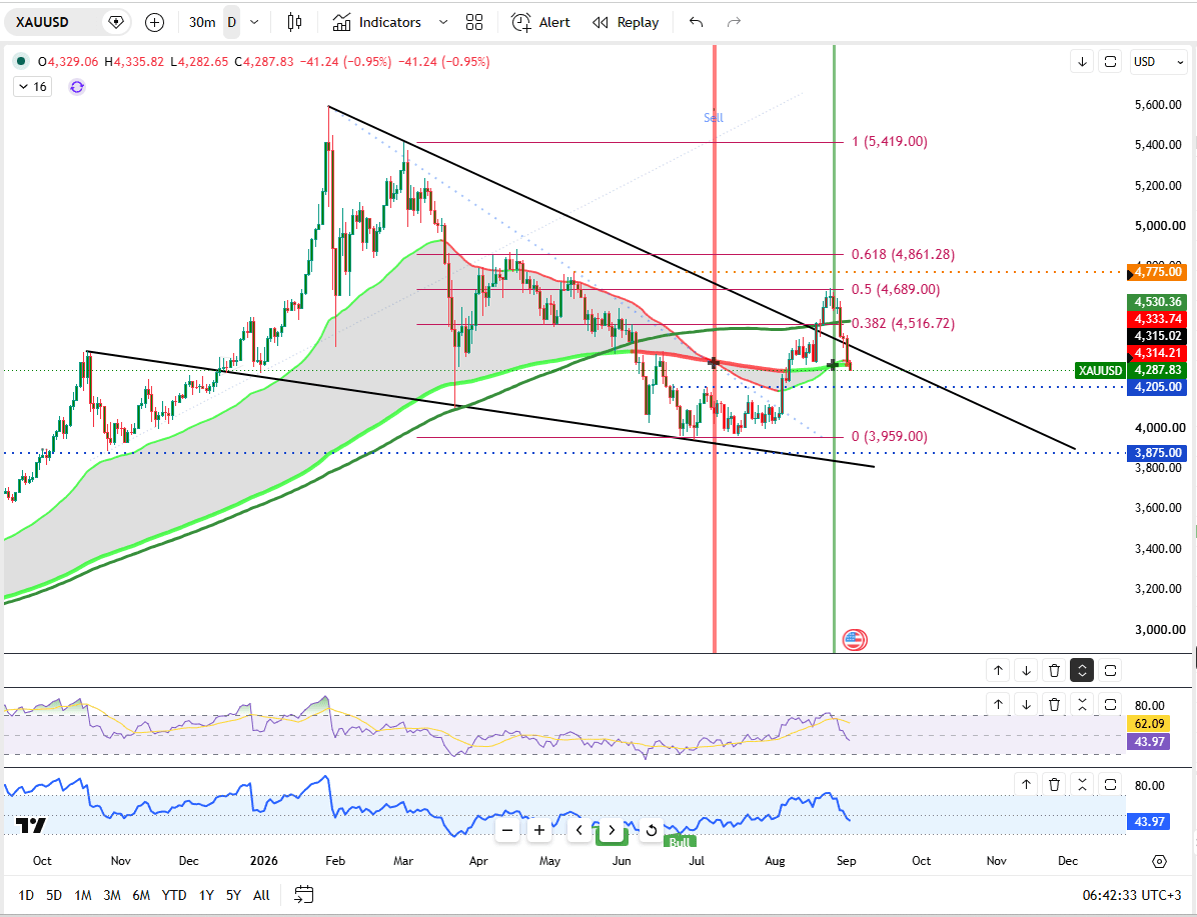
Gold climbed past $4,400 per ounce on Tuesday, touching a two-month peak as demand for safe-haven assets grew despite persistent inflation and interest rate anxieties stemming from elevated crude prices.

Chinese institutional buyers continued expanding positions to counter market volatility, driving ETF inflows to multi-month records. The People’s Bank of China accelerated its official accumulation, acquiring approximately 20 tons in July, its largest monthly increase since late 2023.

First resistance is seen at $4430, with initial support near $4440.

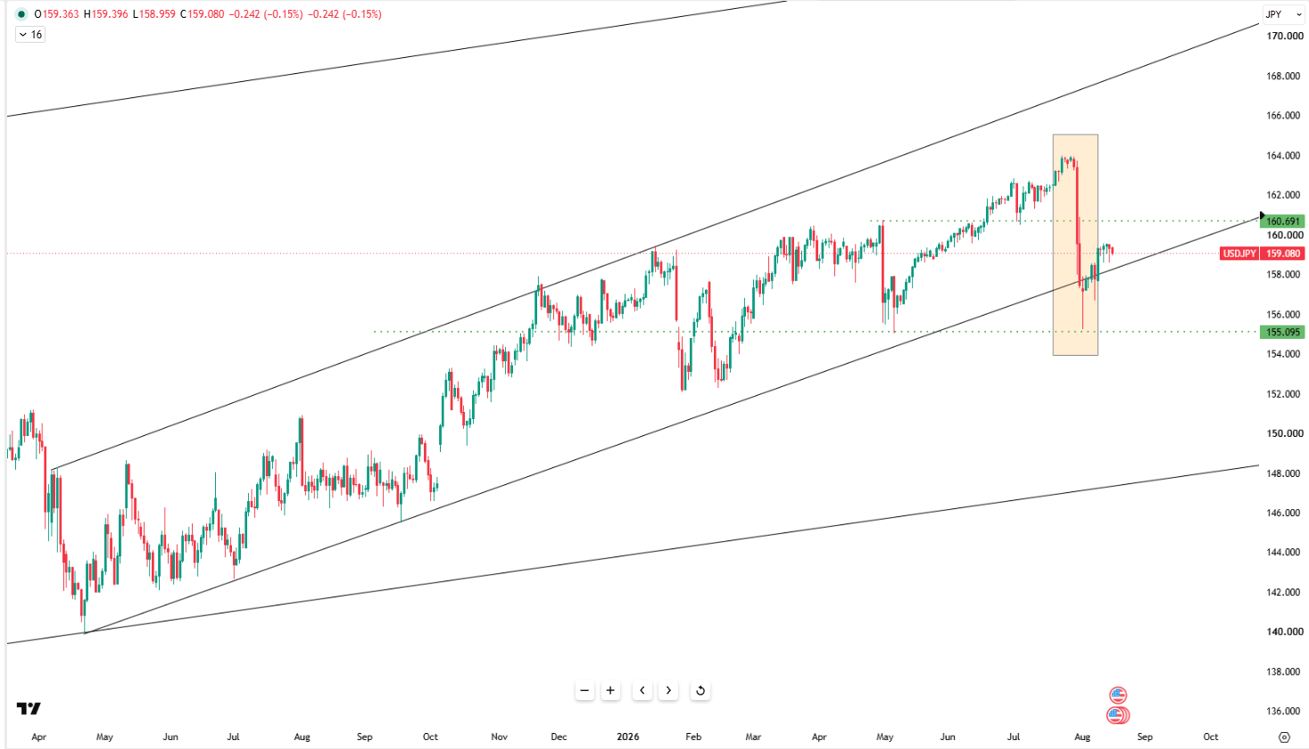
Yen Weakens Past 159
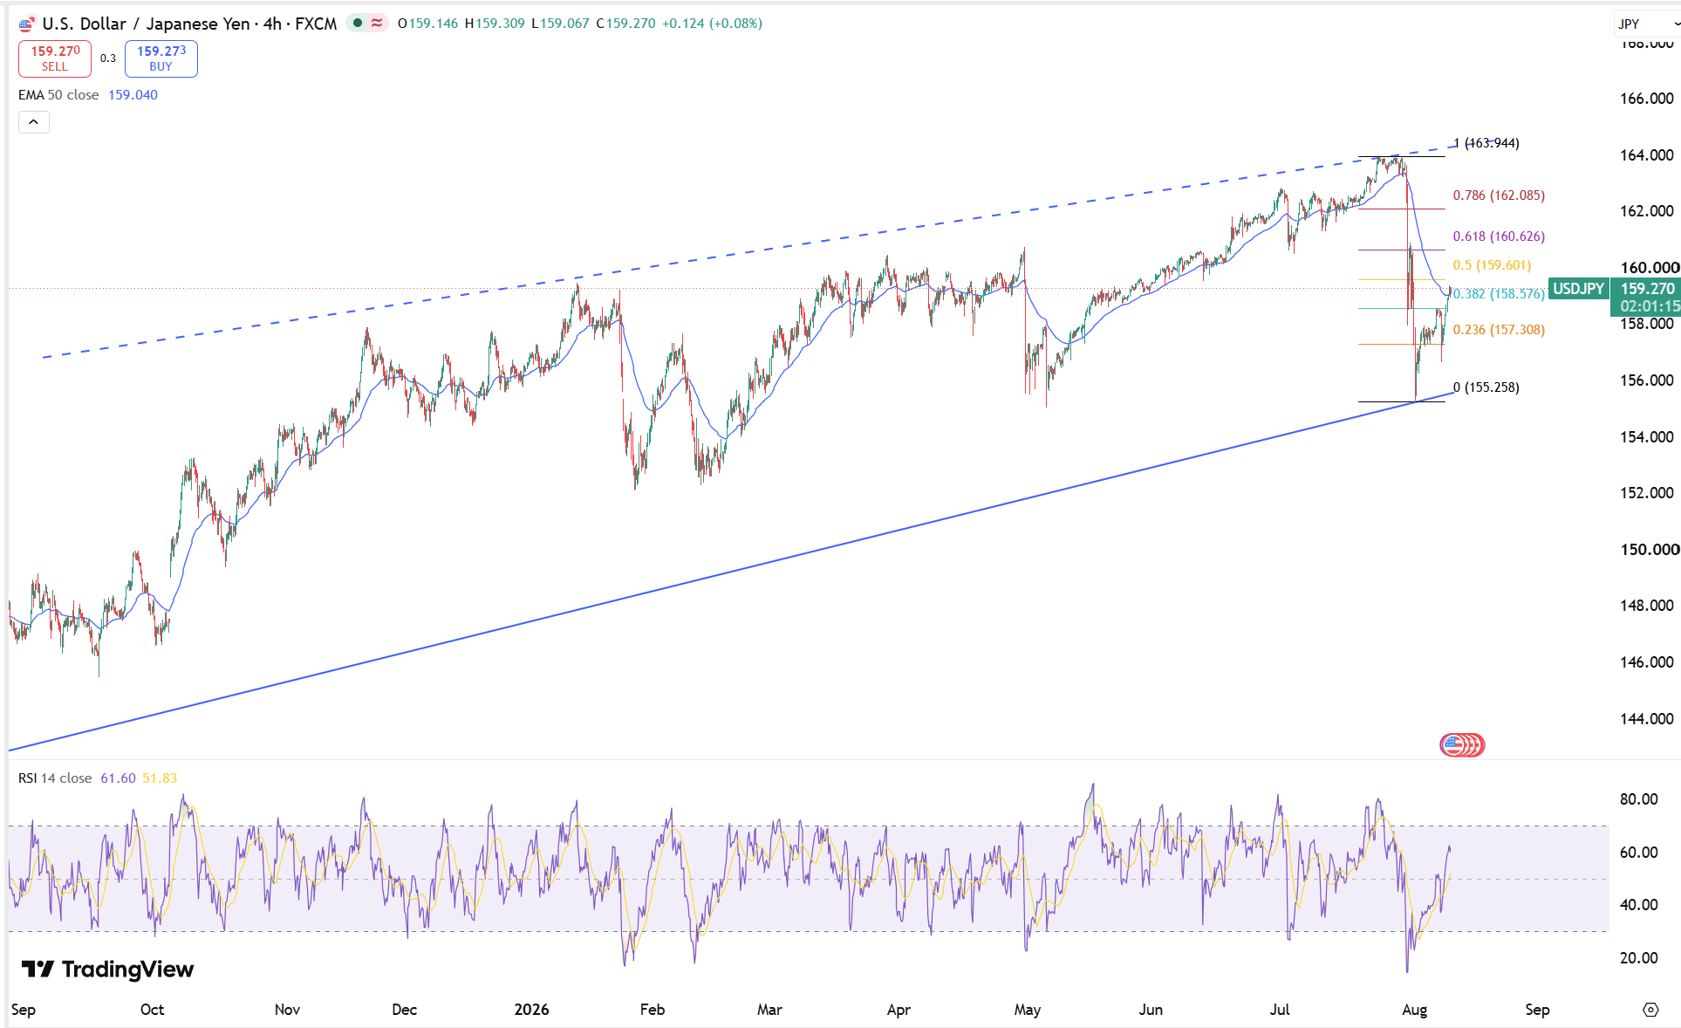
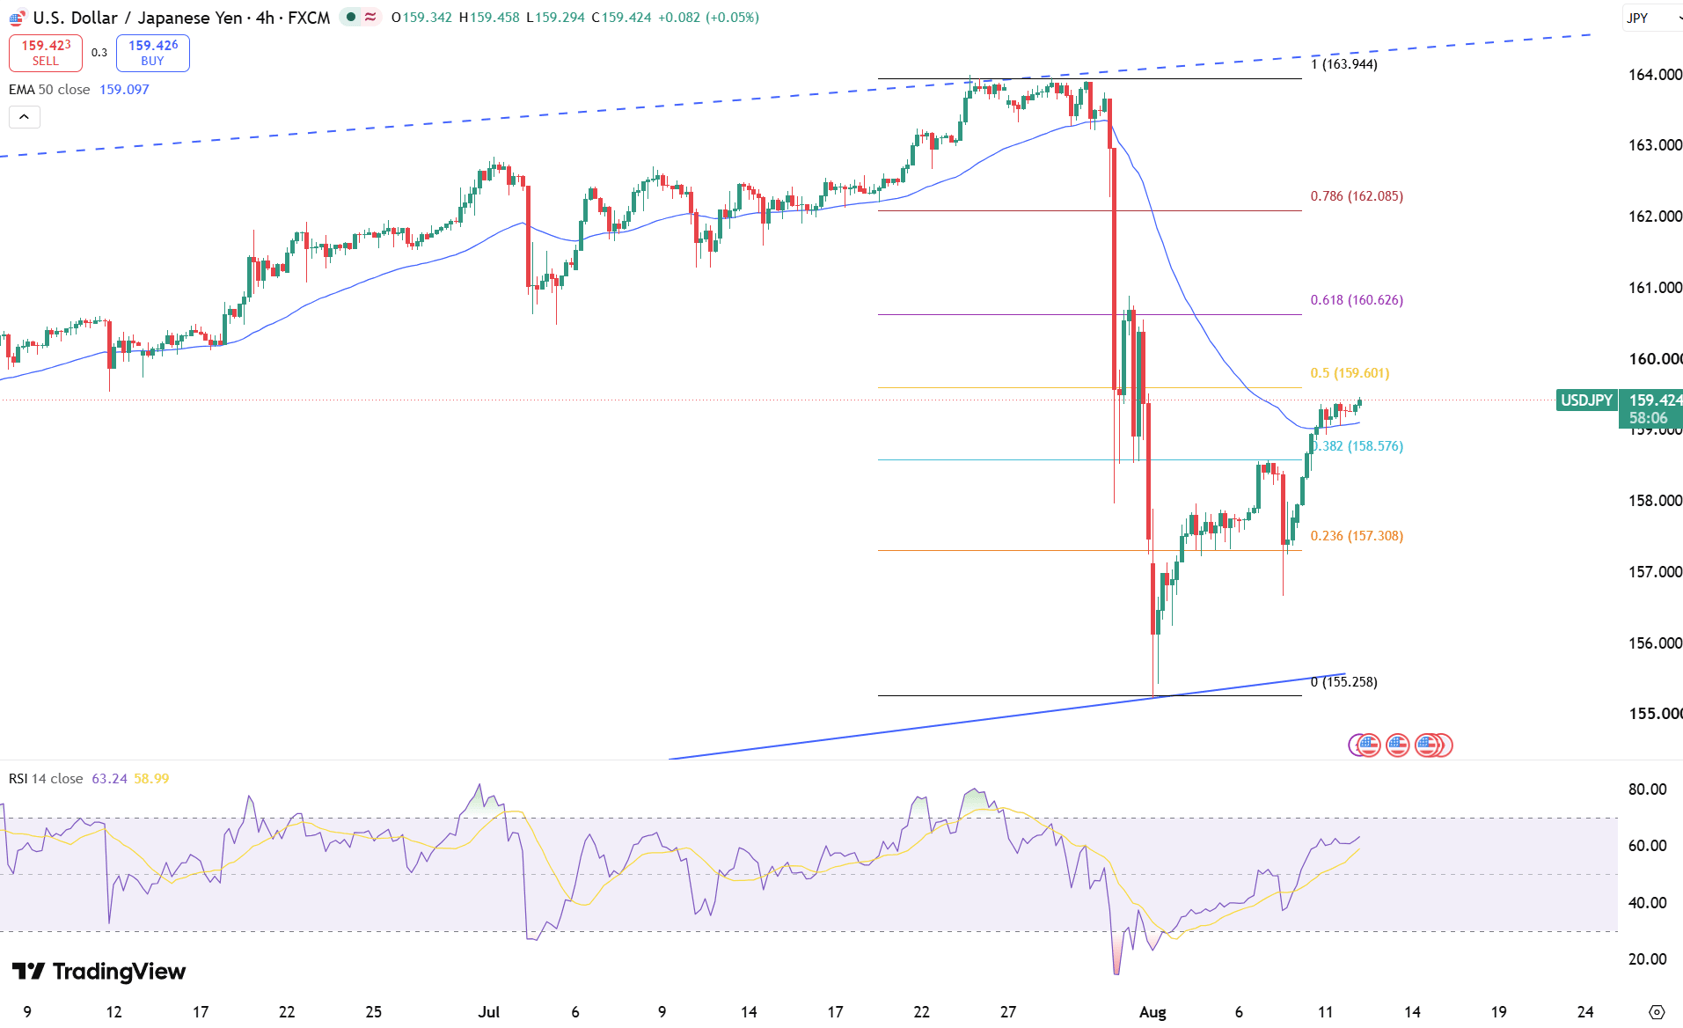
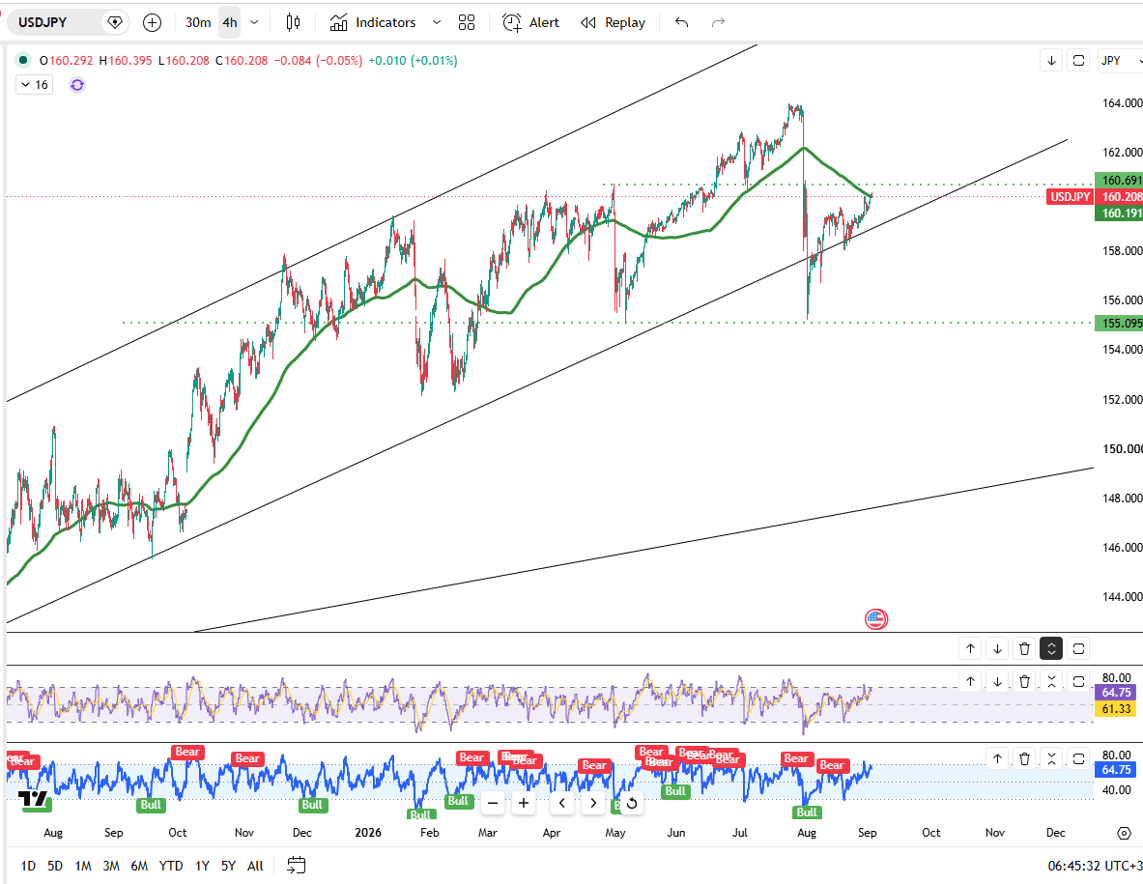
The Japanese yen dropped past 159 per dollar on Tuesday, erasing about half of its recent intervention-led recovery and testing official support limits. Tokyo and Washington previously executed a record joint yen-buying operation in late July after the currency touched 40-year lows, aiming to protect broader financial stability.

However, the lack of follow-up measures from central authorities has left investors disappointed, reigniting downward momentum.

First resistance is seen at 160.00, with initial support near 158.60.

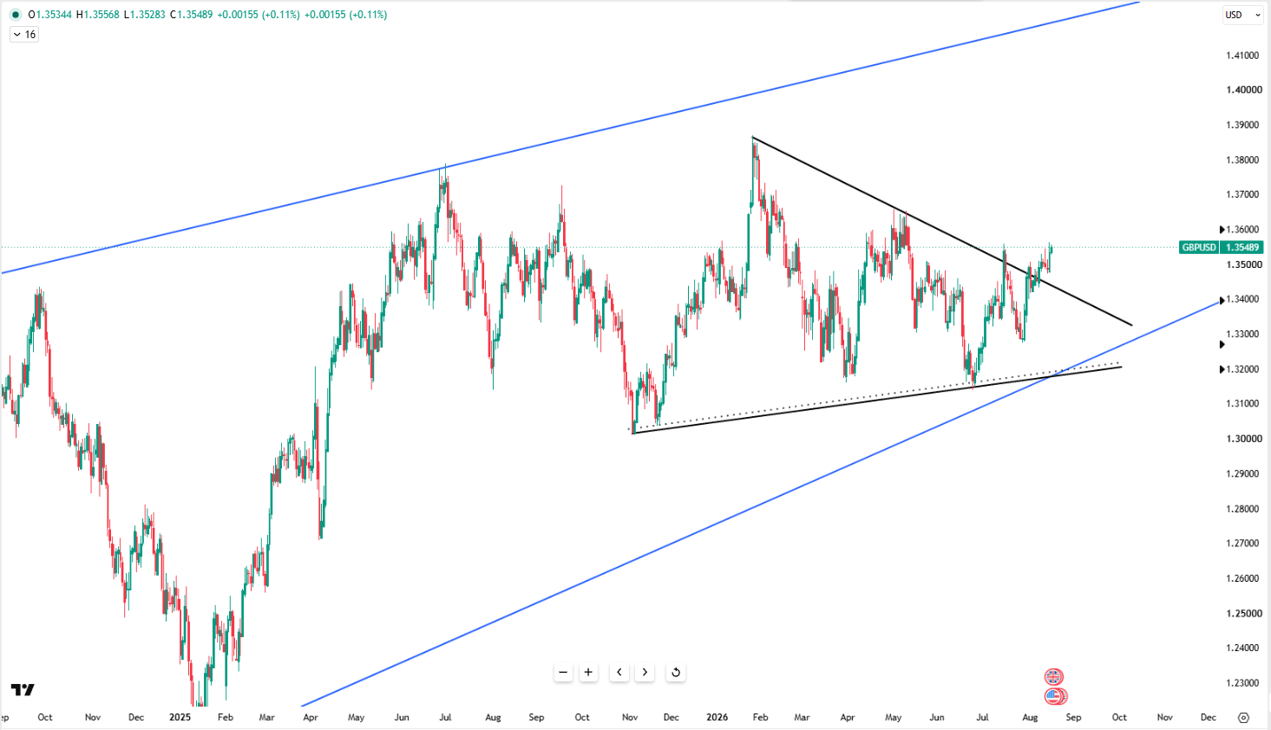
Sterling Consolidates Peak Levels
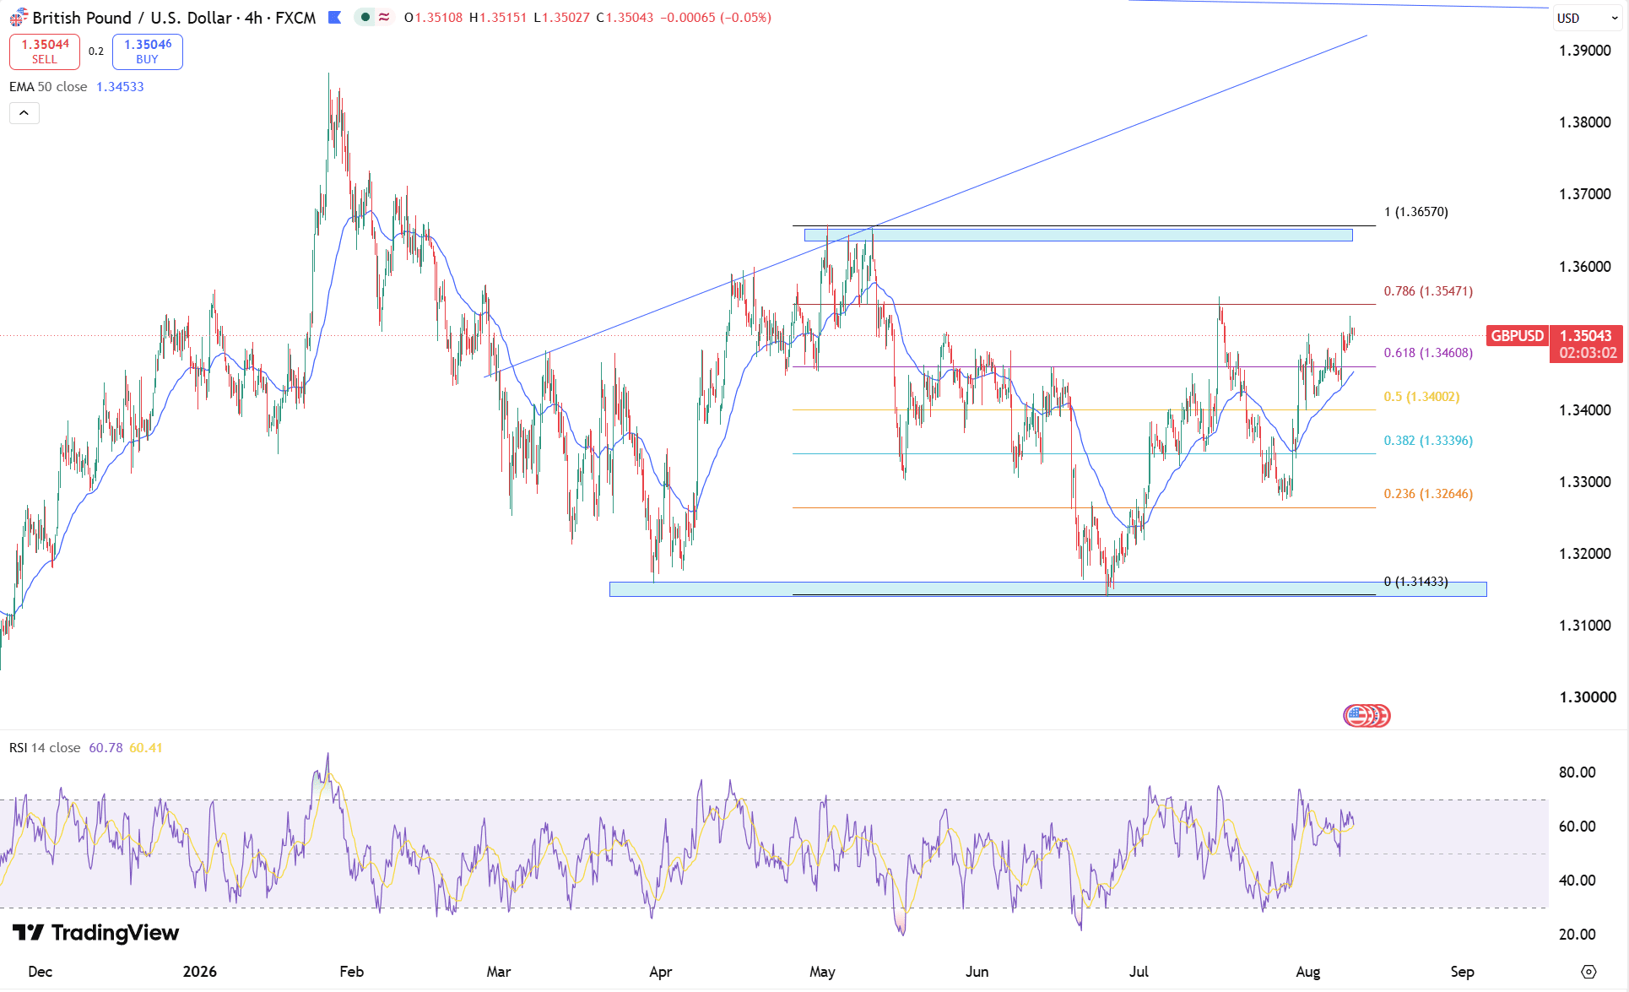
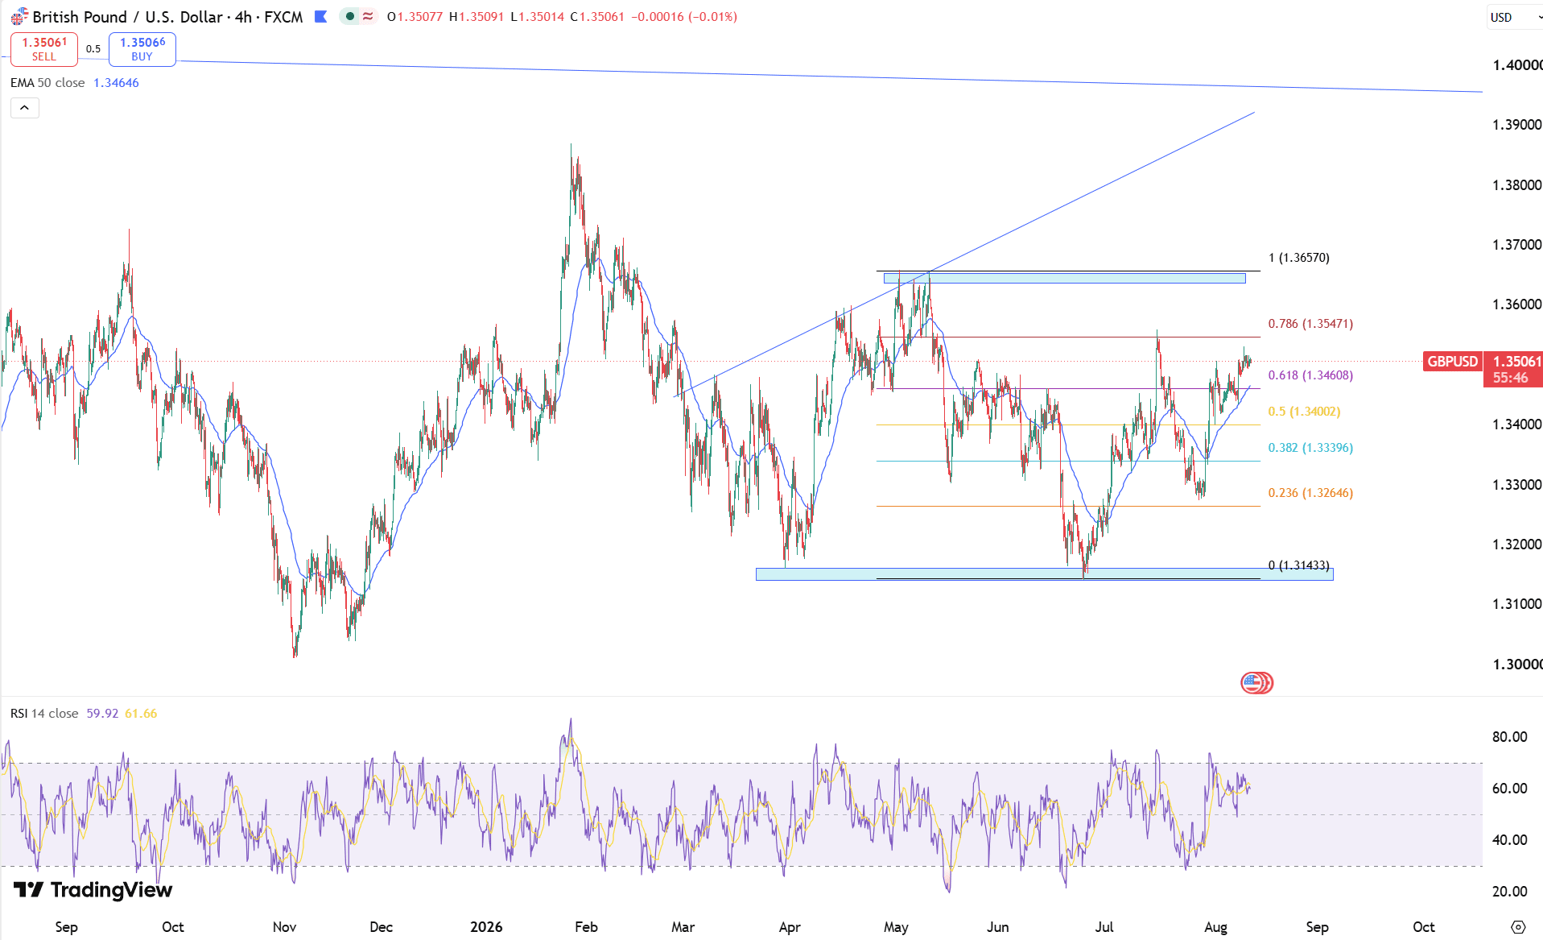
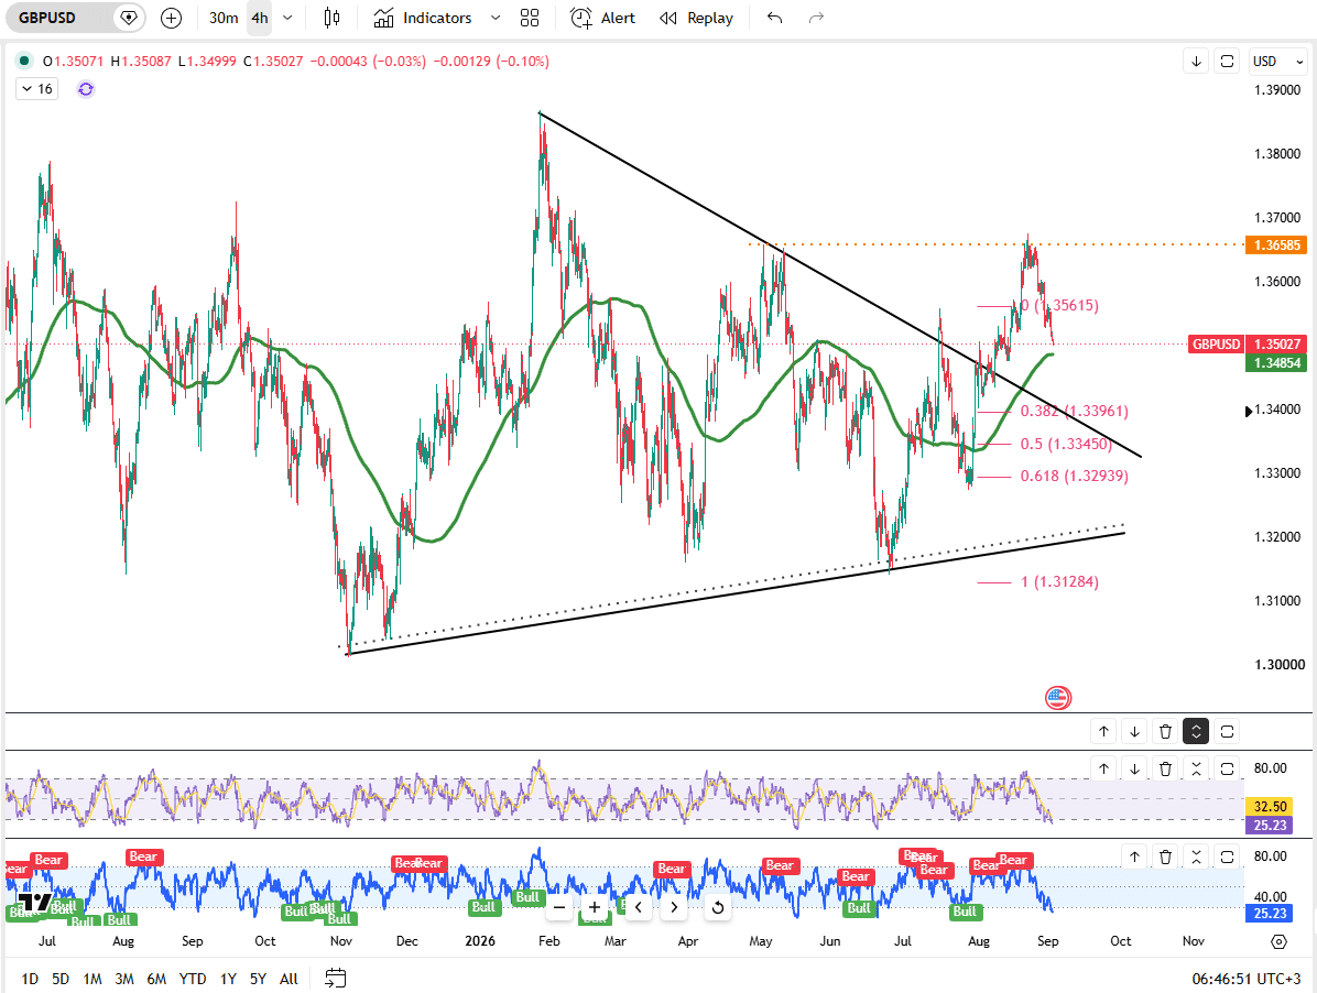
The British pound hovered near $1.349, remaining close to multi-week highs as investors digested conflicting updates on US-Iran talks and potential Strait of Hormuz developments. While Iranian officials signaled progress on a regional shipping framework, direct negotiations with Washington were dismissed.

Also, disappointing US employment data curbed Federal Reserve rate hike expectations, providing support for Sterling. Domestically, the Bank of England held interest rates steady while highlighting disinflation progress. UK employment indicators showed stabilizing permanent hires, rising temporary vacancies, and strong initial salary growth.

From a technical view, resistance stands near 1.3530, with support around 1.3400.

Silver Hits Seven-Week Peak
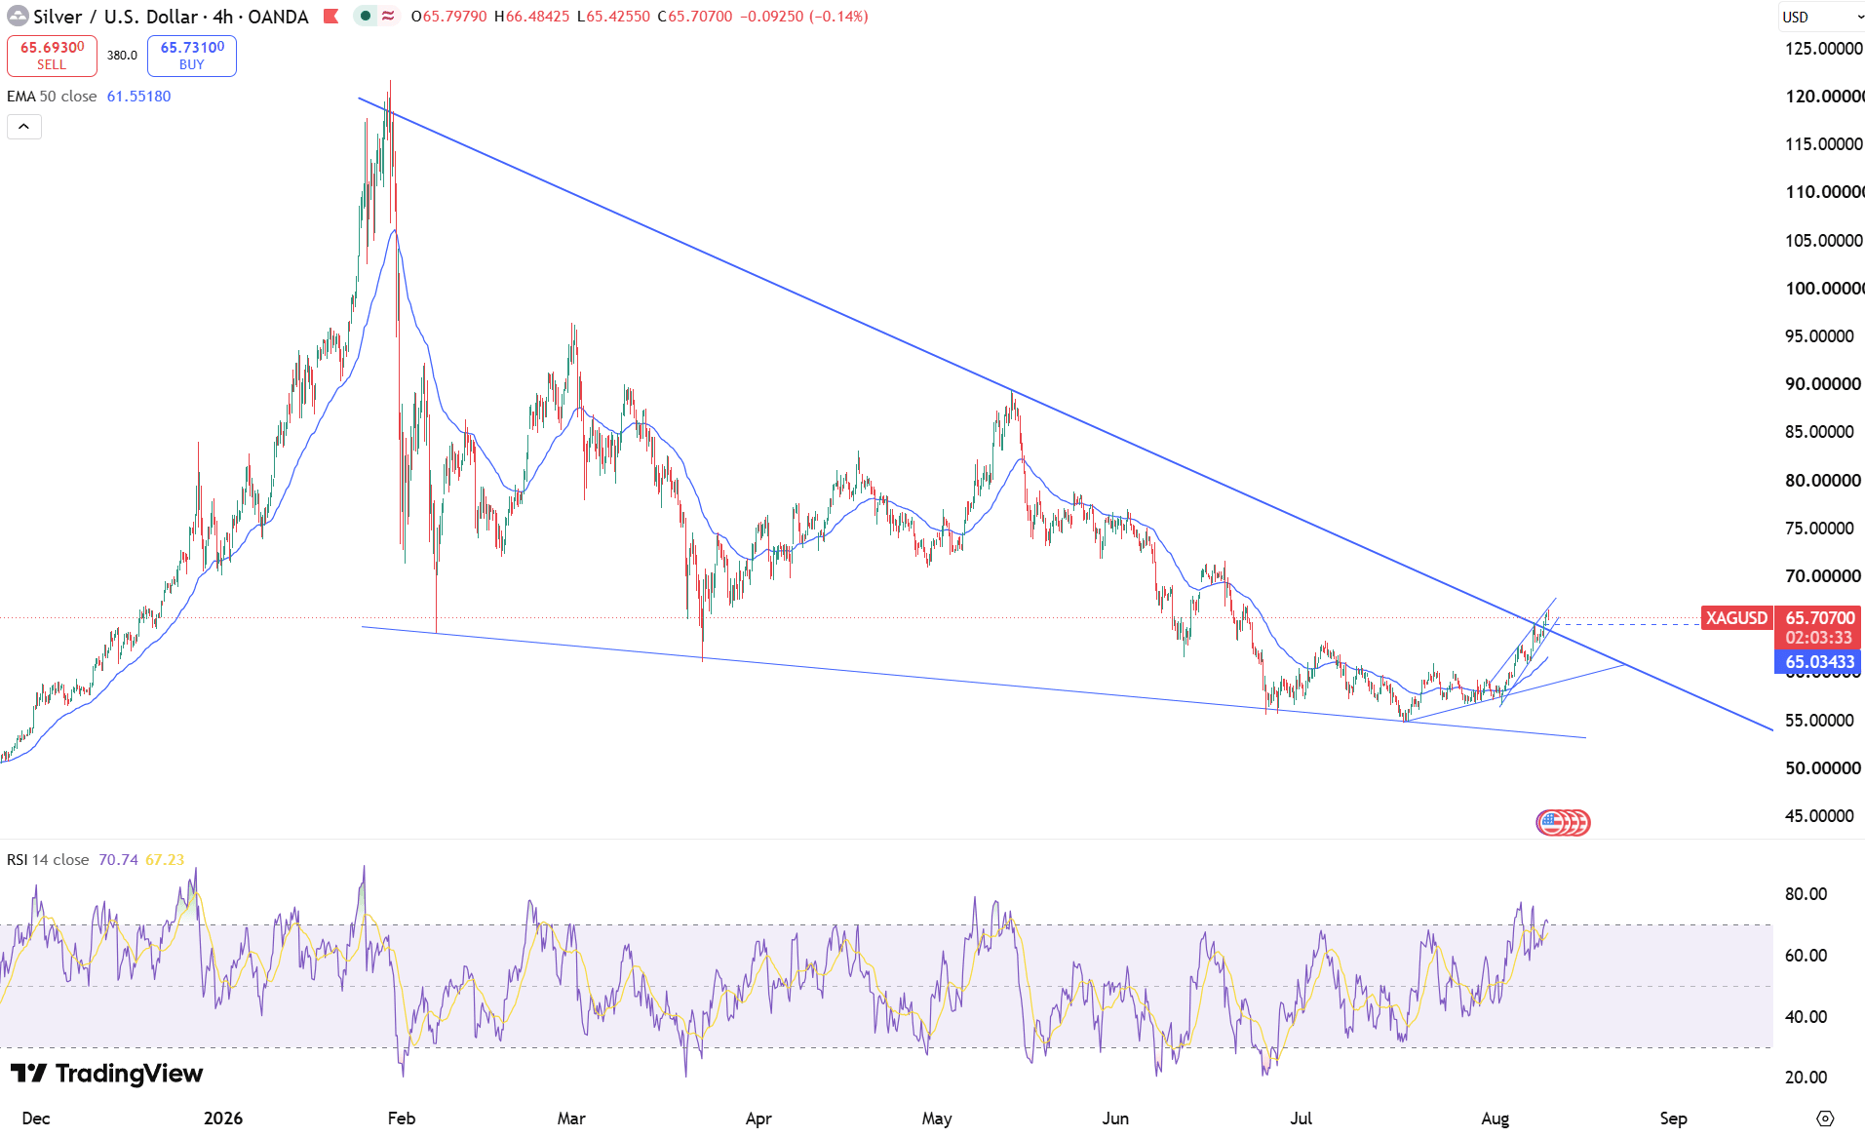
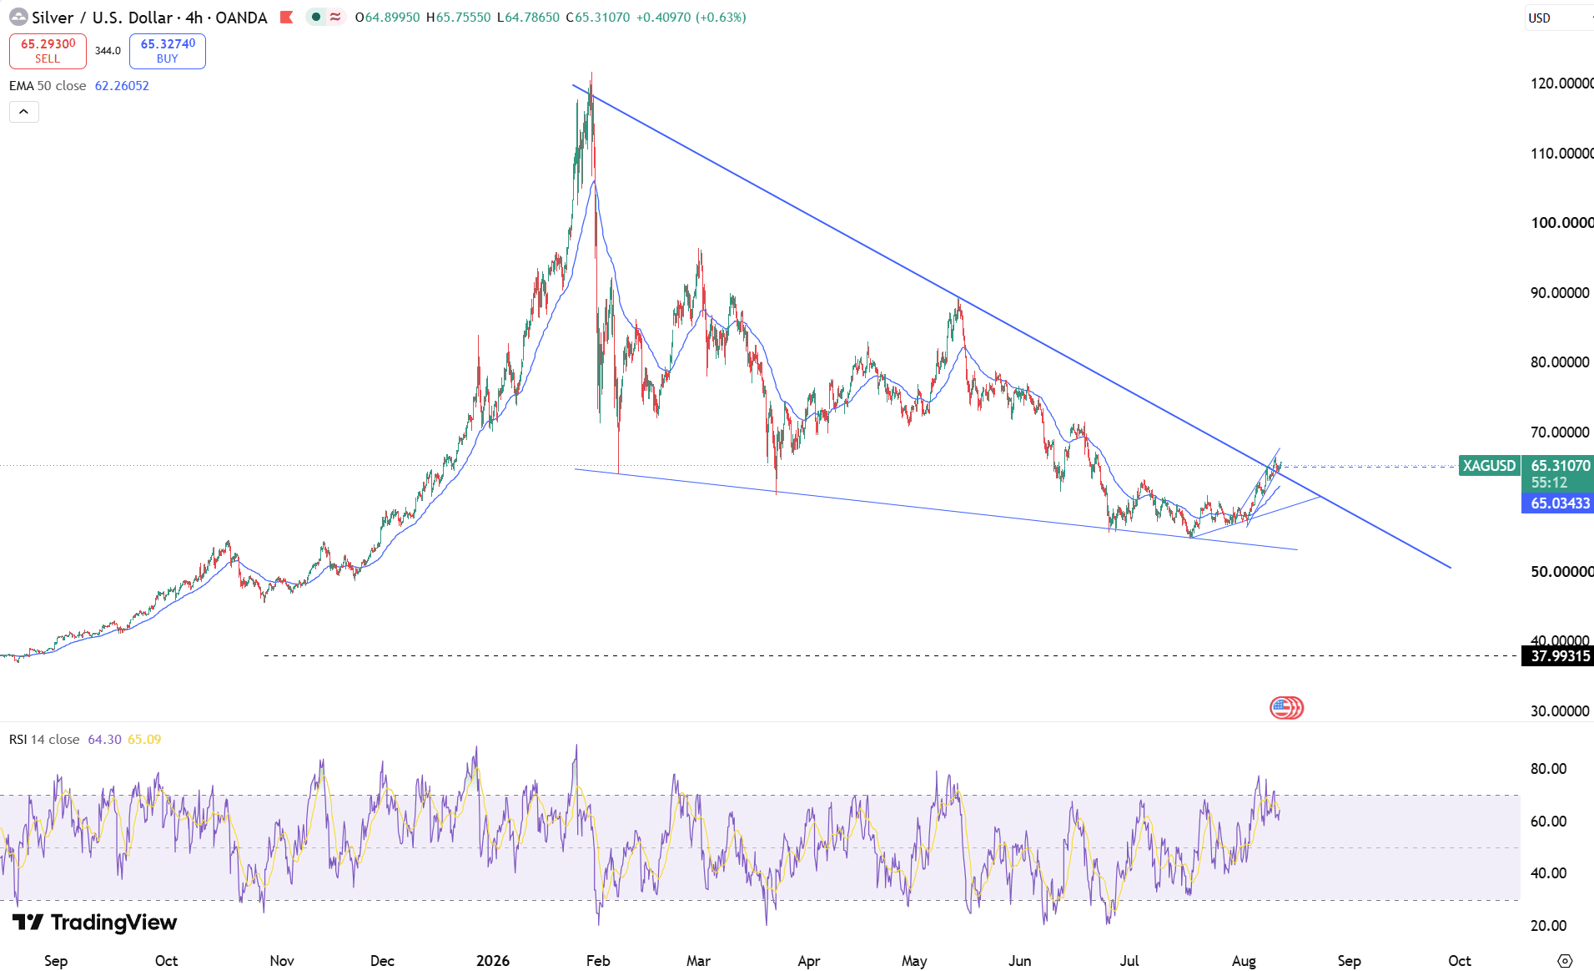
Silver rose toward $65.5 per ounce on Tuesday, touching a seven-week high as robust investment flows elevated precious metals despite energy-driven inflation and interest rate concerns. The metal gained additional momentum from strong industrial consumption within solar and power grid sectors.

Furthermore, Chinese silver ore imports surged 62.5% year-over-year in June, illustrating substantial physical demand.

From a technical view, resistance stands near $65.80, while support is located around $65.00.

Bitcoin (BTC/USD)
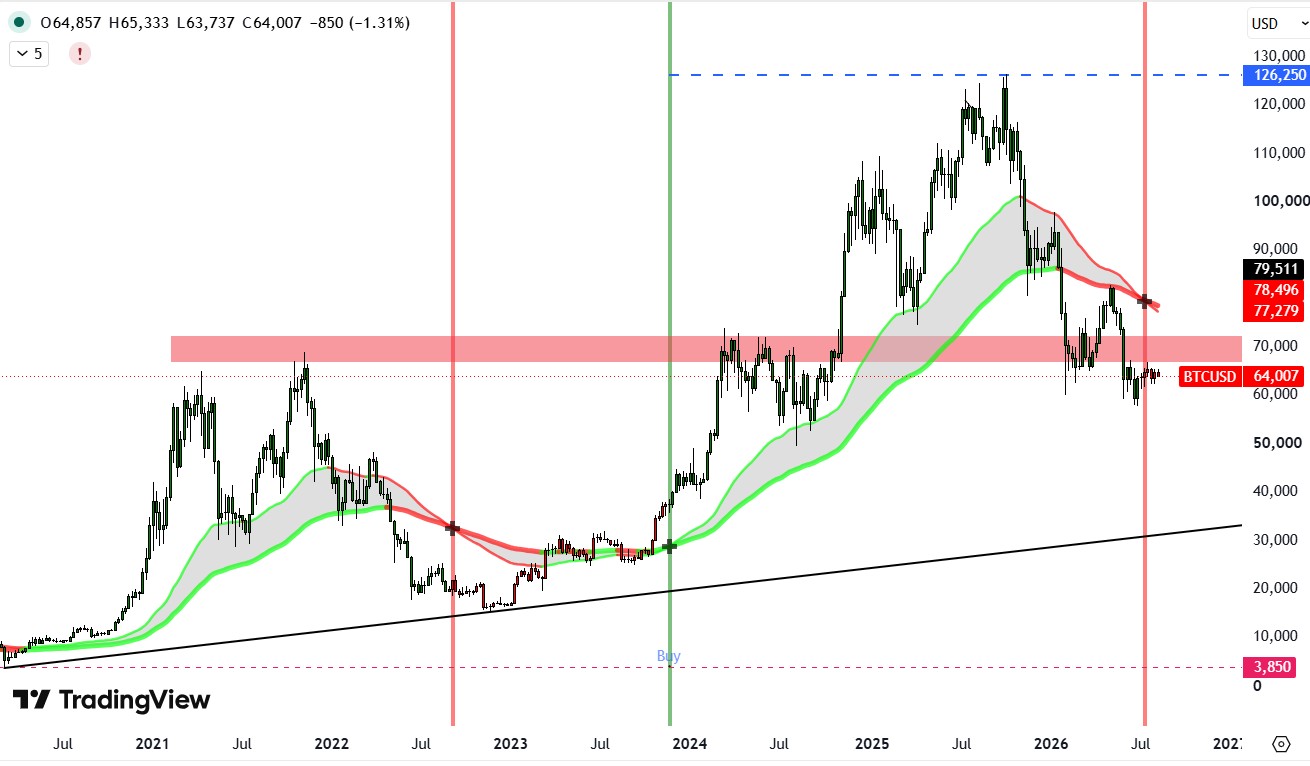
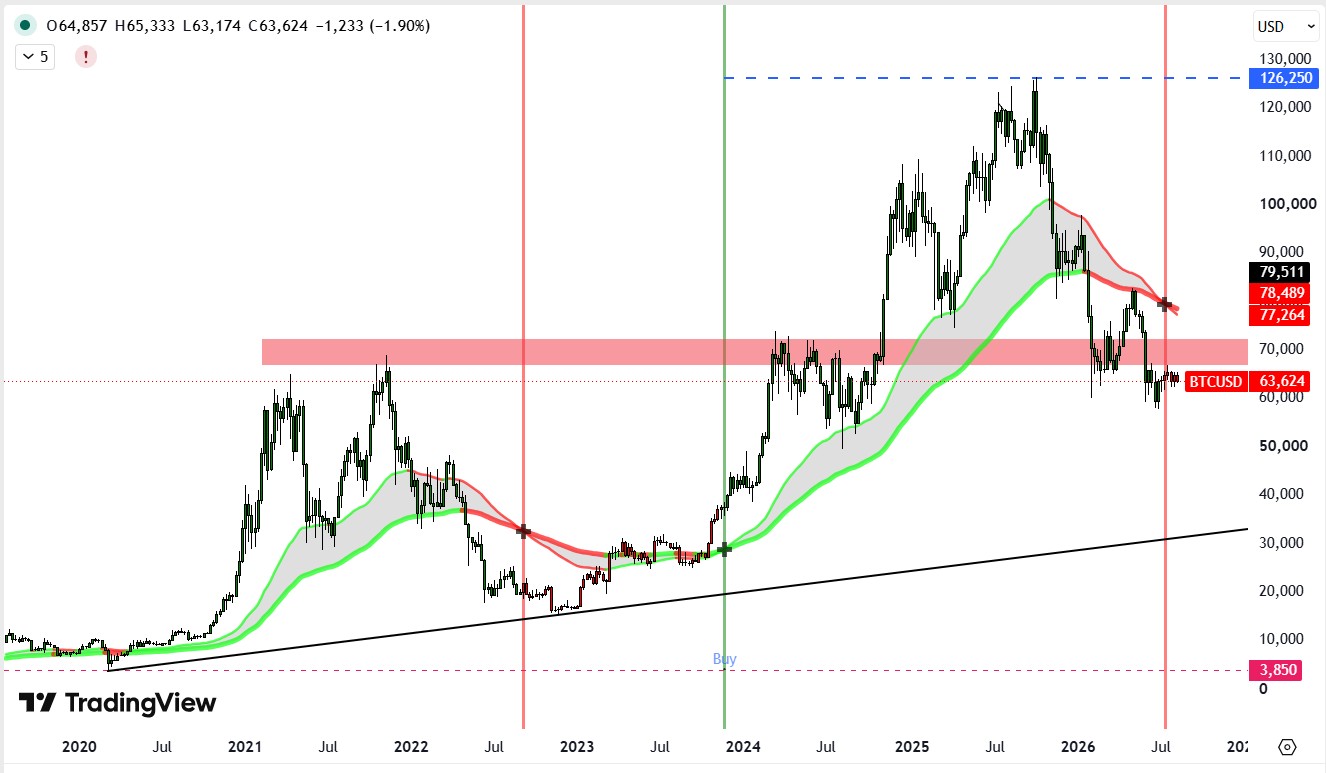
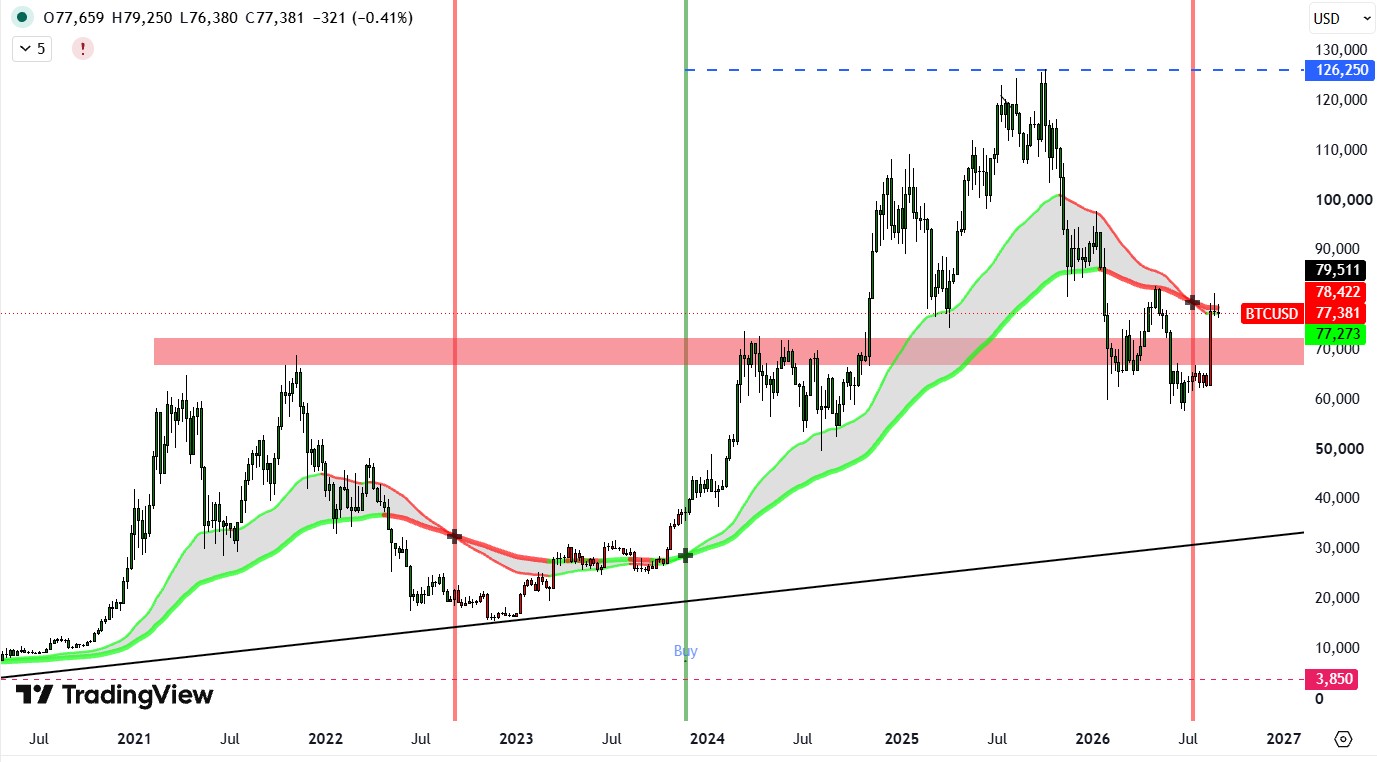
Bitcoin traded at $64,087, up 176 points or 0.28% from the previous session.

The cryptocurrency has gained 0.50% over the past four weeks but remains down 46.67% over the last 12 months. Trading Economics forecasts Bitcoin at $66,236 by quarter-end and $73,276 within one year.

First resistance is seen at 65,900, with initial support near

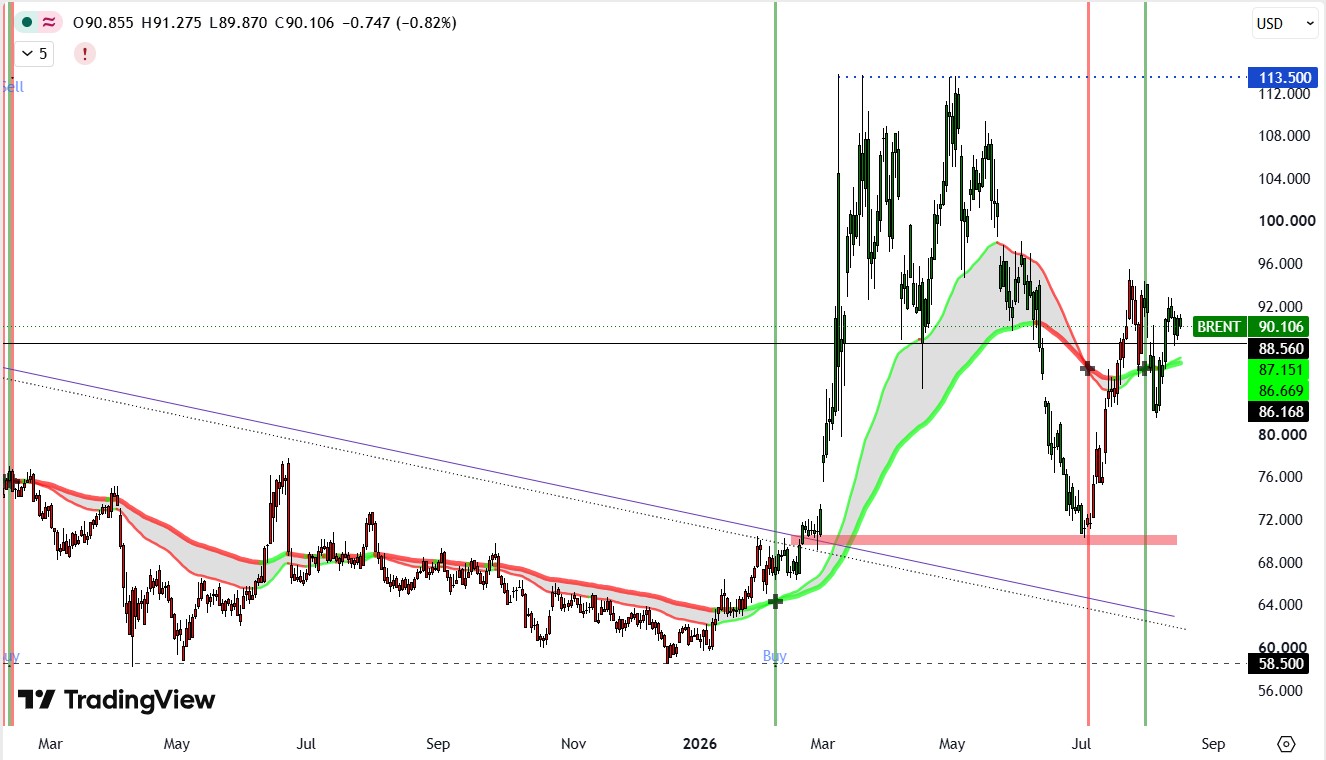
Brent Crude Oil
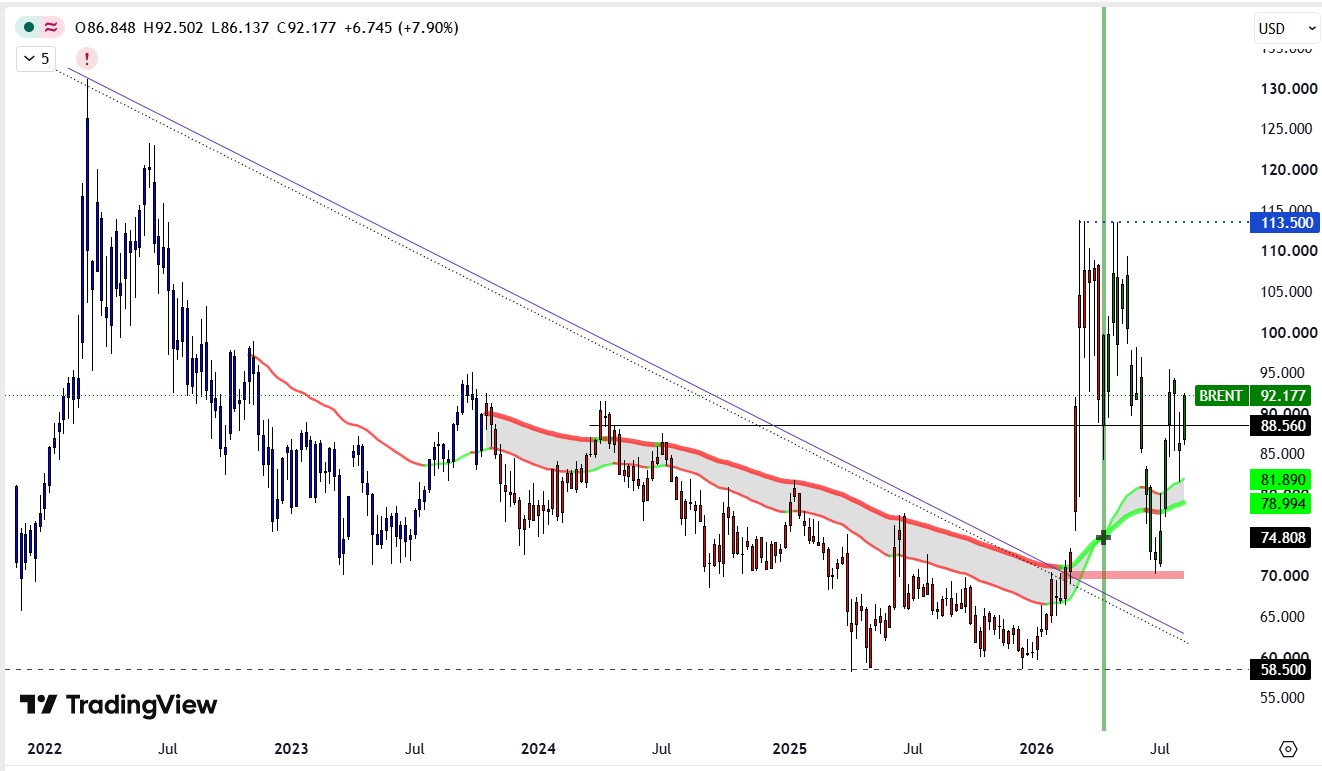
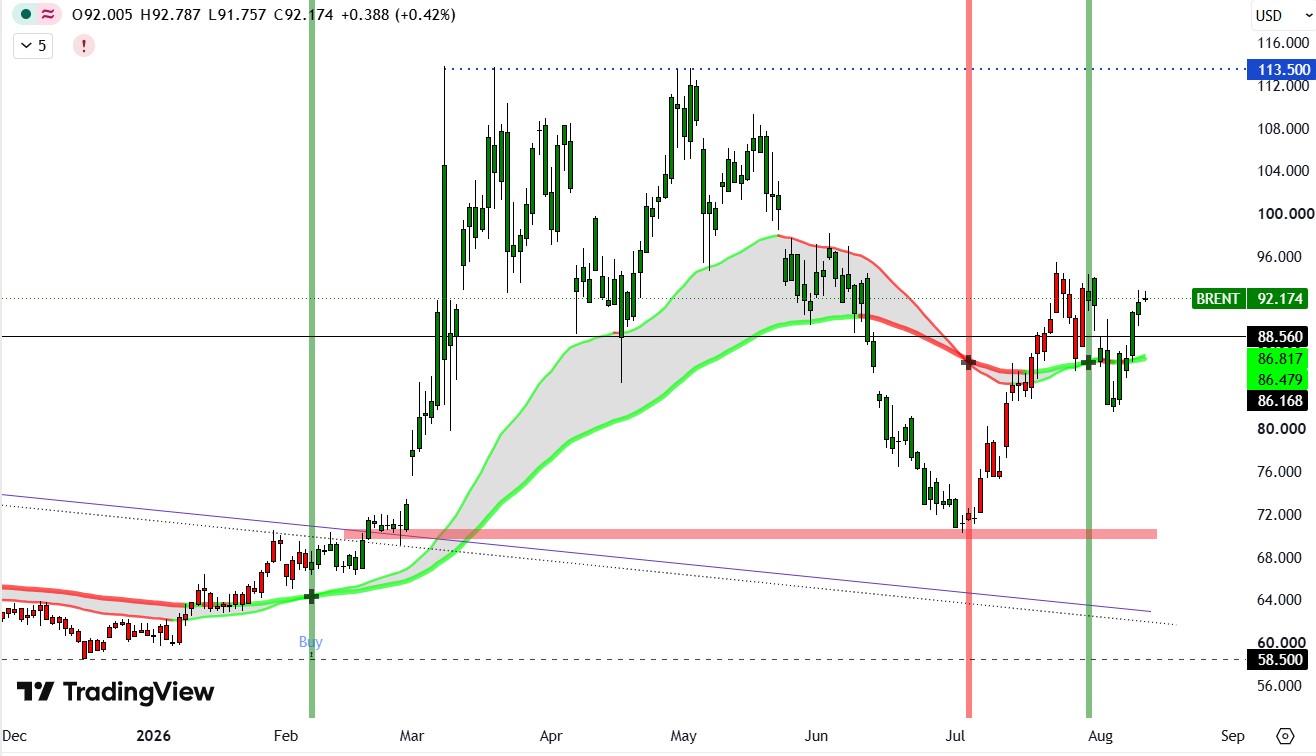
Brent climbed above $84 per barrel, extending gains for a third session as uncertainty over Hormuz persisted.

Iran said talks with Oman were close to an agreement but warned reopening would take time, while demanding an end to the naval blockade, sanctions relief, and compensation for war damage. The Houthis also claimed an attack on Saudi Arabia’s Jazan refinery, while an ADNOC tanker was hit in Hormuz.

Resistance is seen at 88.10, while the nearest support stands at 86.70.

Nasdaq 100
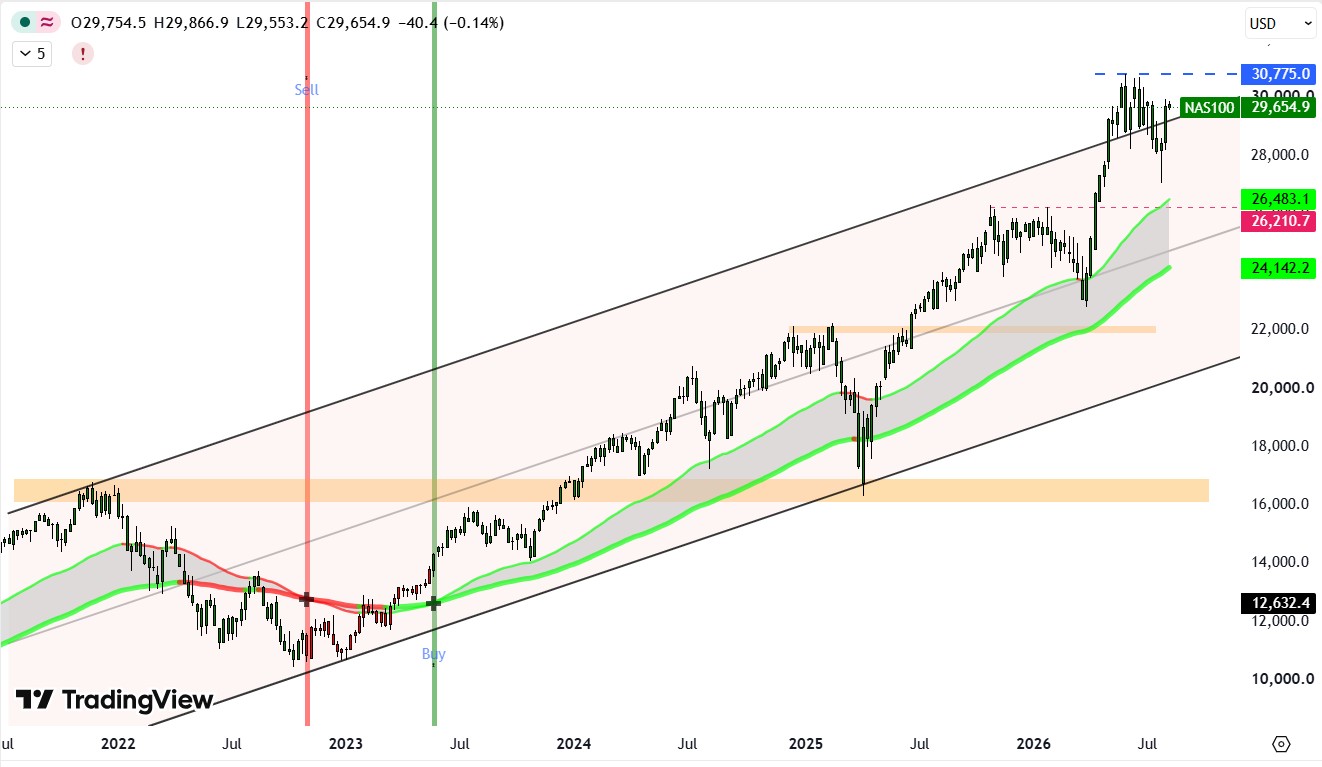
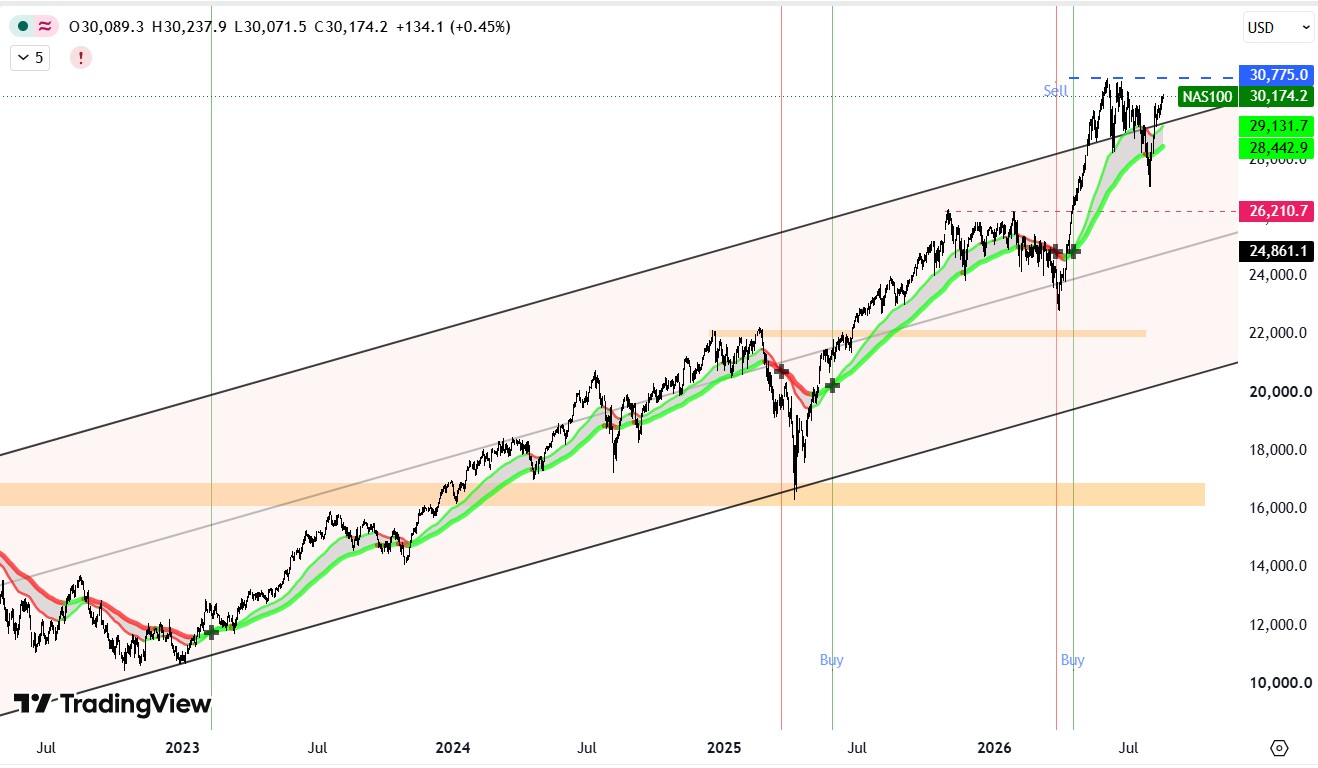
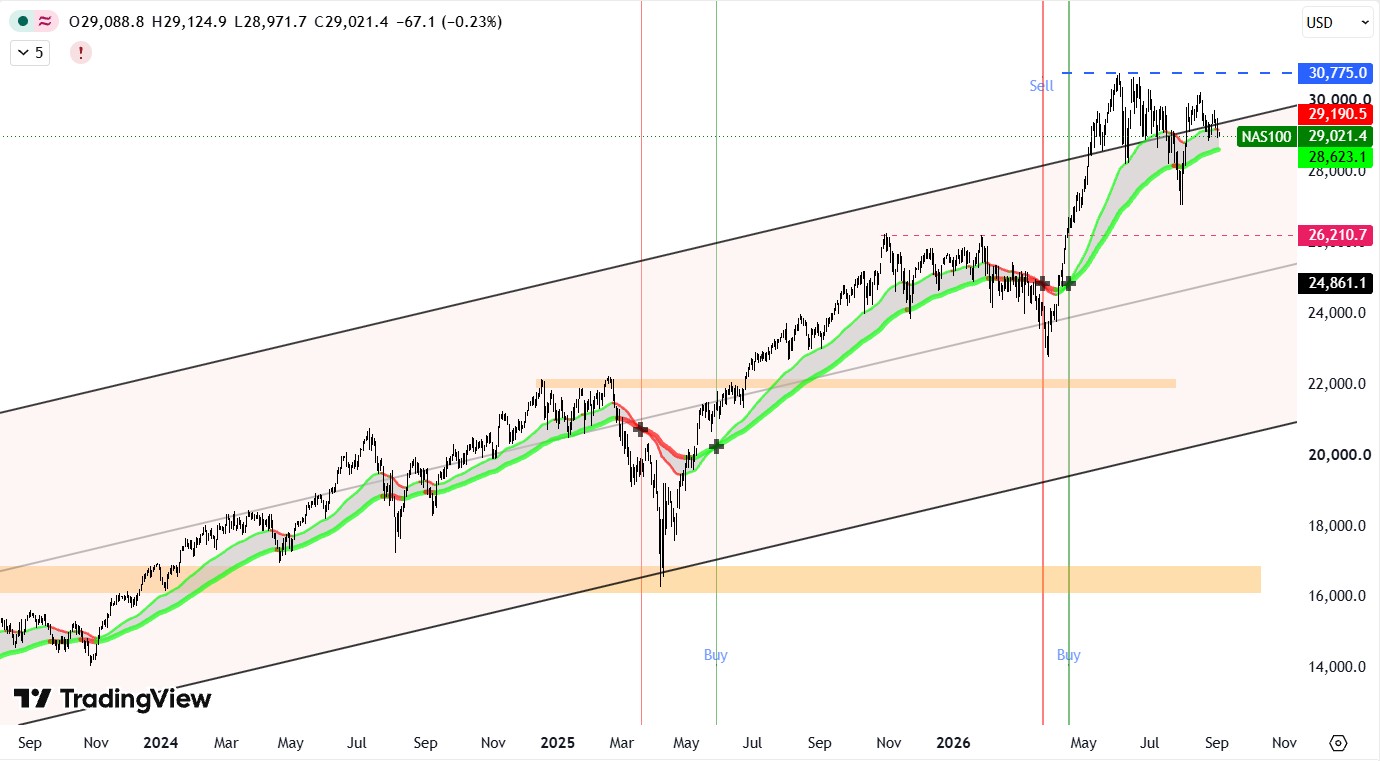
The US 100 Tech Index traded at 29,674, down 100 points or 0.34% on Tuesday. The index has lost 1.40% over the past four weeks but remains 24.47% higher over the last 12 months. Trading Economics forecasts 29,092 by quarter-end and 27,281 within one year.

Resistance stands at 30,000, while the nearest support is located at 29,500.

Offshore Chinese Yuan
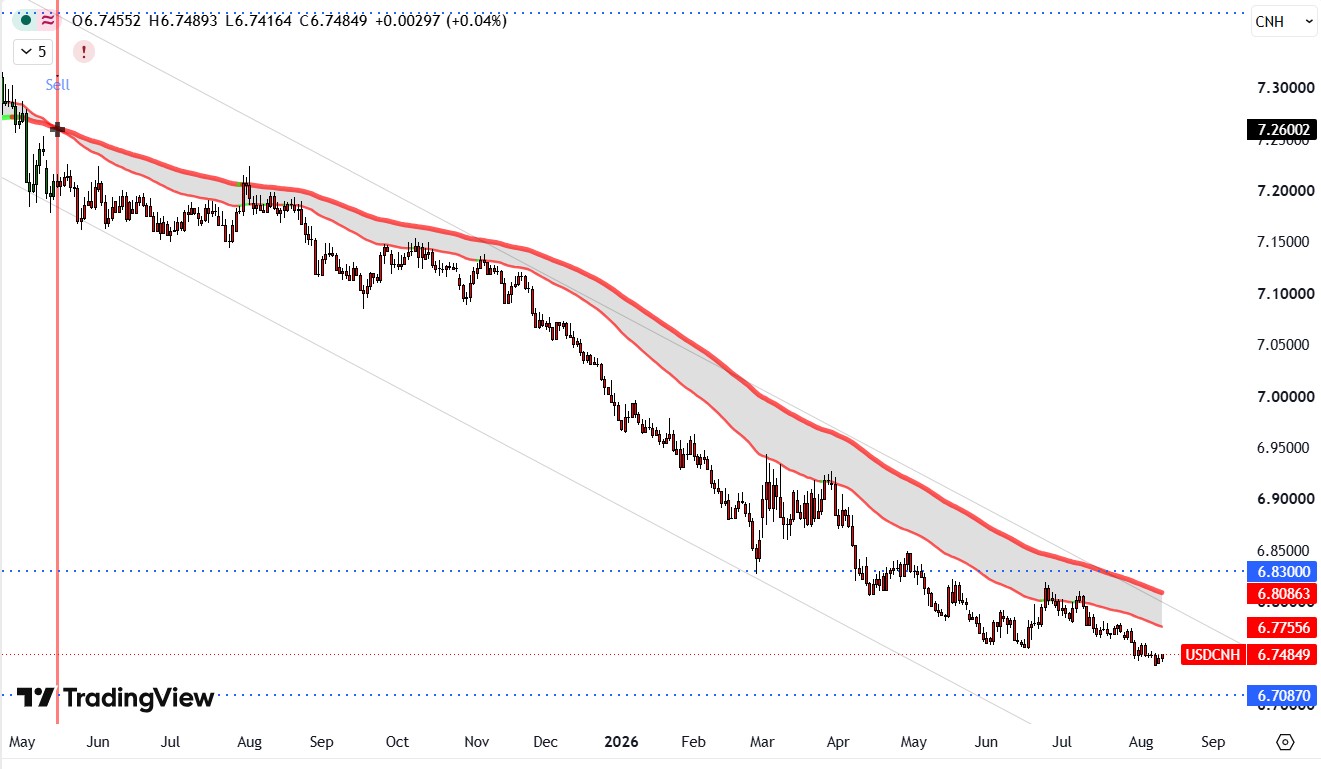
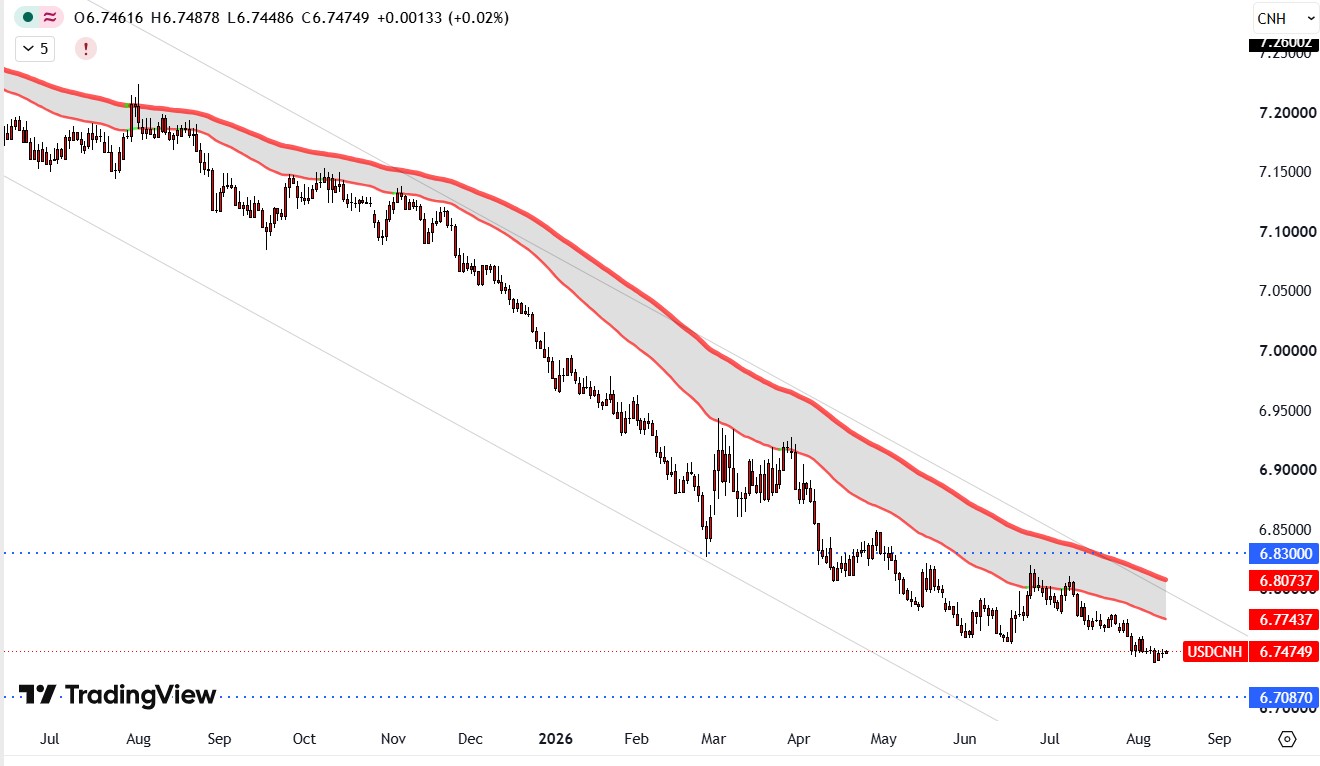
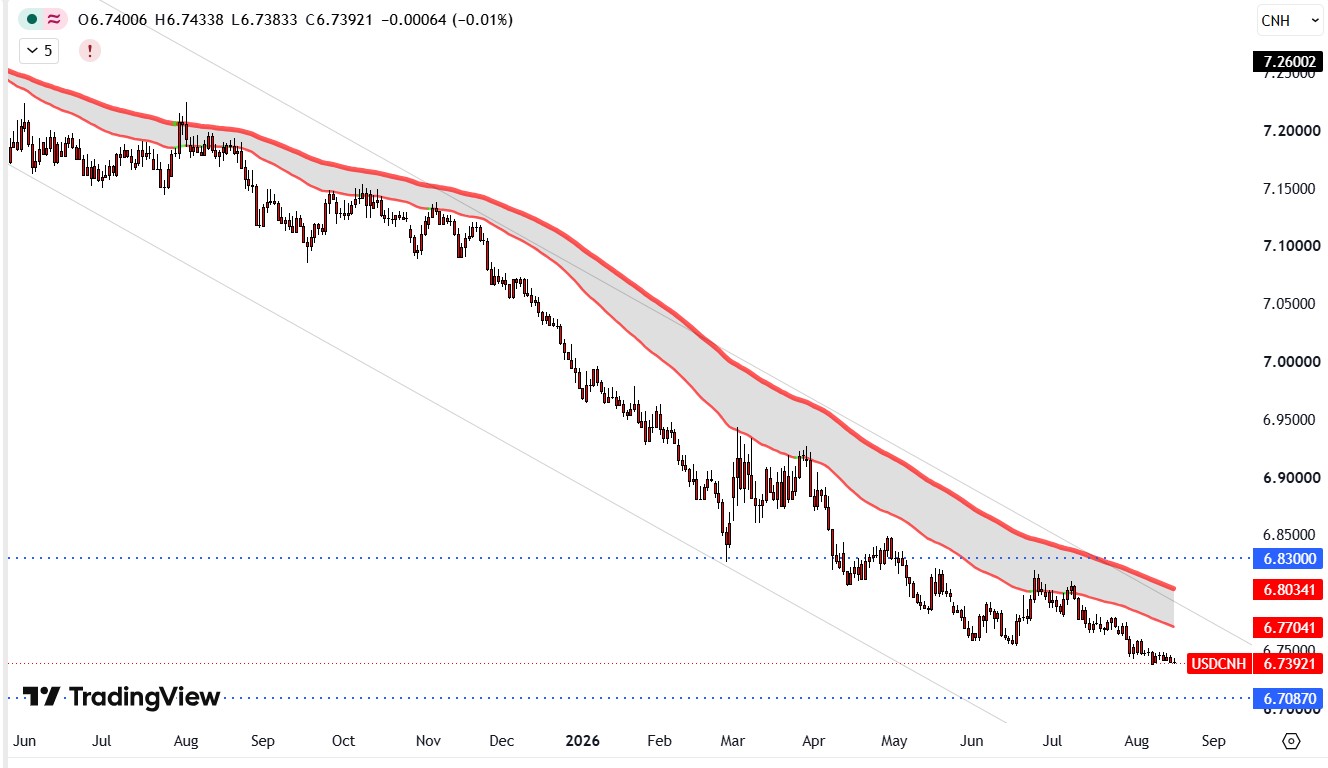
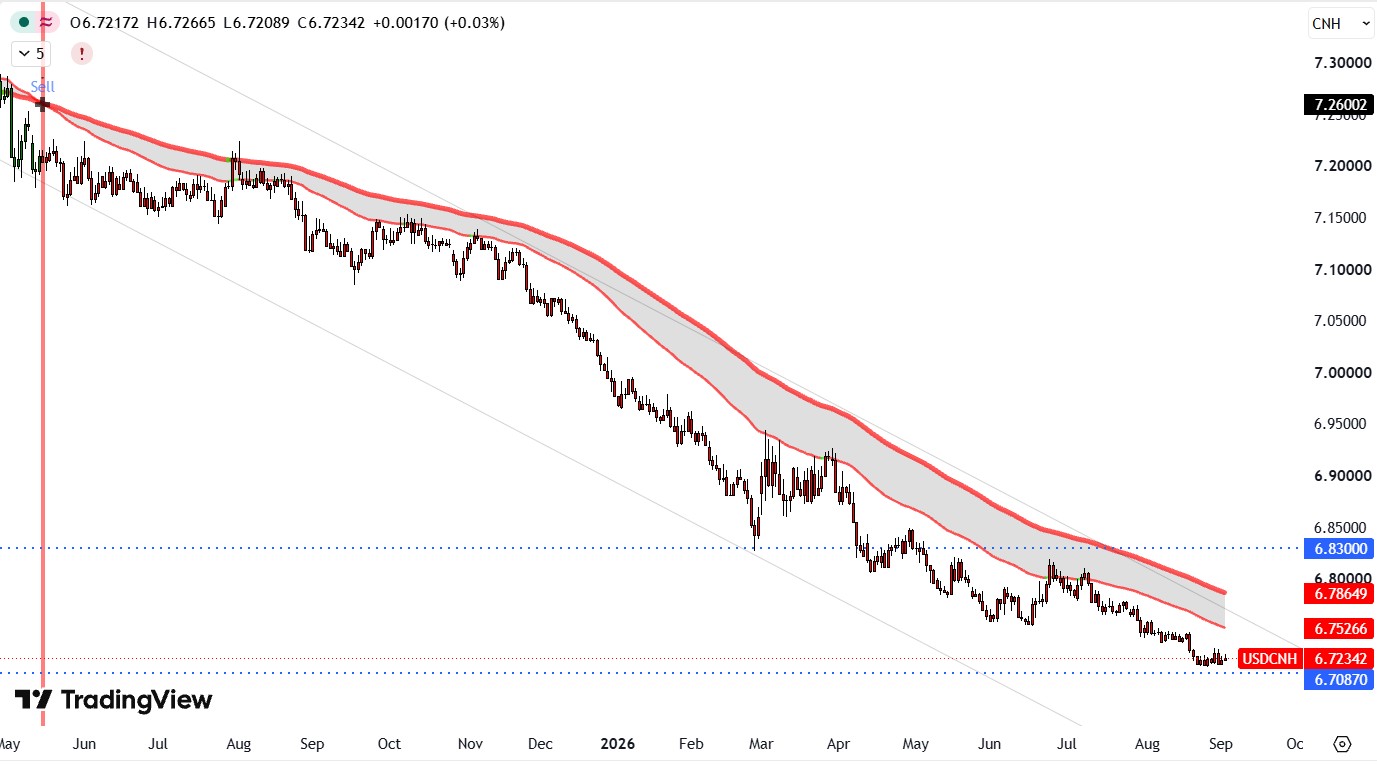
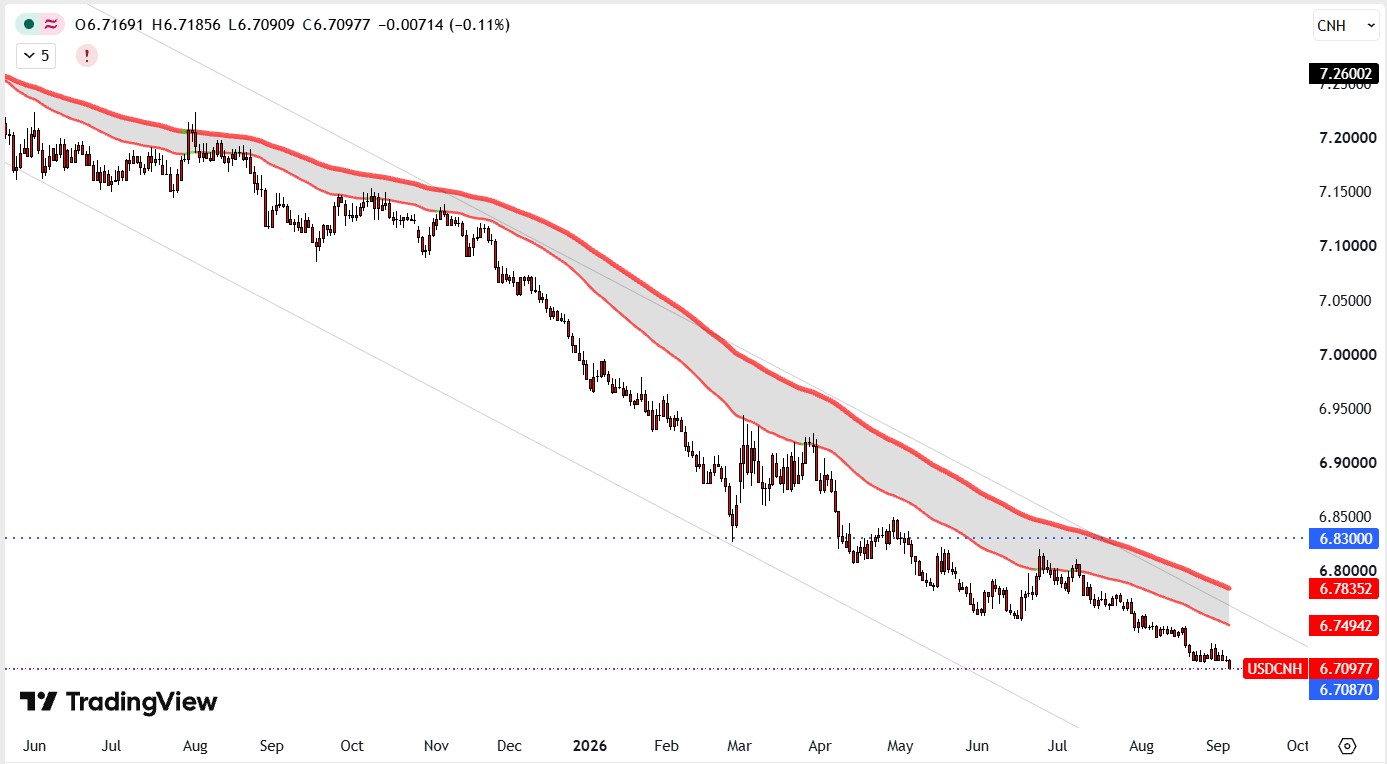
The offshore yuan weakened to around 6.74 per dollar, pulling back from a more than three-year high after softer inflation pointed to weak domestic demand.

Consumer inflation slowed to 0.5% in July, a six-month low, while producer price inflation eased to 3.5% from 4.1%.

Beijing pledged stronger support through faster fiscal spending, bond issuance, equipment upgrades, and consumer trade-in programs, with domestic consumption still weak despite solid exports and industrial production.

Resistance stands at 6.7550 while the nearest support is located at 6.7400.
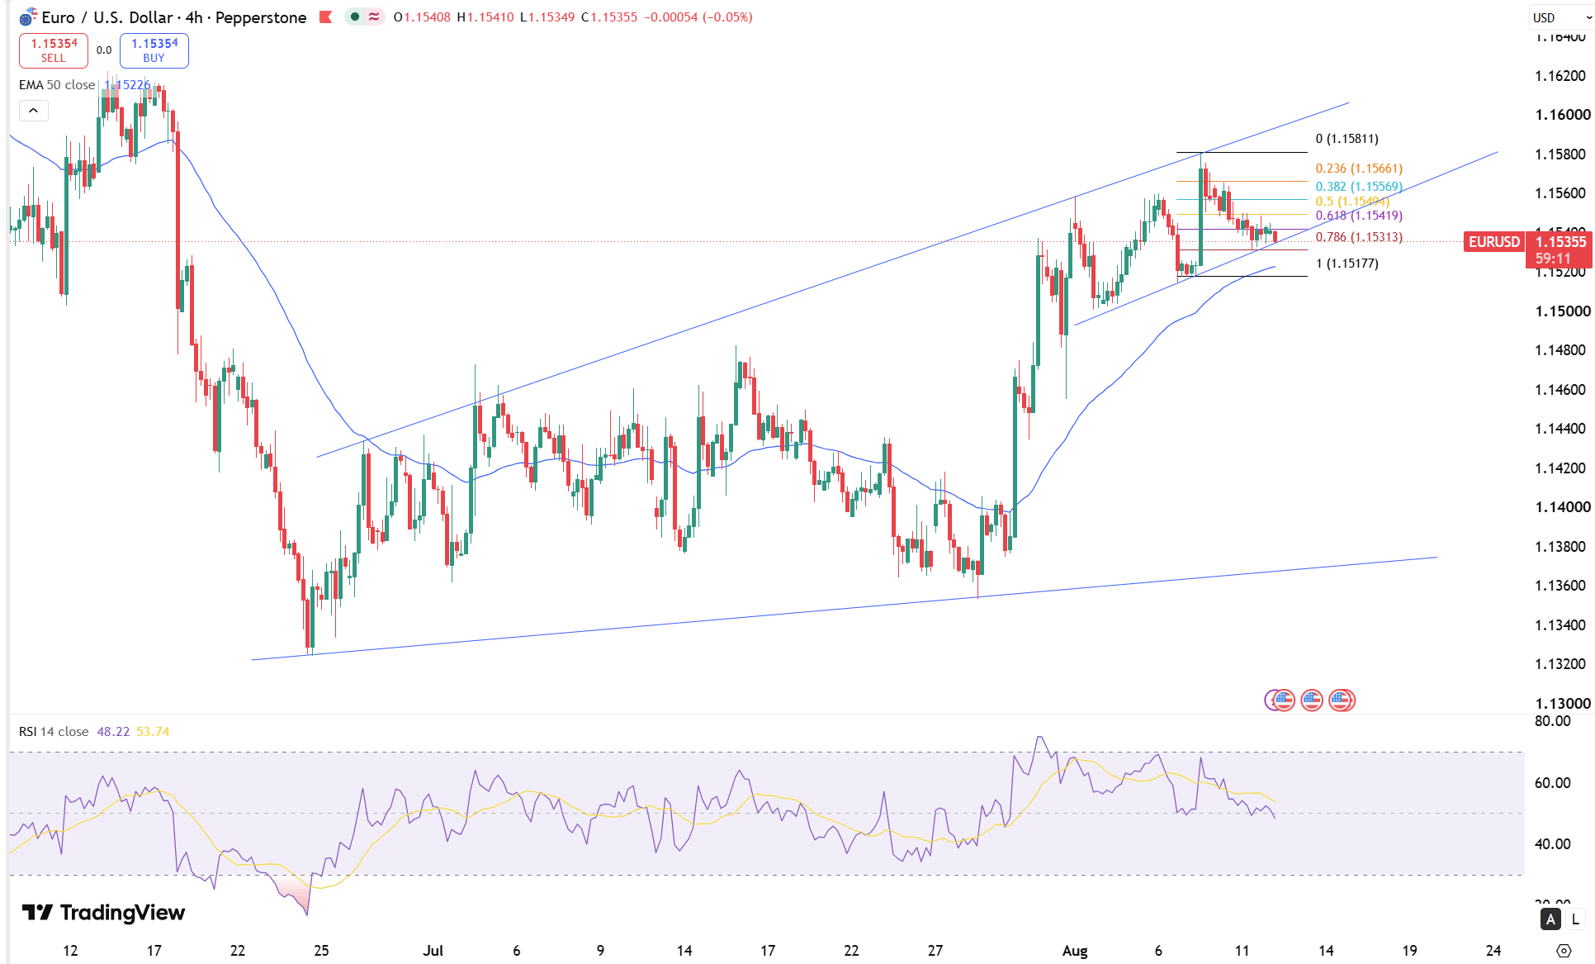
Today, traders are anticipating the release of US CPI data, which could serve as a key driver for EUR/USD movements. If US inflation comes in lower than expected, the US Dollar Index could decline, potentially allowing the Euro to test upper resistance levels. Meanwhile, tensions in the Strait of Hormuz—which have driven up crude oil prices—pose an additional burden on the Eurozone, a region sensitive to energy costs. Rising energy prices risk triggering stagflationary pressures in Europe, thereby limiting the Euro’s upside. The ECB maintains a cautious stance, while the market reassesses the likelihood of a Federal Reserve rate cut at the upcoming meeting based on US labor market and inflation data.

U.S. Inflation and Hormuz Talks Shape Sentiment (08.12.2026)

US inflation data now takes center stage, with a September Fed hike still in question. EUR/USD held near 1.1540, Bitcoin traded around $63,768, and the US 100 Tech Index slipped to 29,535 as traders positioned for the next policy signal.

Brent pushed above $89 for a sixth session as conflicting signals around a US-Iran agreement kept the supply outlook uncertain. Higher oil prices brought inflation and interest rates back into focus, while gold recovered toward $4,400.

U.S.-Iran diplomacy and the Strait of Hormuz continued to influence currencies, commodities, and inflation expectations.

Economic Calendar

Time Cur. Event Forecast Previous
10:00 OIL OPEC Monthly Report
12:30 USD CPI (YoY) (Jul) 3.4% 3.5%
12:30 USD CPI (MoM) (Jul) 0.1% -0.4%
12:30 USD Core CPI (MoM) (Jul) 0.2% 0.0%
12:30 USD Core CPI (YoY) (Jul) 2.5% 2.6%
14:30 USD Crude Oil Inventories 2.356M

Check more on zForex!

Euro Holds Near 1.1540

EUR/USD moved sideways on Wednesday, hovering around 1.1540 while remaining confined within its established trading range. A subdued US dollar helped stabilize the pair as markets closely watched Middle East developments and potential Strait of Hormuz progress.

Technical indicators retain a mildly bullish bias, though the 100-day moving average limits immediate gains, with a breakout opening path toward the 200-day average.

The first resistance is positioned at 1.1570 while the support starts from 1.1500.

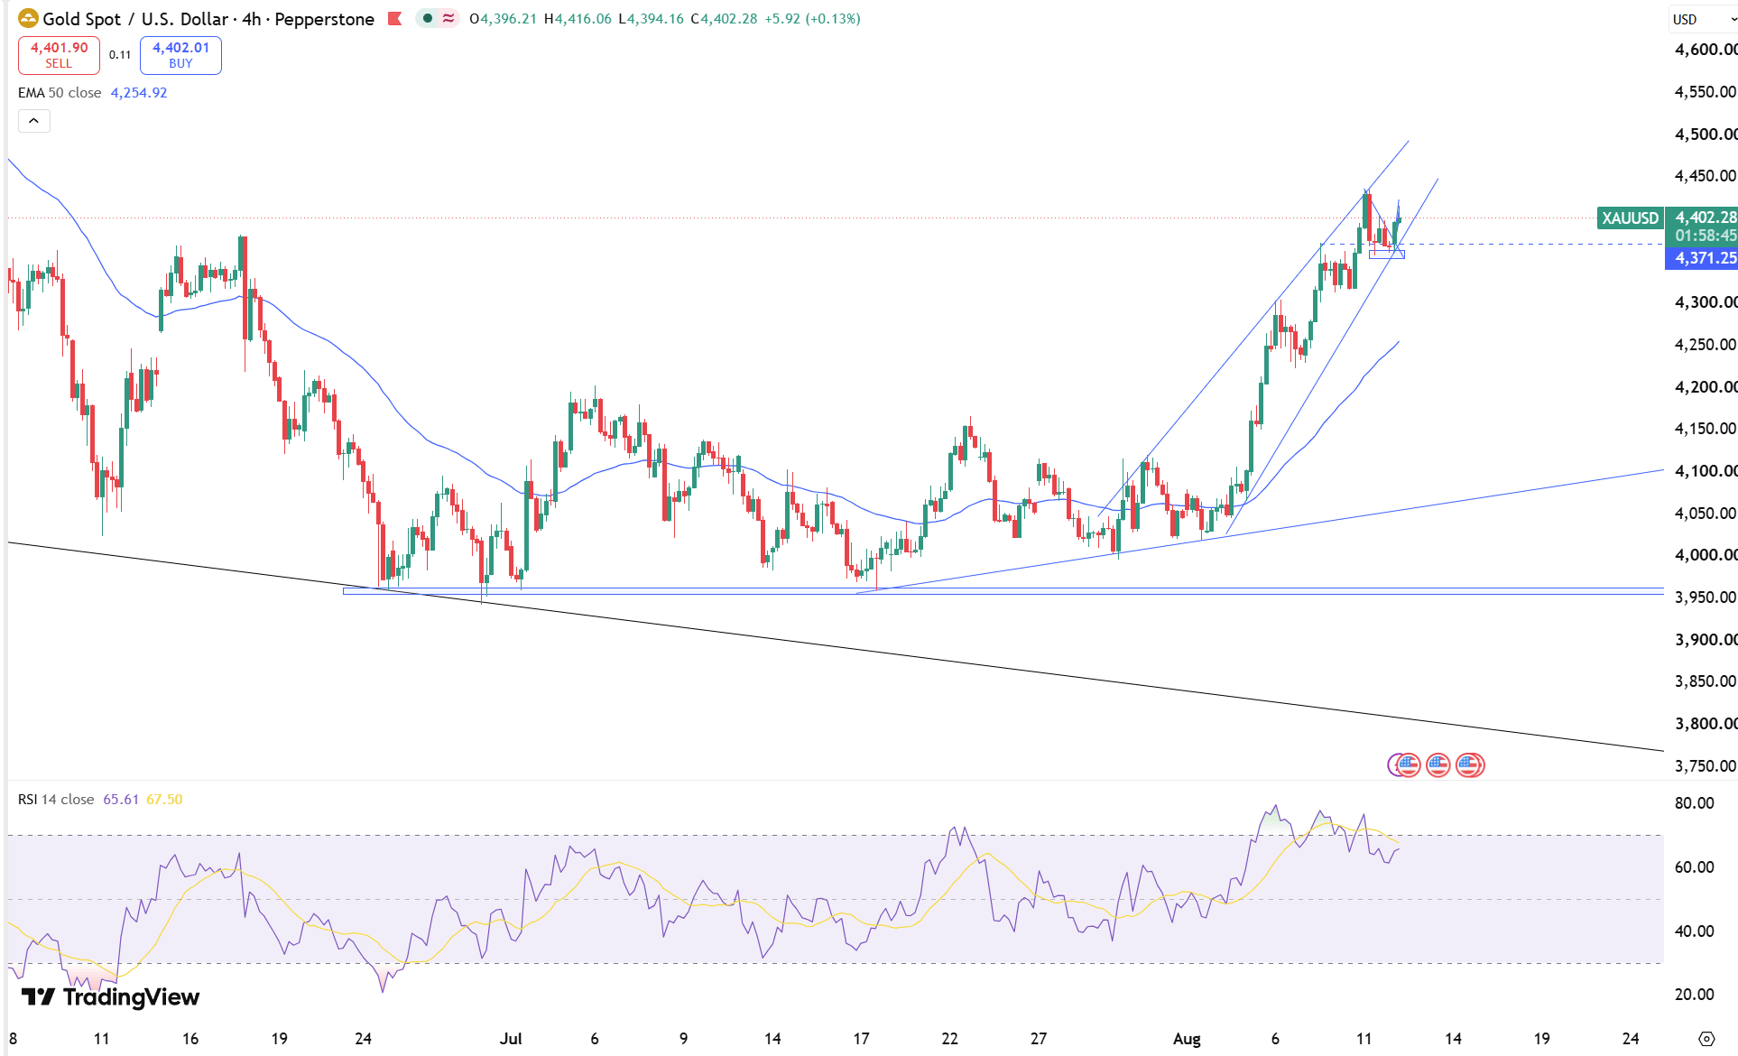
Gold Rebounds Toward $4,400

Gold climbed toward $4,400 an ounce on Wednesday, recovering from the previous session’s losses as investors awaited key US inflation data for clues on the Federal Reserve’s next policy steps. Markets remain split over a possible 25-basis-point Fed rate hike in September after rates were left unchanged in July, while higher oil prices continue to support a hawkish outlook.

Meanwhile, investors monitored developments around a potential US-Iran agreement to reopen the Strait of Hormuz, with Pakistan’s defense minister saying the two sides were close to a deal and reports suggesting Iran-Oman talks had advanced.

First resistance is seen at $4430, with initial support near $4390.

Yen Weakens Past 159

The Japanese yen weakened beyond 159 per dollar on Tuesday, giving back roughly half of its recent intervention-driven gains and testing the willingness of Tokyo and Washington to support the currency. Traders remain alert to the possibility of another intervention.

Japan and the US carried out a record coordinated yen-buying operation at the end of July after the currency hit 40-year lows, but markets were disappointed when no further measures followed.

First resistance is seen at 160.00, with initial support near 158.60.

Sterling Holds Near $1.349

The British pound remained firm near $1.349, hovering close to multi-week highs as markets processed mixed signals surrounding Middle East diplomacy and the Strait of Hormuz.

Iranian Foreign Minister Abbas Araghchi indicated progress on a regional shipping framework with Oman, though he dismissed direct US talks and clarified that any final agreement would not immediately restore normal maritime traffic.

From a technical view, resistance stands near 1.3530, with support around 1.3400.

Silver Stabilizes Near $65

Silver held steady near $65 per ounce on Wednesday following a previous dip, as investors positioned ahead of critical US inflation figures for monetary policy direction. Financial markets remain divided over a potential 25-basis-point Federal Reserve interest rate hike in September, with elevated crude prices reinforcing hawkish policy risks.

Meanwhile, market participants continue tracking evolving diplomatic signals regarding a potential US-Iran agreement to reopen the Strait of Hormuz.

From a technical view, resistance stands near $65.80, while support is located around $65.00.

Brent Crude Oil

Brent climbed above $89 per barrel, extending its rally to a sixth session as traders assessed mixed signals over a possible US-Iran agreement. Pakistan’s defense minister said the two sides were close to a Hormuz deal, while Iran-Oman talks reportedly advanced.

President Trump took a tougher stance, demanding compensation from Tehran for those killed in Iran-linked attacks.

Resistance is seen at 90.00, while the nearest support stands at 88.70.

Nasdaq 100

The US 100 Tech Index traded at 29,535, down 96 points or 0.33%. The index has fallen 0.92% over the past four weeks but remains 23.84% higher over the last 12 months.

Trading Economics forecasts 29,092 by quarter-end and 27,281 within one year.

Resistance stands at 30,000, while the nearest support is located at 29,500.

Chinese Yuan (USD/CNH)

The offshore yuan traded around 6.74 per dollar, holding its recent decline as softer inflation pointed to weak domestic demand.

Consumer inflation slowed to a six-month low of 0.5% in July, while producer price inflation eased to 3.5% from 4.1%, its first slowdown since returning to positive territory in March.

Resistance stands at 6.7550 while the nearest support is located at 6.7400.
Bitcoin (BTC/USD)

Bitcoin traded at $63,768, up 219 points or 0.34%. The cryptocurrency has gained 2.47% over the past four weeks but remains 48.30% lower over the last 12 months.

Trading Economics forecasts Bitcoin at $66,236 by quarter-end and $73,276 within one year.

First resistance is seen at 65,900, with initial support near 62.500.
Announcement

Sorry, mates. I’m a bit under the weather and won’t be featuring the weekly technical outlook analyses for this week. I hope to see you’all next week.

Trade safe and prosper.
Trap

Weak U.S. Data Supports Metals and Currencies (08.17.2026)

The US 10-year yield held near 4.69% after rising about 5bps Friday. Michigan one-year inflation expectations climbed above 4% for a fifth month, while the US-Iran ceasefire expires today with Hormuz talks still stalled. Despite softer inflation, consumer sentiment, and retail sales data, the probability of a September Fed hold has risen to 67% from below 50% a month ago.

The Dollar Index fell for a third session to around 99.5 as softer US data reduced Fed hike expectations. The probability of a September hold now stands near 67%, compared with below 50% a month ago. Focus turns to the FOMC minutes, Warsh’s Jackson Hole speech, and Empire State and NAHB data, with the dollar weakest against the Australian dollar, New Zealand dollar, and pound.

US stock futures edged higher as attention shifted to earnings from Home Depot, Lowe’s, and Walmart. Wednesday’s Fed minutes are also in focus after softer inflation reduced September hike expectations. The S&P 500 and Nasdaq have gained for three straight weeks, helped by strong earnings despite Middle East and AI concerns.

Japan’s 10-year yield jumped to 2.93%, its highest since 1996, as expectations for a BOJ hike grew. Q2 GDP expanded 1.1% annualized, below the 2% forecast, as weak domestic demand offset strong exports. The BOJ recently raised its FY2026 growth forecast to 0.6%, while yen weakness and inflation support calls for tighter policy.

Economic Calendar

Time Cur. Event Forecast Previous
03:50 JPY GDP (QoQ) (Q2) 0.3% 0.5%
All Day KRW South Korea – Liberation Day (Holiday)

Euro Nears 1.1600

The euro strengthened toward 1.1570, approaching resistance at 1.1600 as US dollar momentum wanes. Weak July US retail sales alongside muted inflation figures reduced September Fed rate hike odds to nearly 33%. Eurozone inflation at 2.9% supports continued ECB tightening expectations, though Middle East geopolitical tensions and rising European gas prices pose ongoing risks.

The first resistance is positioned at 1.1590 while the support starts from 1.1520.
Gold Breaks Above $4,400

Gold advanced beyond $4,400 per ounce on Monday, building on momentum as muted US inflation, softening retail sales, and weakening consumer confidence lowered September Federal Reserve rate hike odds to nearly 33%. While traders await the upcoming FOMC minutes and Jerome Powell’s Jackson Hole address, persistent geopolitical friction from fresh Middle East strikes and new Iranian sanctions supported bullion’s safe-haven appeal.
First resistance is seen at $4420, with initial support near $4360.

Yen Recovers to 159

The Japanese yen strengthened toward 159 per dollar on Monday, regaining ground lost last week as a softening US dollar reflected weaker economic data. Market expectations for the Federal Reserve to hold interest rates steady in September rose to roughly 67%. The yen gained despite Japan’s second-quarter annualized GDP growth slowing to 1.1% due to sluggish domestic consumption, while traders remained vigilant for intervention and prospective Bank of Japan rate increases.

First resistance is seen at 160.00, with initial support near 158.60.

Sterling Consolidates Near 1.35

GBP/USD trades near 1.35, maintaining a steady consolidation pattern. Technical levels show firm support at 1.3400 and strong resistance at 1.3600 as the market awaits a clear breakout catalyst. With cautious trading volumes preceding critical employment and inflation reports, traders continue balancing Federal Reserve rate expectations against Bank of England monetary policy, while broader market risk sentiment drives short-term direction.

From a technical view, resistance stands near 1.3570, with support around 1.3510.

Silver Climbs Near $66

Silver climbed toward $66 per ounce on Monday, extending recent gains as soft US economic reports, including muted inflation, declining retail sales, and weakening consumer sentiment, reduced September Fed rate hike probabilities to roughly one-in-three. While investors await the FOMC minutes and Jackson Hole address for monetary policy guidance, geopolitical friction in the Middle East sustained safe-haven demand, even as ongoing regional oil shipments helped moderate broader energy inflation concerns.

From a technical view, resistance stands near $66.20, while support is located around $64.40.

Brent Crude Oil

Brent crude held above $88/barrel, extending last week’s gains as Middle East tensions stayed elevated after Israeli strikes on Lebanon killed 11 people, including a senior Hezbollah commander.

Trump is preparing fresh sanctions to pressure Iran as the interim US-Iran ceasefire nears expiry with Hormuz talks deadlocked, though covert crude flows through the strait capped price gains, while Iran and Oman appeared to near a separate arrangement on the waterway without US involvement.

Resistance is seen at 89.20, while the nearest support stands at 86.90.

Nasdaq 100

The Nasdaq-100 closed under mild pressure at 30,046.14, down 0.13%, as technical profit-taking offset optimism around a cooling macro backdrop.

The tech-heavy index saw distribution near its all-time high of 30,762.20, with soft US inflation data bolstering Fed rate cut expectations, even as megacap tech adjusted to normalized growth and stabilizing Treasury yields kept a lid on breakout moves.

Resistance stands at 30,450, while the nearest support is located at 29,720.

Bitcoin (BTC/USD)

Bitcoin traded under moderate pressure near $62,777, showing mild intraday stabilization above local support at $62,500.

The cryptocurrency remained locked in a range-bound corrective cycle since pulling back from early-year highs near $93,000, weighed down by muted institutional inflows, cautious ETF demand, and thin weekend liquidity, even as soft US inflation data supported broader risk assets.

First resistance is seen at 63,800, with initial support near 62.500.

Chinese Yuan (USD/CNH)

The USD/CNH pair traded tight near 6.7412, holding a narrow range between 6.7401 and 6.7461 amid low volatility across Asian and early European sessions.

The offshore yuan saw modest monthly appreciation as steady PBoC fixings discouraged one-way depreciation bets, while muted US data kept the dollar subdued and mixed Chinese indicators balanced trade flows, leaving the pair range-bound near multi-month lows.

Resistance stands at 6.7550 while the nearest support is located at 6.7380.

XAUUSD Weekly Technial Outlook

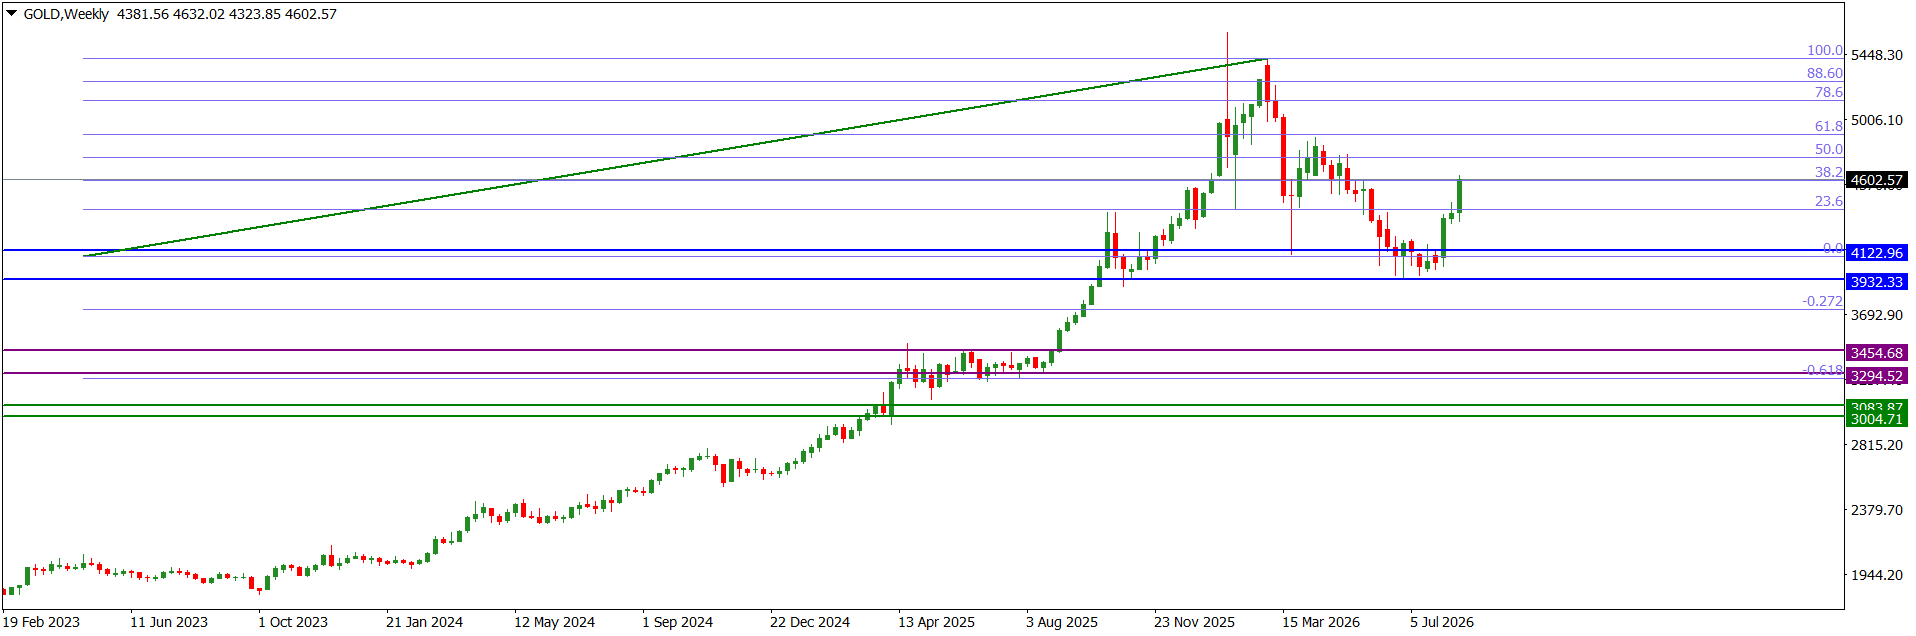
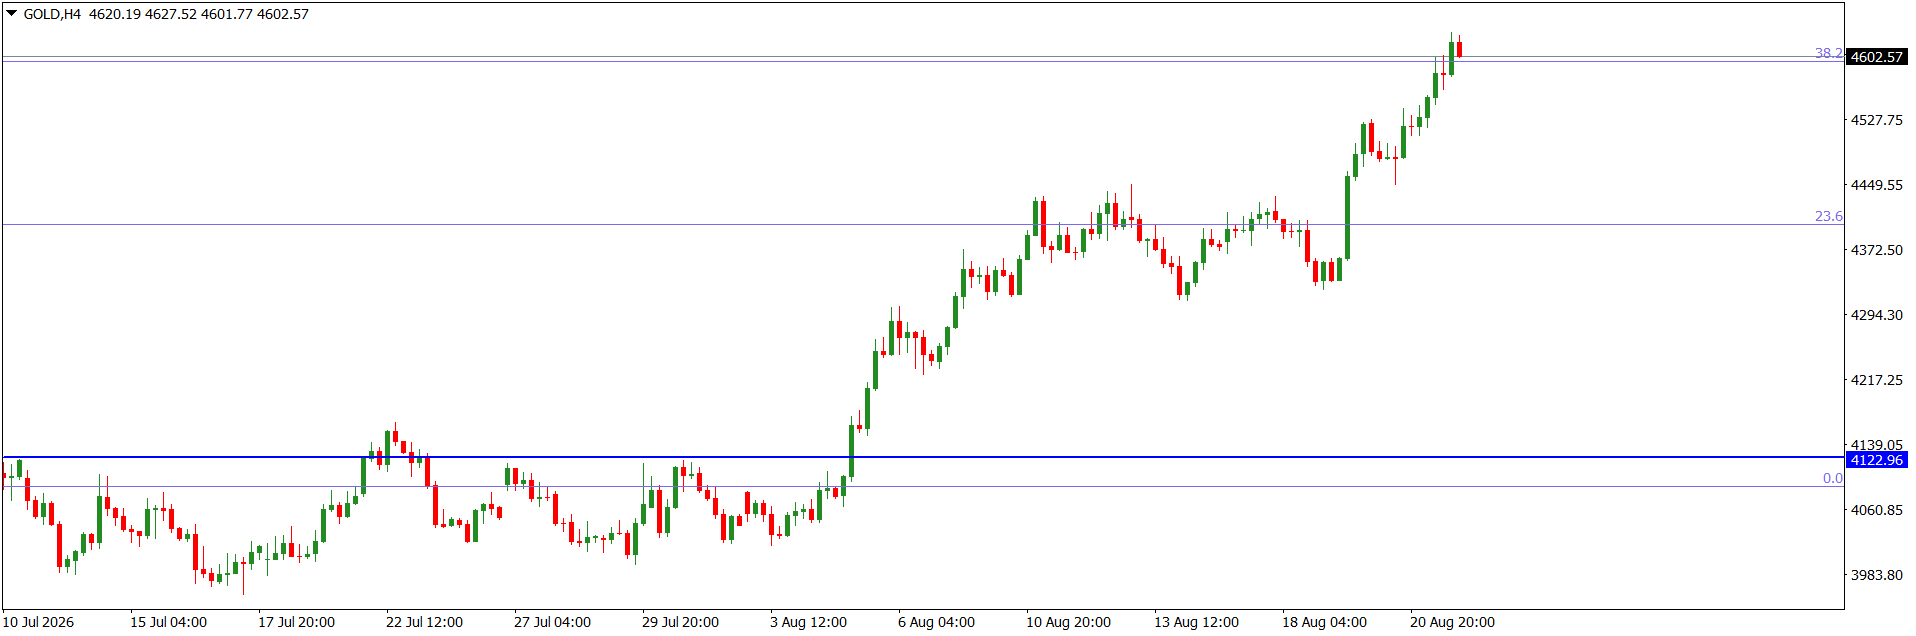
Last week, the XAUUSD market operation on the weekly time frame printed a bullish continuation candlestick. The candlestick retested the 38.2 fib-retracement of the bearish swing traceable to March 1, 2026.

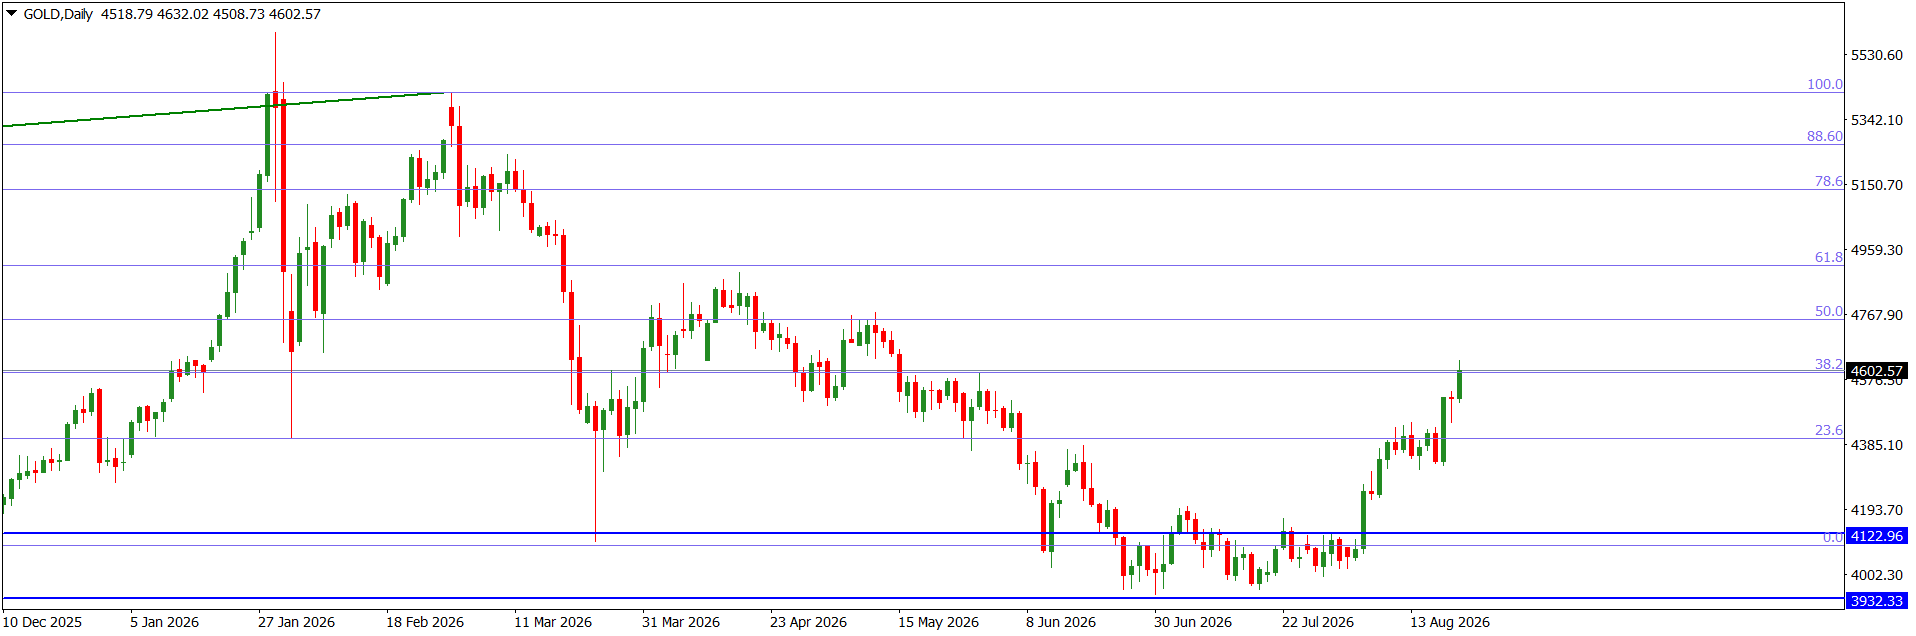
The XAUUSD price action on the daily time frame retested the 4602.57 intra-day horizontal resistance on Friday. The area aligns with the 38.2 fib-retracement of the bearish swing traceable to March 1, 2026. Technically, we may see a bearish challenge of bullish breach of the area in the early part of this week.

On Friday, the XAUUSD on the H4 time frame went sideways at the 4602.57 intra-day horizontal resistance after a bullish retest. The area aligns with the 38.2 fib-retracement of the bearish swing traceable to March 1, 2026. Technically, we may see a bearish challenge of bullish attempt to breach the area in the early part of this week.

I may be wrong. Trade safe and prosper.

Trap

USDJPY Weekly Technical Outlook

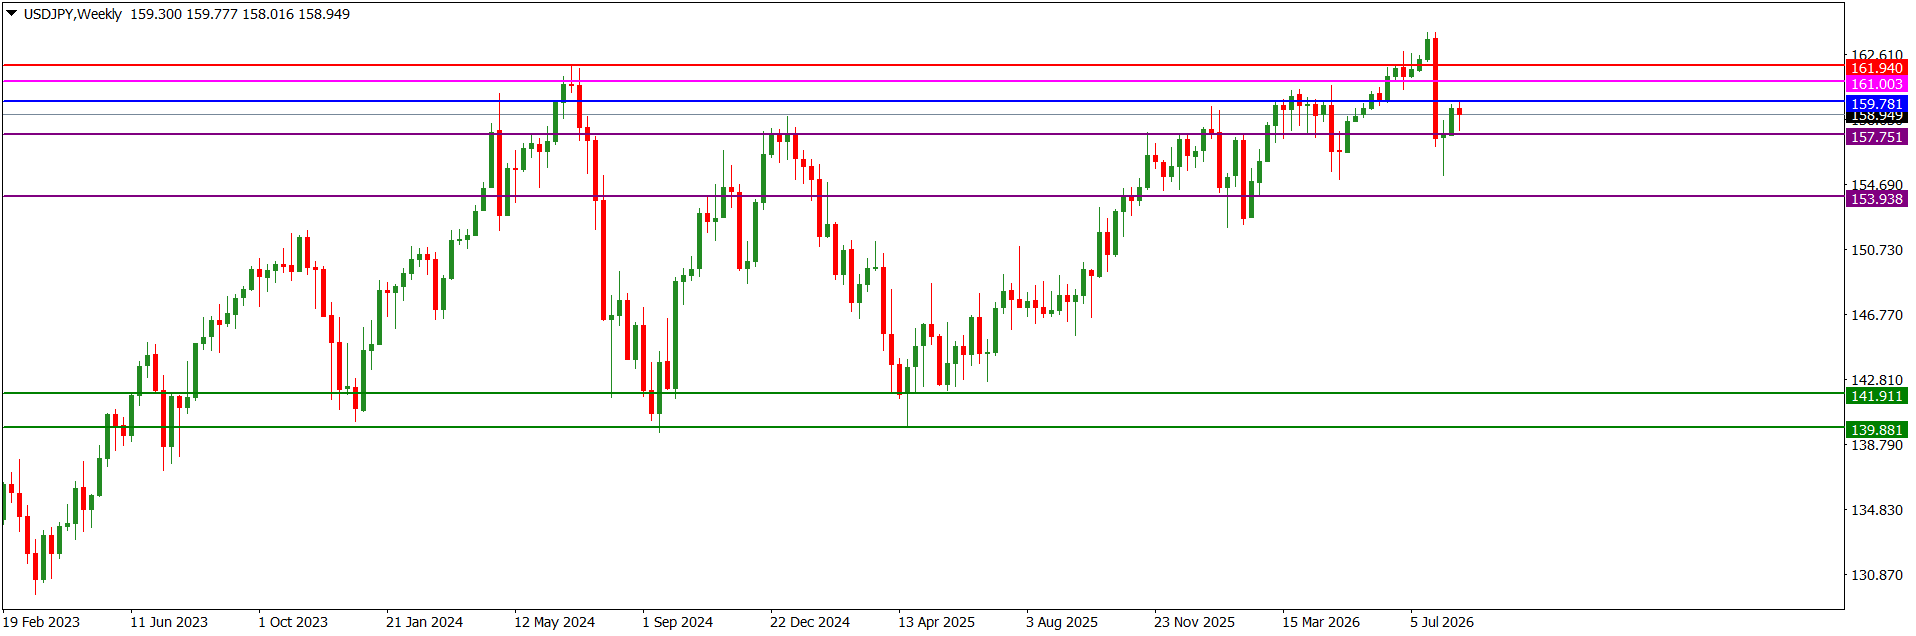
Last week, the USDJPY market operation on the weekly time frame retested the 159.780 horizontal resistance area before retracing. The candlestick became doji-like just below the area. But recent technical prints favour further northward market operation.

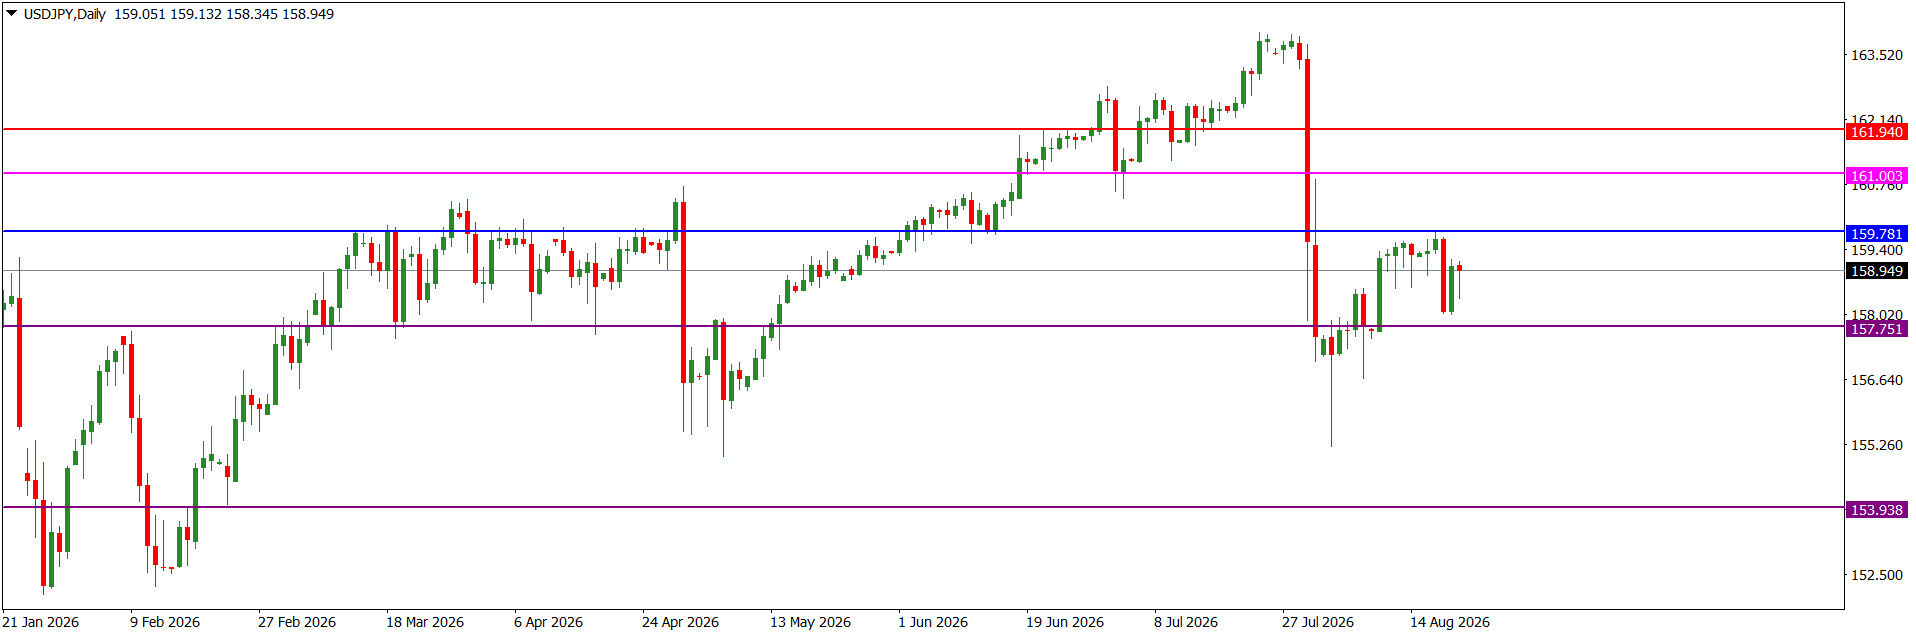
On Friday, the USDJPY price action on the daily time frame went sideways at the 158.850 intra-day horizontal resistance. This happened after a bearish pullback of price action on Wednesday from the more significant 159.780 horizontal resistance. Recent technical prints favour further northward price engineering.

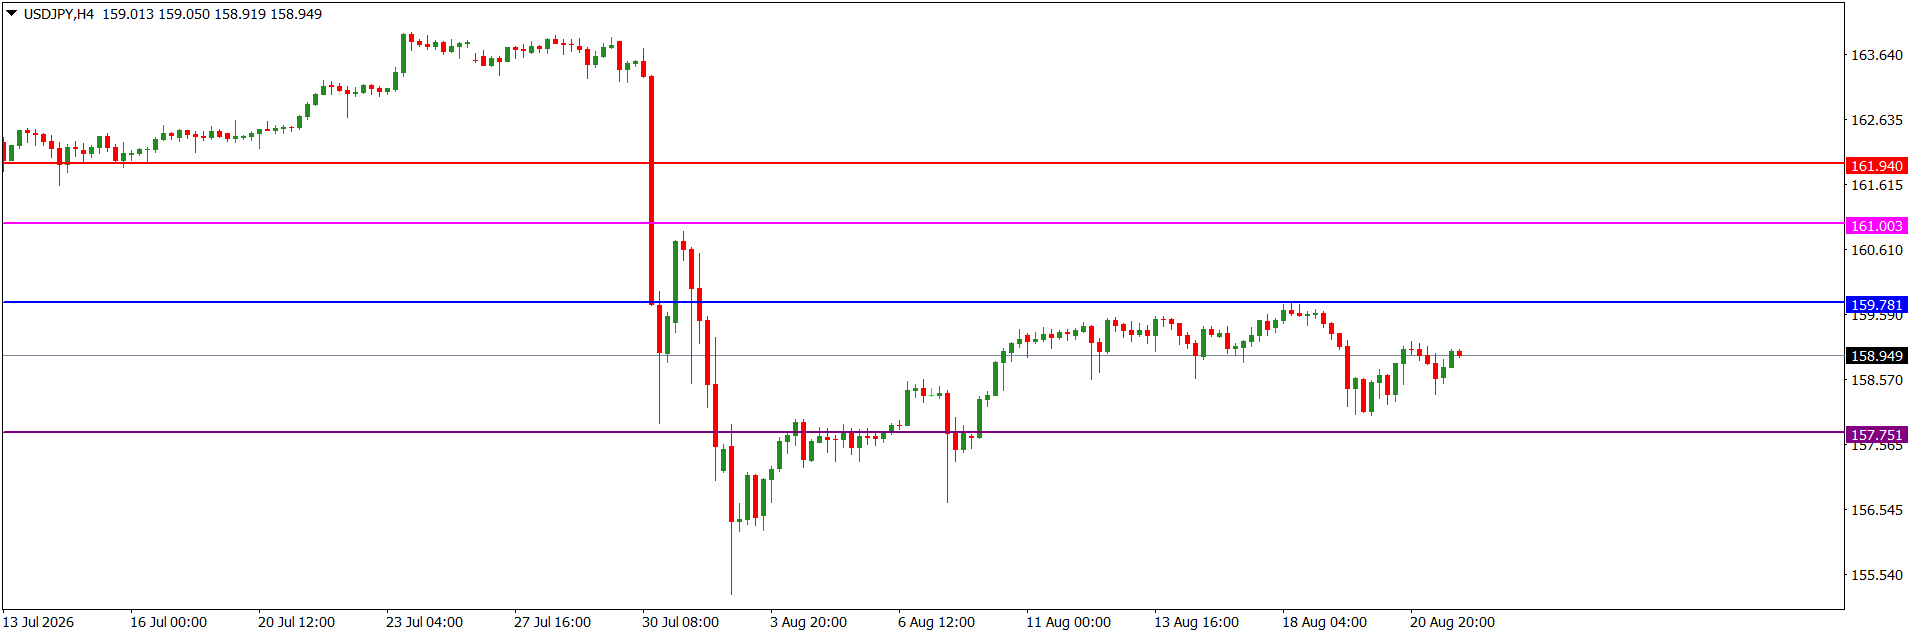
Although the USDJPY price action on the H4 time frame is presently sideways at the 158.850 intra-day horizontal resistance, recent technical prints favour further northward price engineering

I may be wrong. Trade safe and prosper.

Trap

EURUSD Weekly Technical Outlook

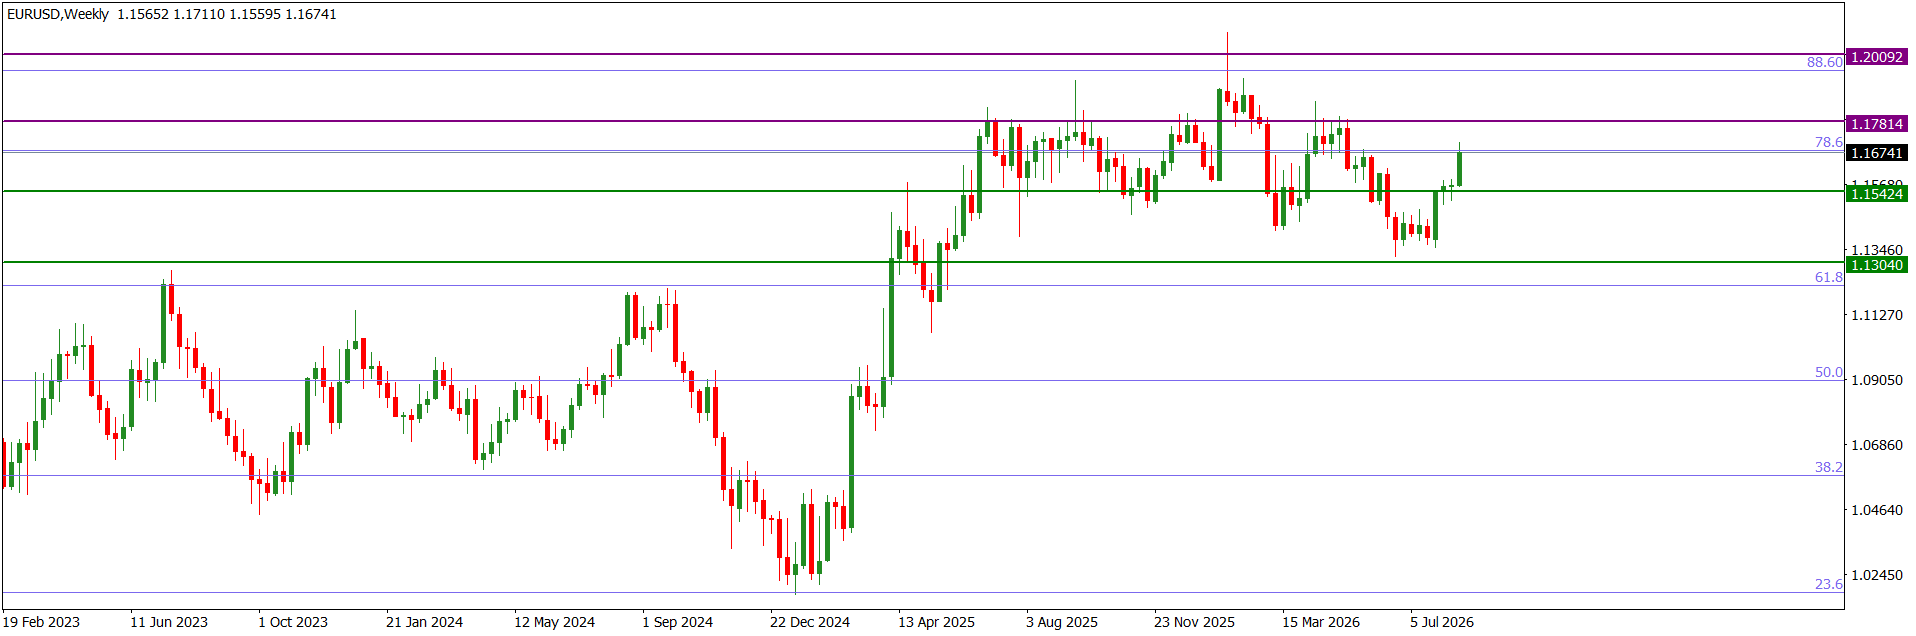
Last week, the EURUSD market operation on the weekly time frame printed a bullish candlestick. The candlestick broke out of a mini area of consolidation that was in place for two weeks. We may still see further northward market operation. The 1.17810 area, which is the next horizontal resistance, is about 100 pips away from the current location of market operation.

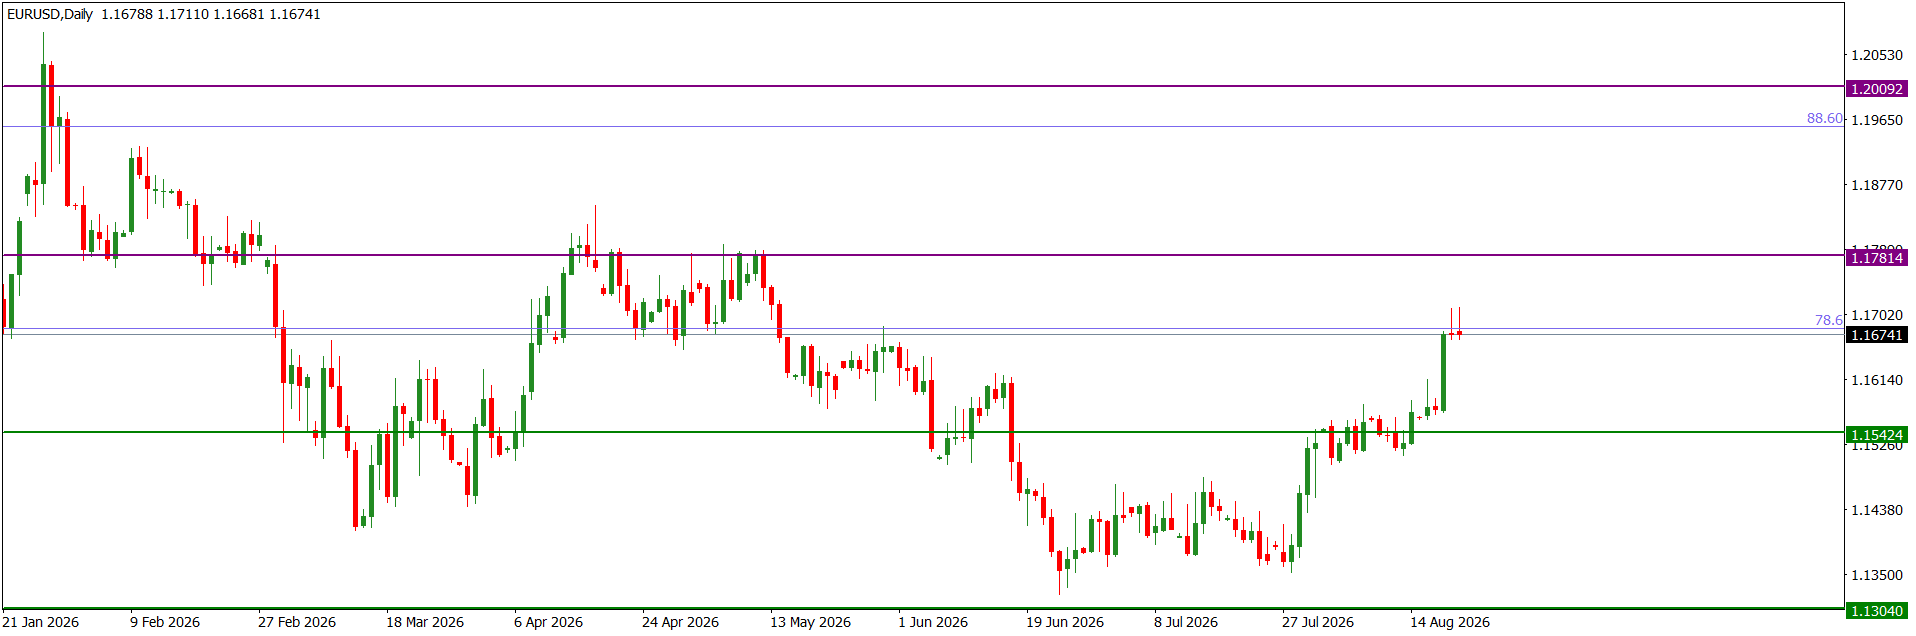
The EURUSD price action on the daily time frame is presently sideways at the 1.16840 intra-day horizontal resistance. Price action drove to the area on Wednesday before turning sideways. The area aligns with the 78.6 fib retracement of the bearish swing traceable to May 2021. Recent technical prints favour further northward price action.

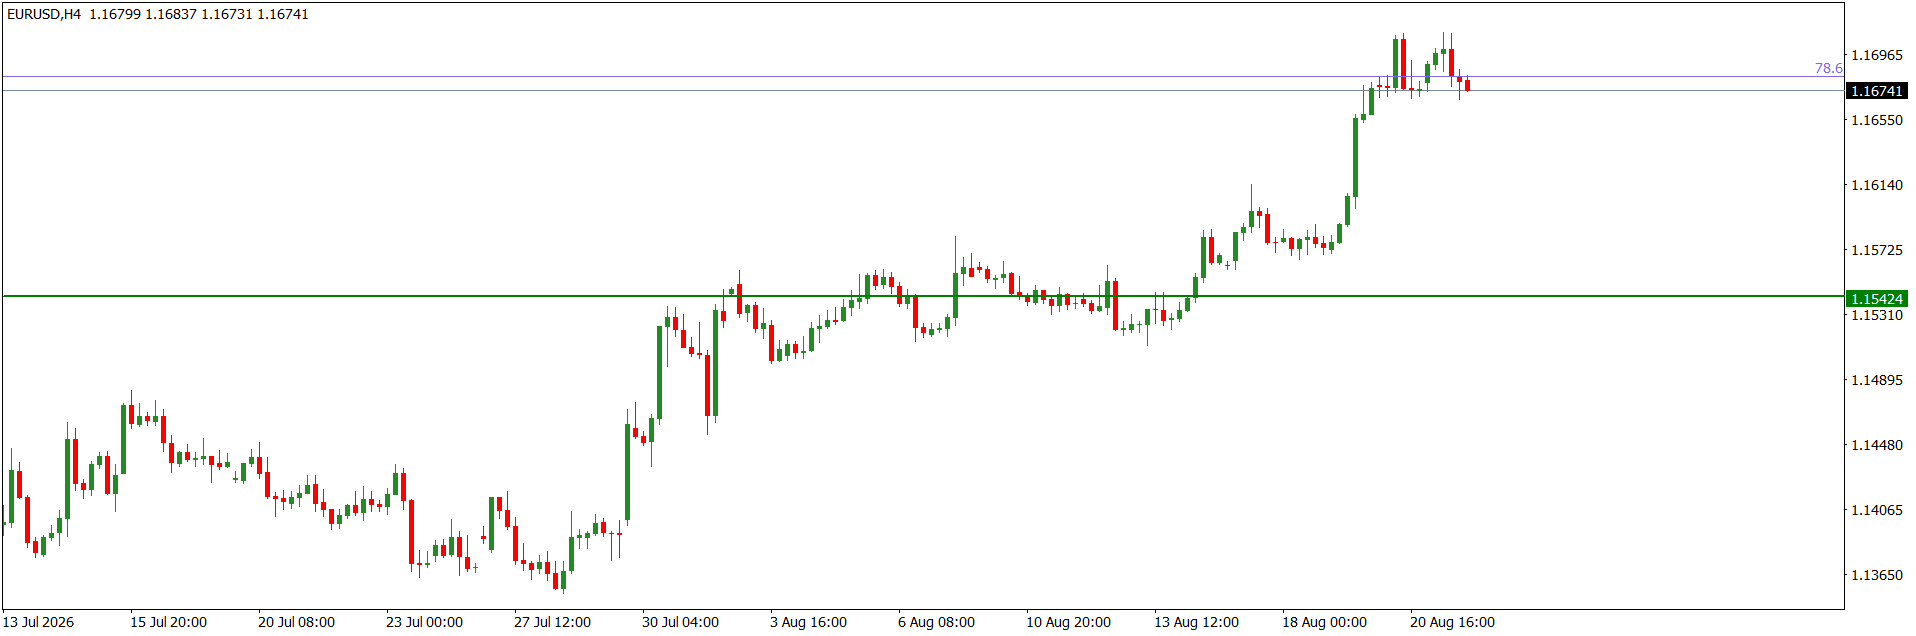
The EURUSD price action on the H4 time frame is in consolidation around the 1.16840 intra-day horizontal resistance. The area aligns with the 78.6 fib retracement of the bearish swing traceable to May 2021. Although the preceding technical impulse is bullish, we cannot rule out a bearish dip before further northward drive. This may target the next significant horizontal resistance, which is at 1.17810 area.

I may be wrong. Trade safe and prosper.

Trap

GBPUSD Weekly Technical Outlook

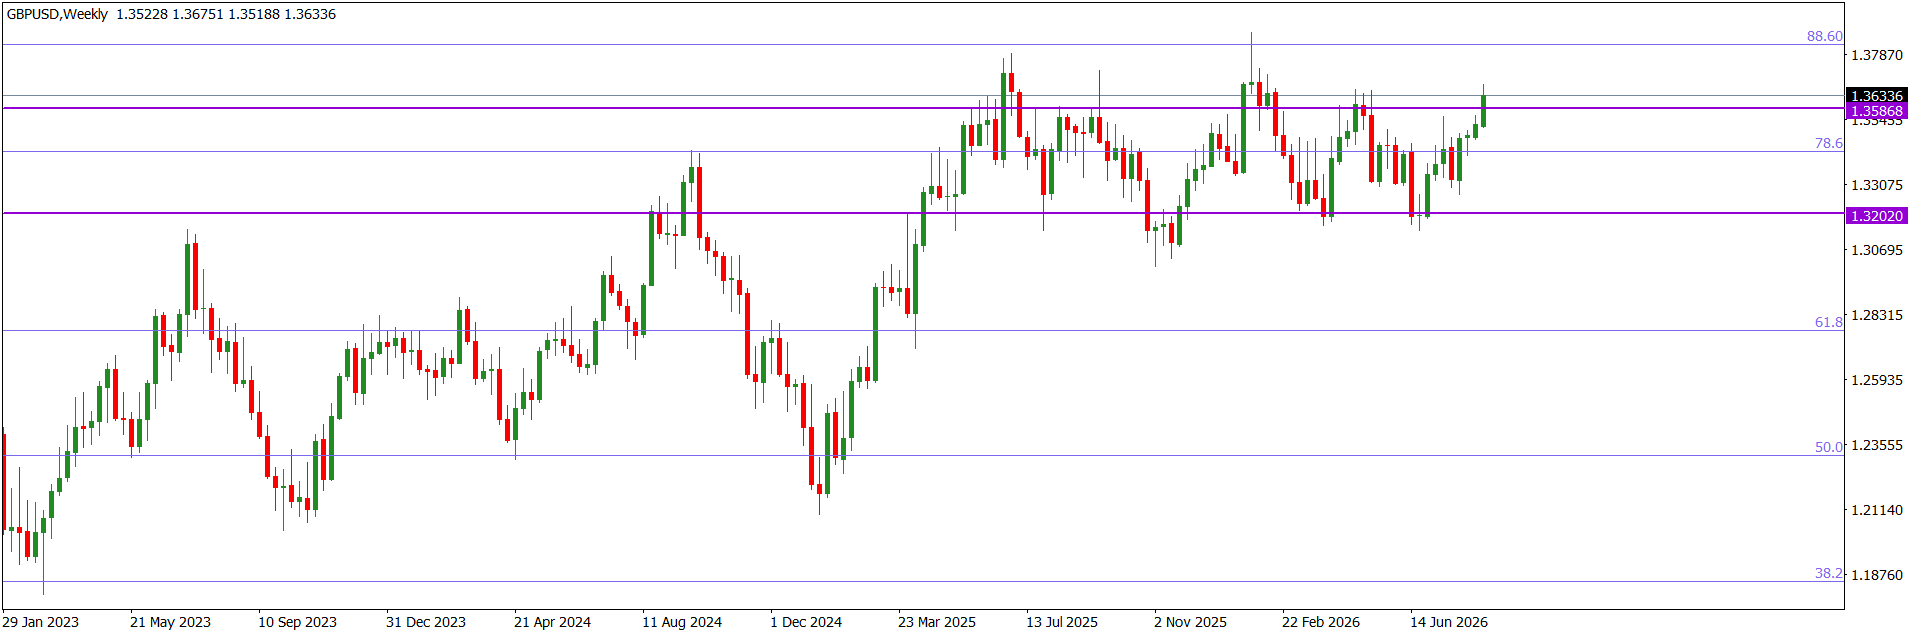
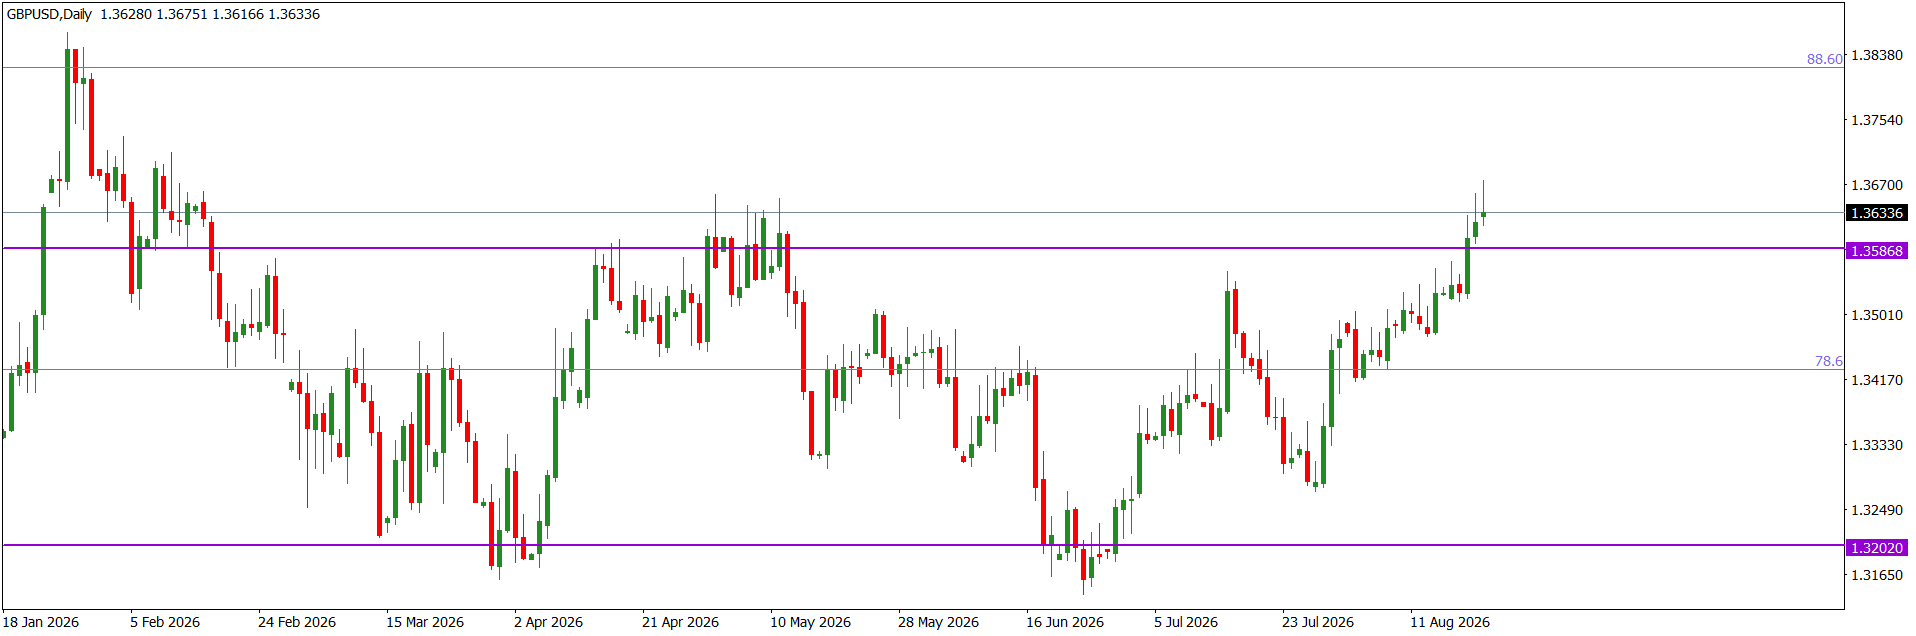
Last week, the GBPUSD market operation on the weekly time frame printed a bullish candlestick. The candlestick broke above the 1.35670 horizontal resistance to retest the nearby horizontal resistance at the 1.36340 area. We may still see further northward market operation as there a ‘W’ pattern is in play. This may see the market operation retest the 1.38400 area; an area which aligns with the 88.6 fib retracement of the bearish swing traceable to May 2021.

On Friday, the GBPUSD price action on the daily time frame retested the 1.36340 intra-day horizontal resistance before turning sideways. The preceding technical impulse favours further northward price action.

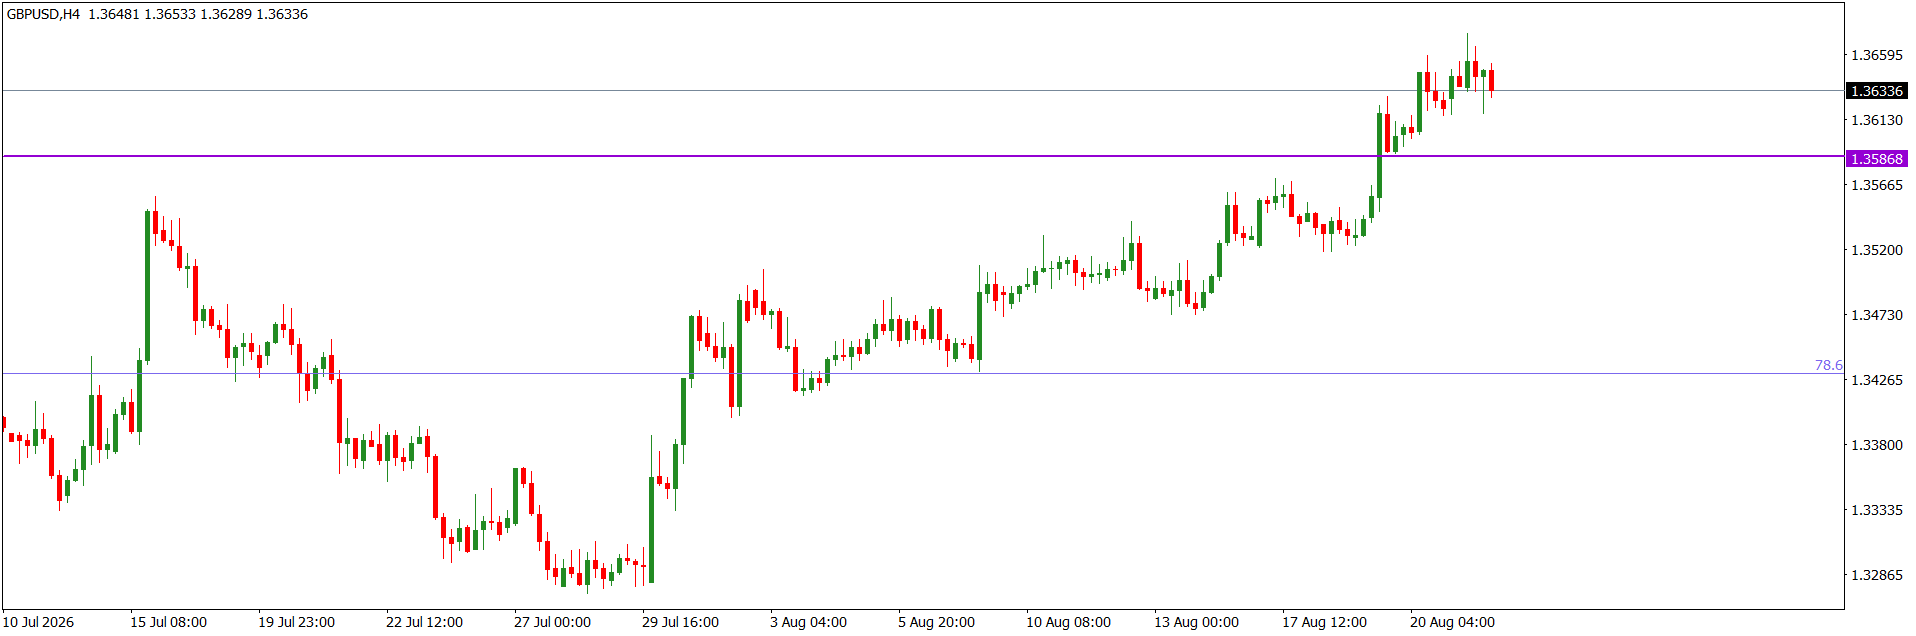
The GBPUSD price action on the H4 time frame is in consolidation. But the technical impulse favours bulls more than bears. So, we may still see further northward price action. However, the bigger technical structure is bearish; the price action is within the upper part of the 78.6/88.6 fib-retracement zone of the bearish swing traceable to May 2021.

I may be wrong. Trade safe and prosper.

Trap

USDJPY Weekly Technical Outlook

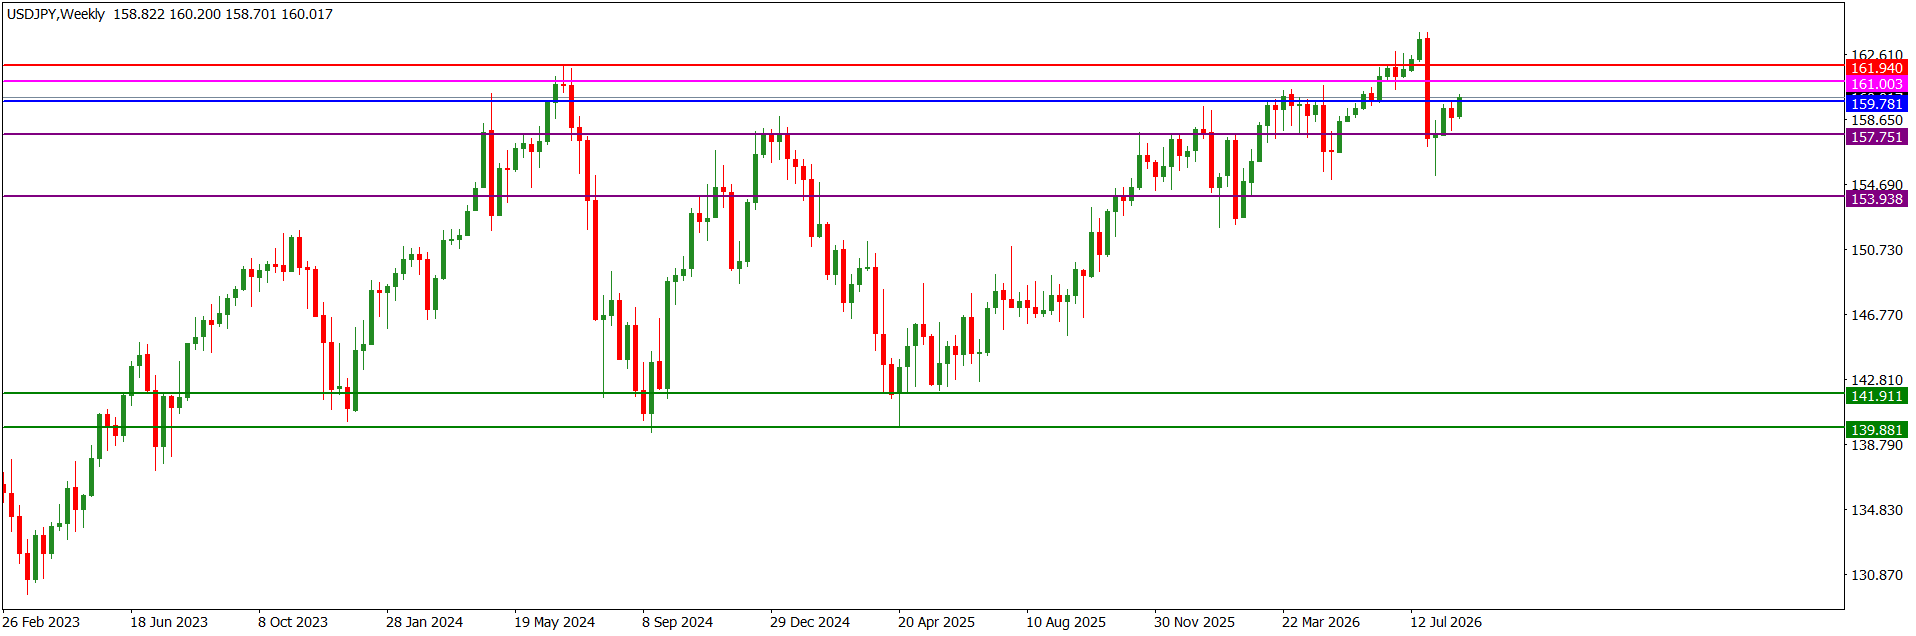
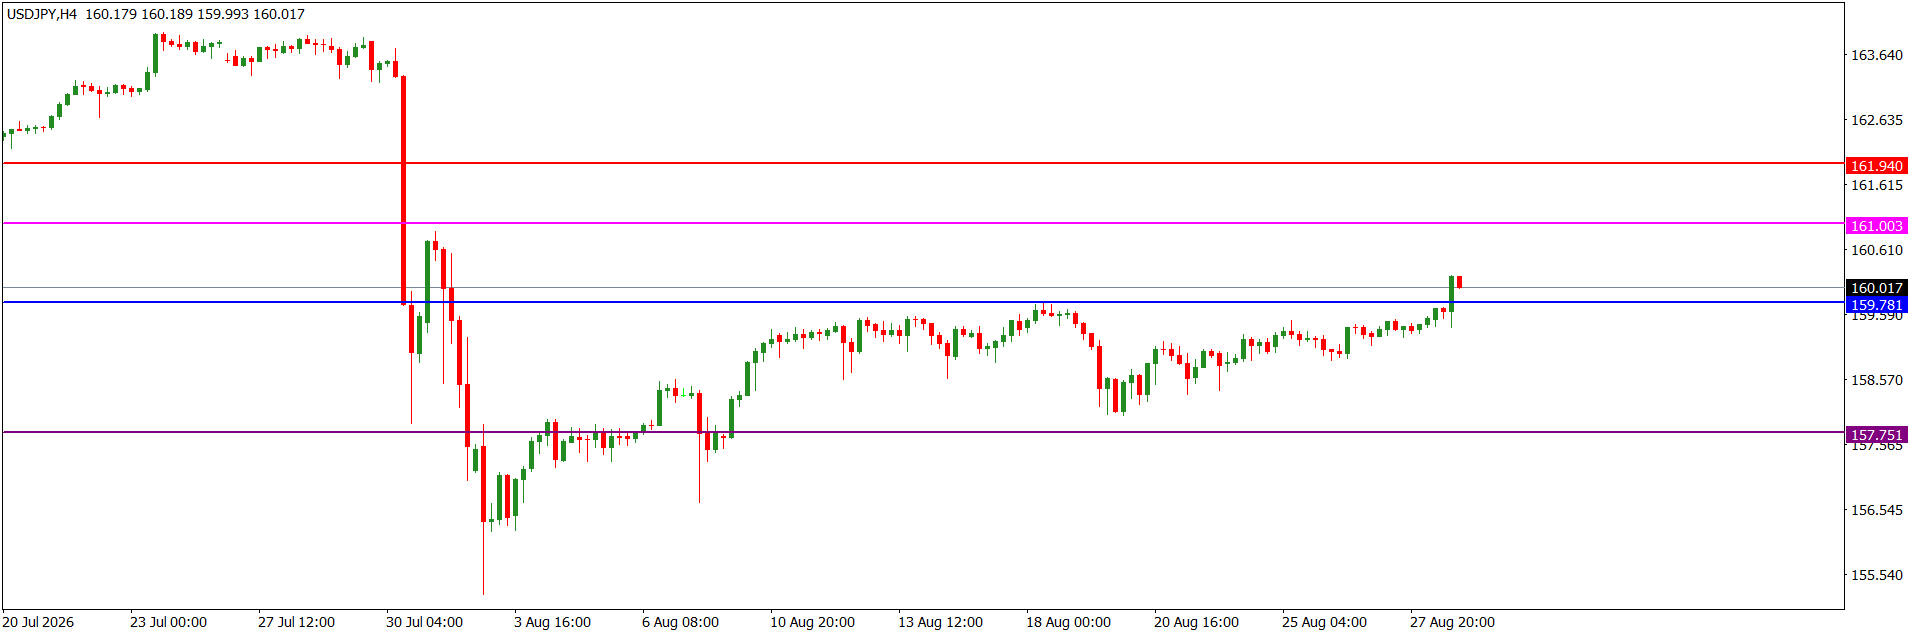
Last week, the USDJPY market operation on the weekly time frame printed a relatively small bullish candlestick. Presently, the market operation is at the 160.000 horizontal resistance area. But recent technical prints favour further northward market operation.

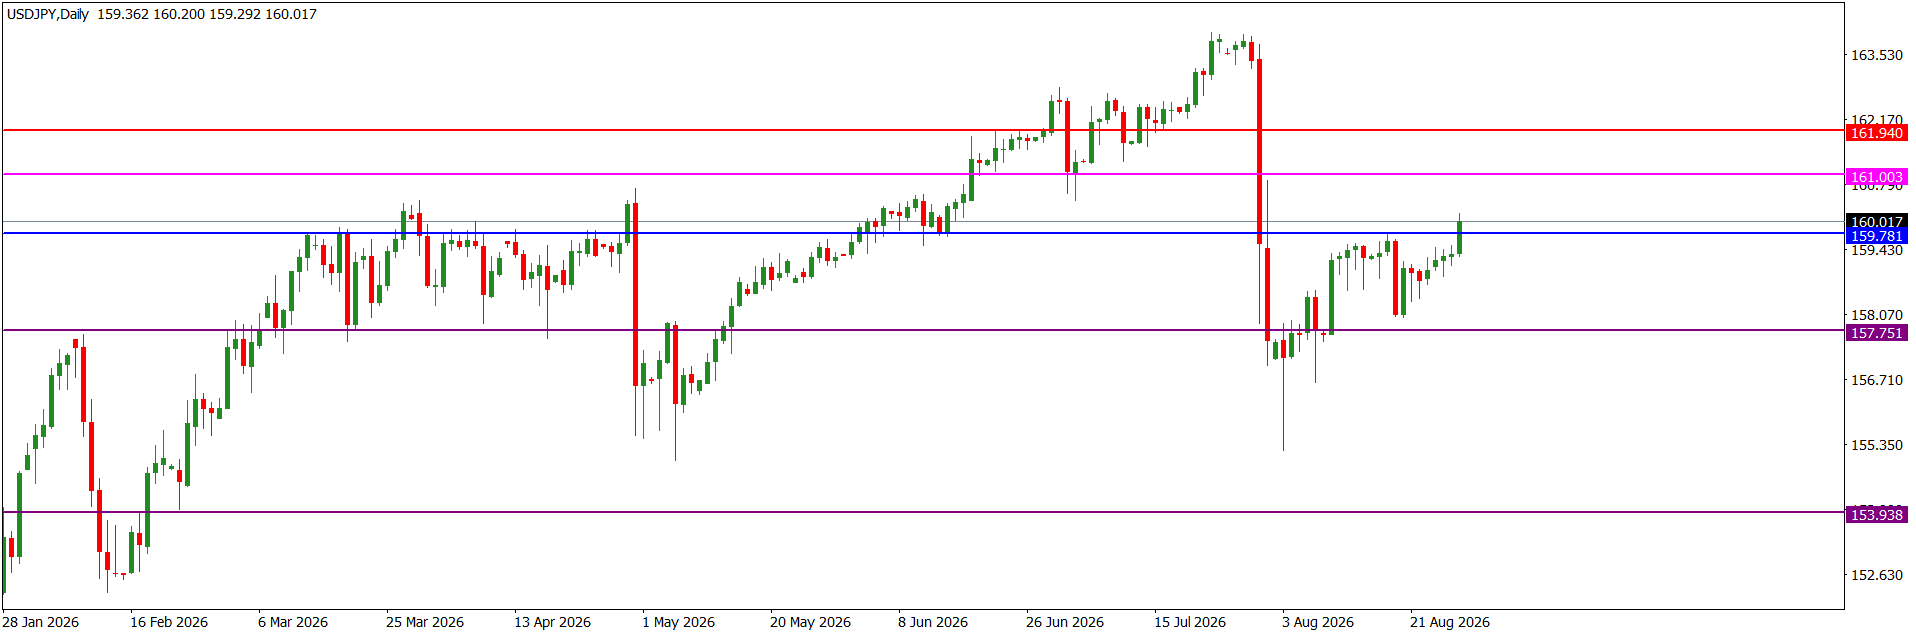
The USDJPY price action on the daily time frame retested the 160.000 intra-day horizontal resistance. Recent technical prints favour further northward price engineering in the early part of this week.

On Friday, the USDJPY price action on the H4 time frame went sideways at the 160.000 intra-day horizontal resistance after a bullish retest. Recent technical prints favour further northward price engineering in the early part of this week.

I may be wrong. Trade safe and prosper.

Trap

EURUSD Weekly Technical Outlook

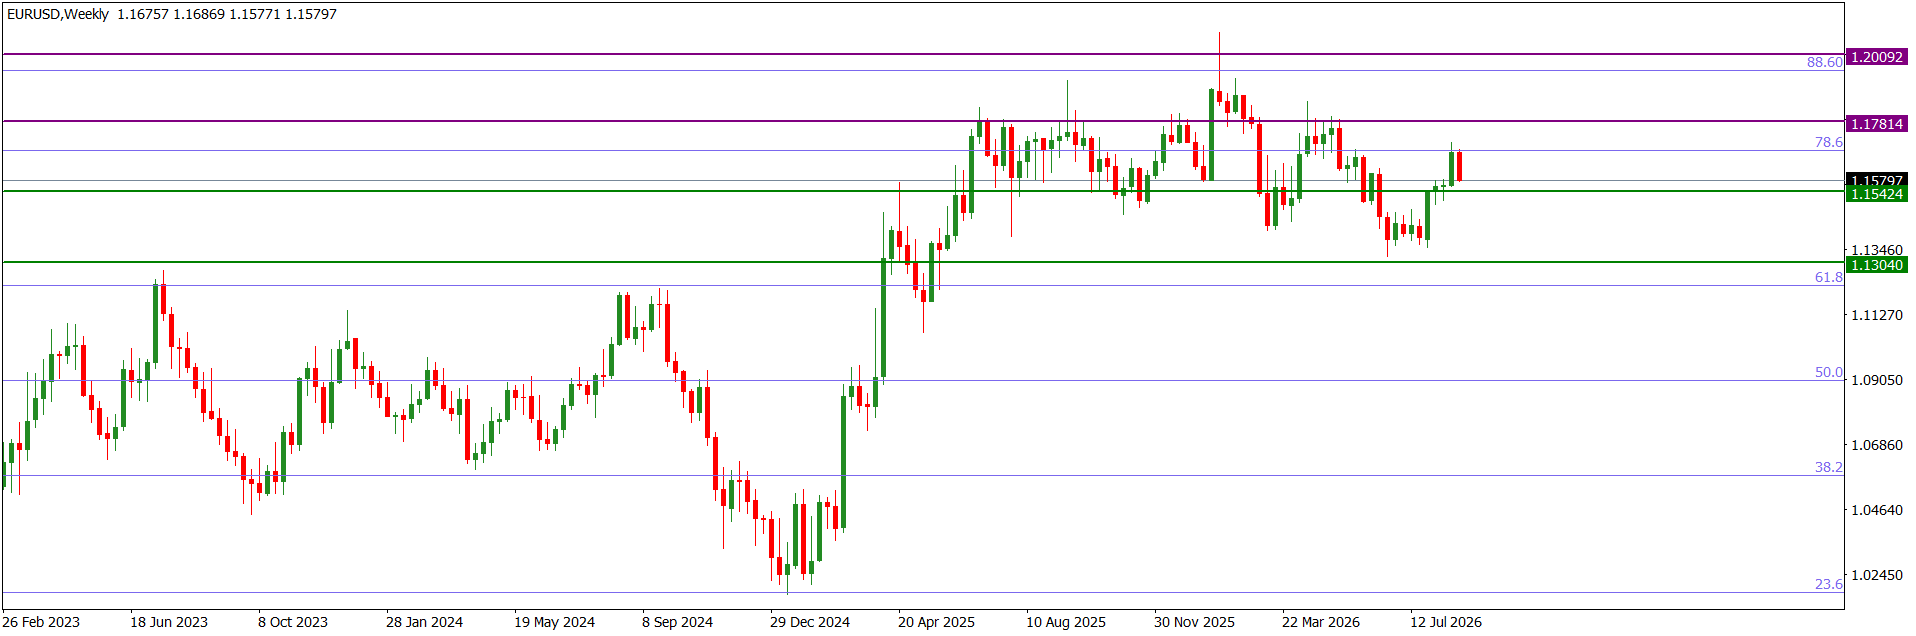
Last week, the EURUSD market operation on the weekly time frame printed a bearish candlestick. However, technically, the market operation is in consolidation as the candlestick printed two weeks ago was bullish, but the bearish candlestick printed last week did not close below the low of the bullish candlestick printed two weeks ago.

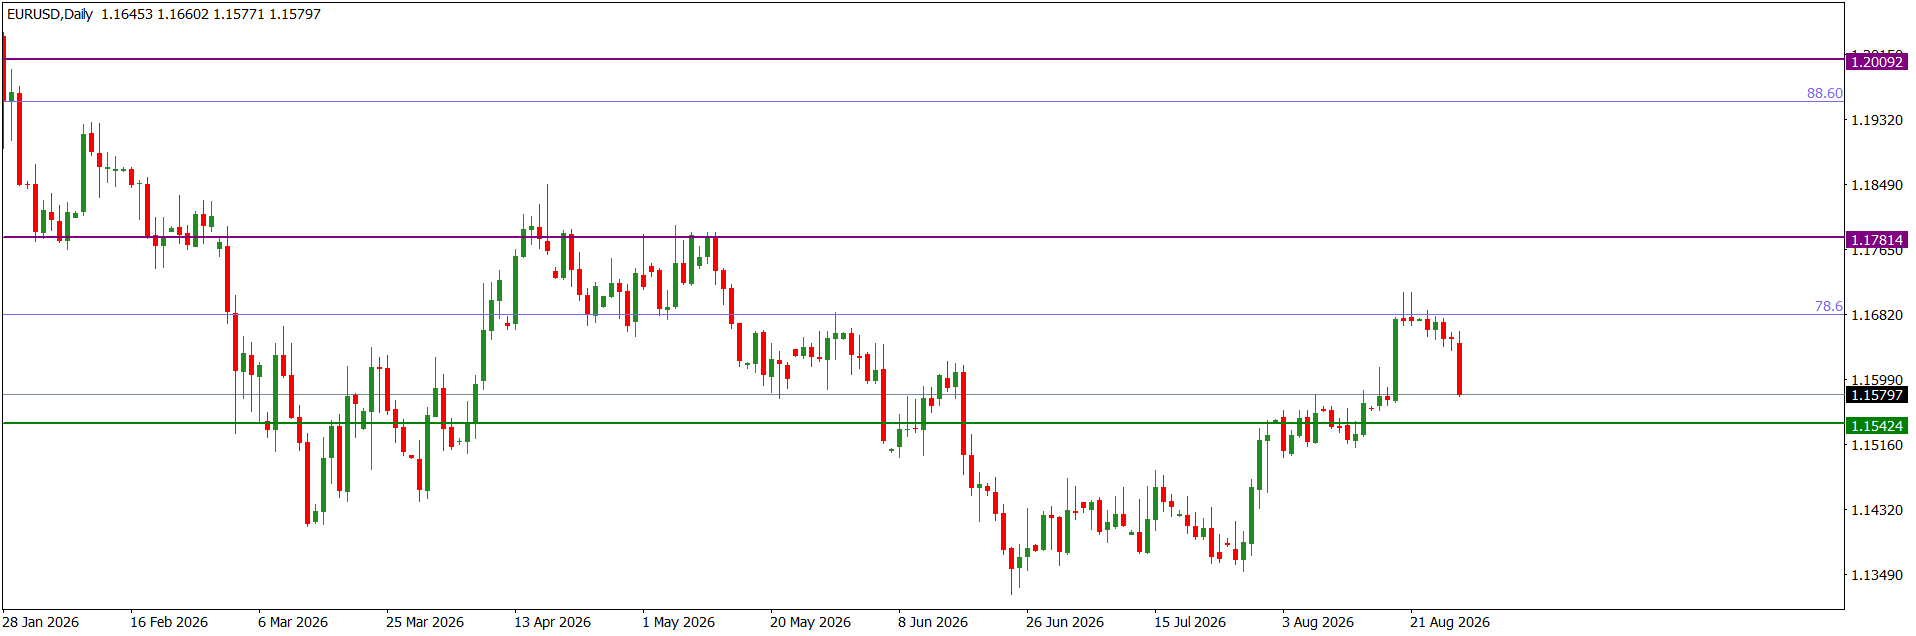
The EURUSD price action on the daily time frame issued a relatively moderate bearish candlestick on Friday to retest the 1.15800 intra-day horizontal support. Technically, the price action is in consolidation and we may see a bullish challenge in the early part of this week.

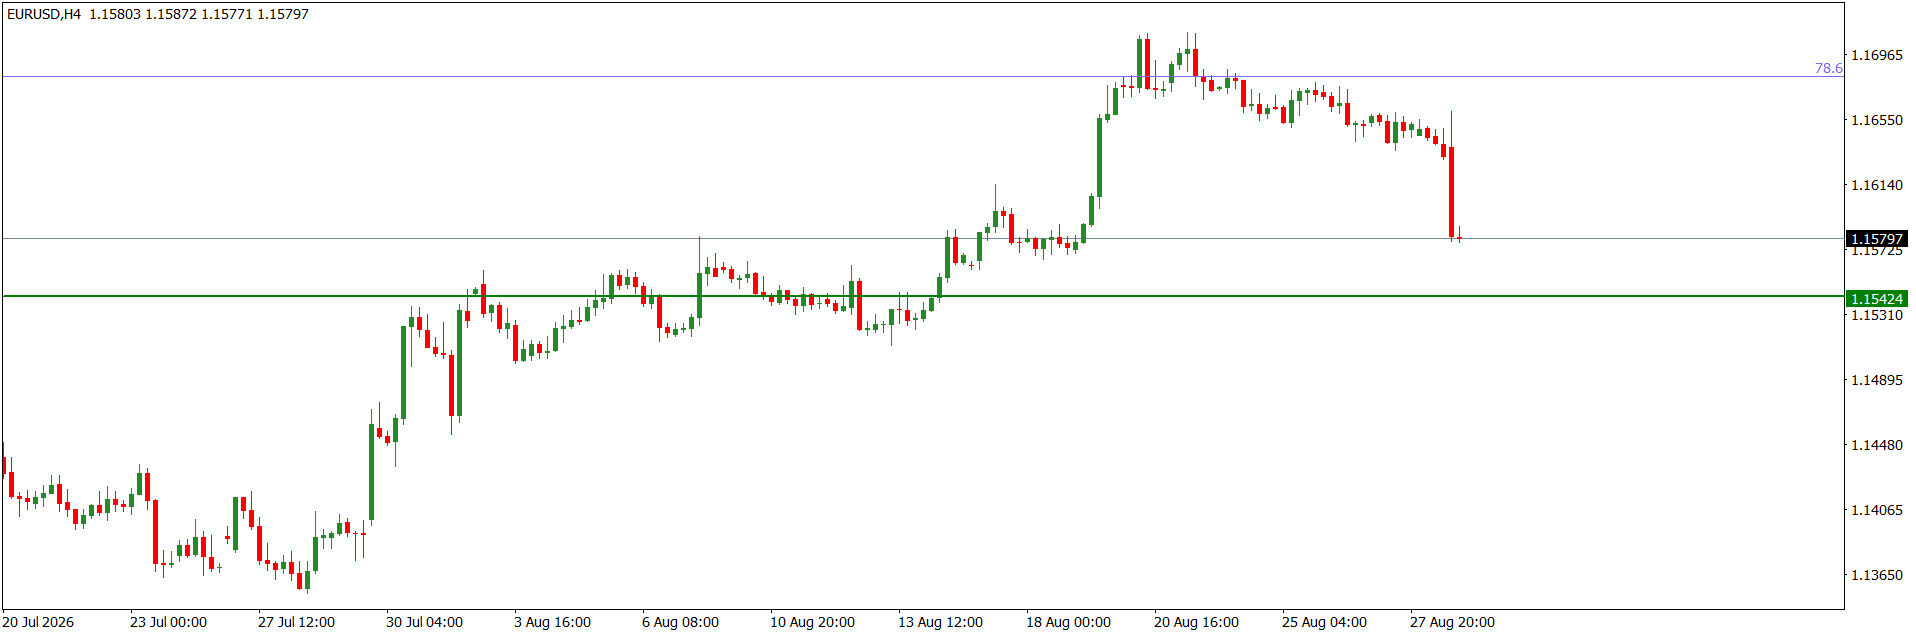
The EURUSD price action on the H4 time frame went sideways at the 1.15800 intra-day horizontal support after a bearish retest on Friday. Technically, recent technical patterns favour bullish challenge of further bearish price action. And we may soon see northward price engineering this week.

I may be wrong. Trade safe and prosper.

Trap

GBPUSD Weekly Technical Outlook

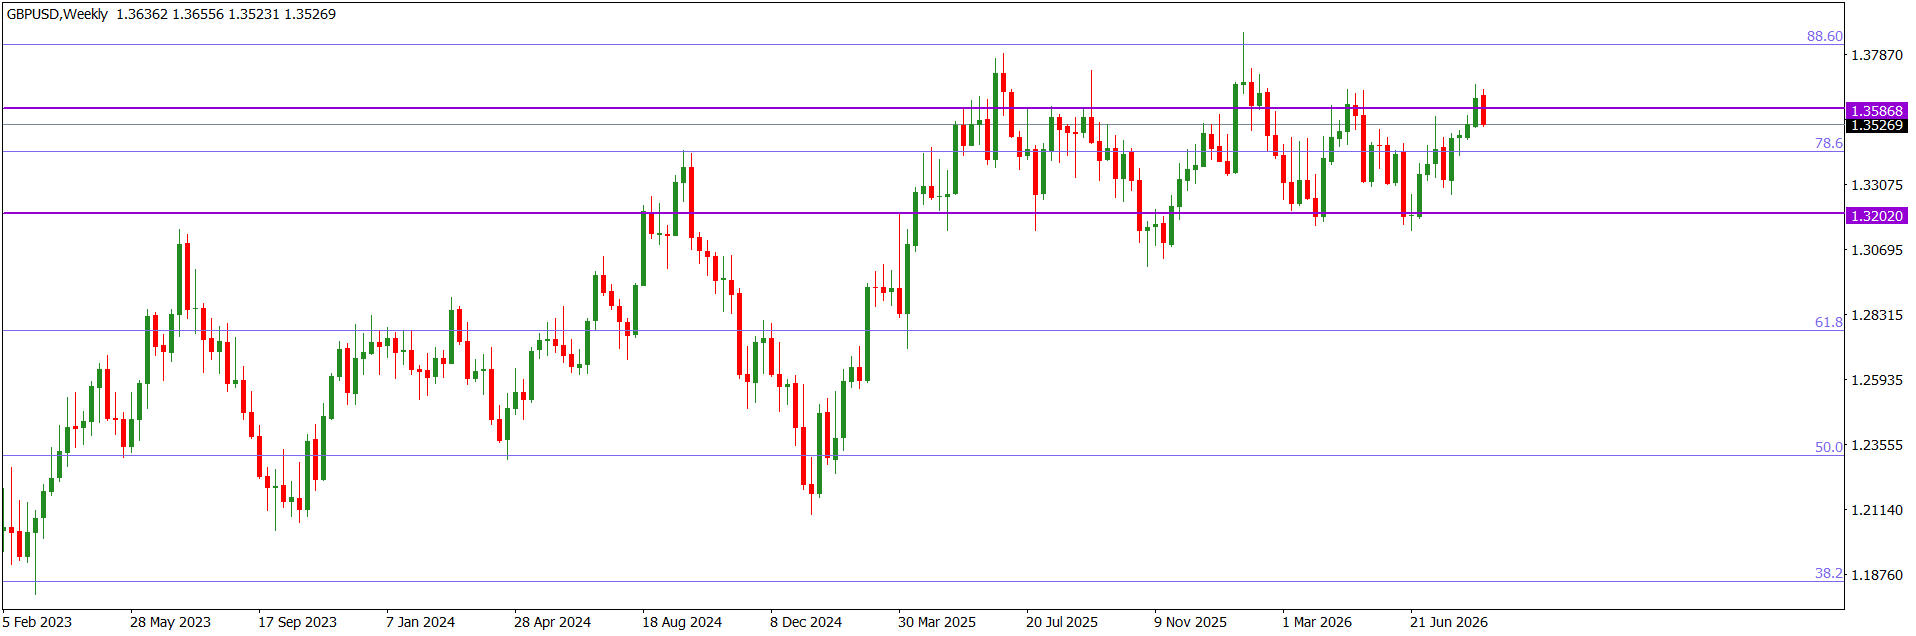
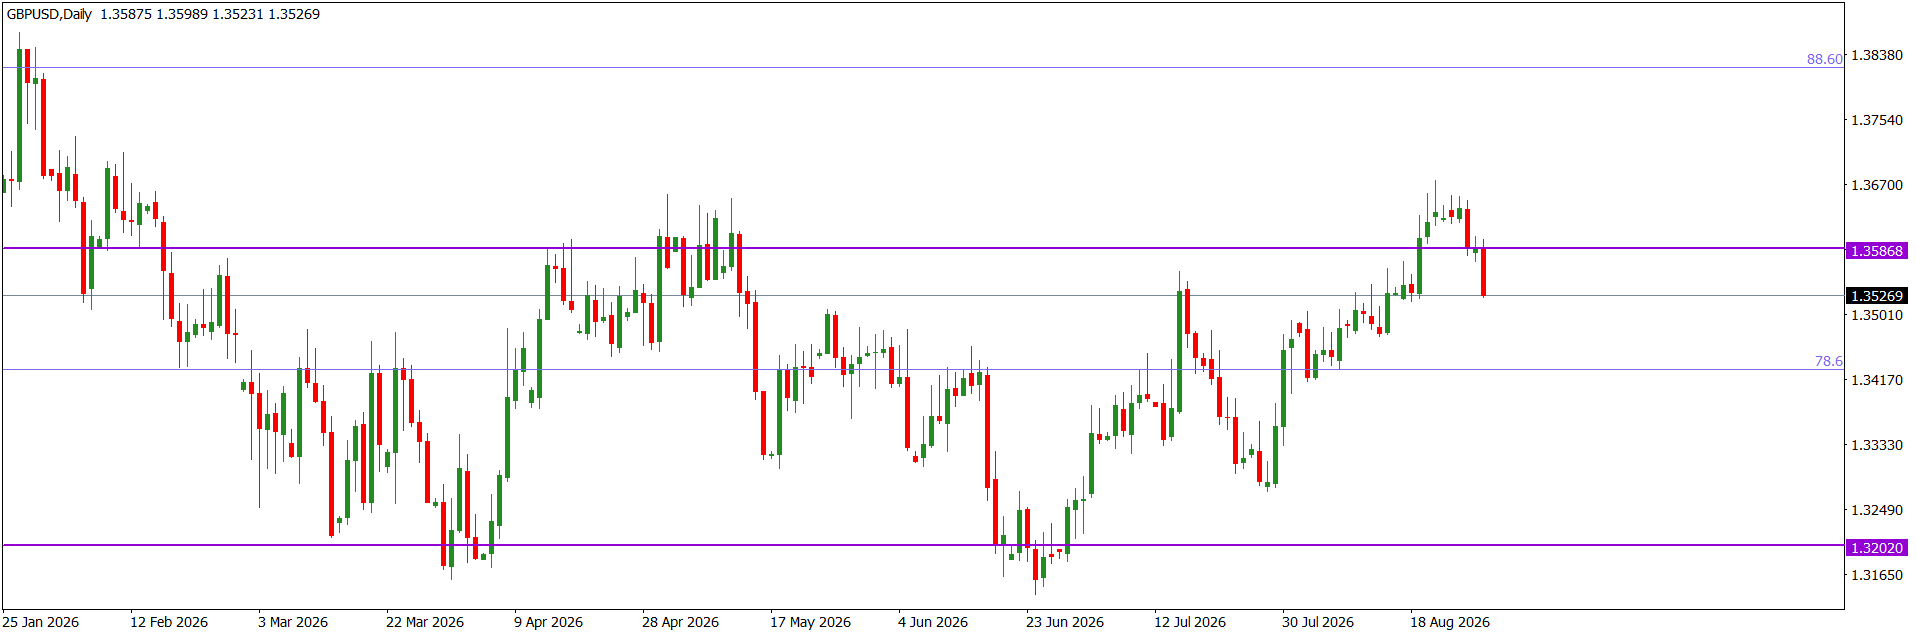
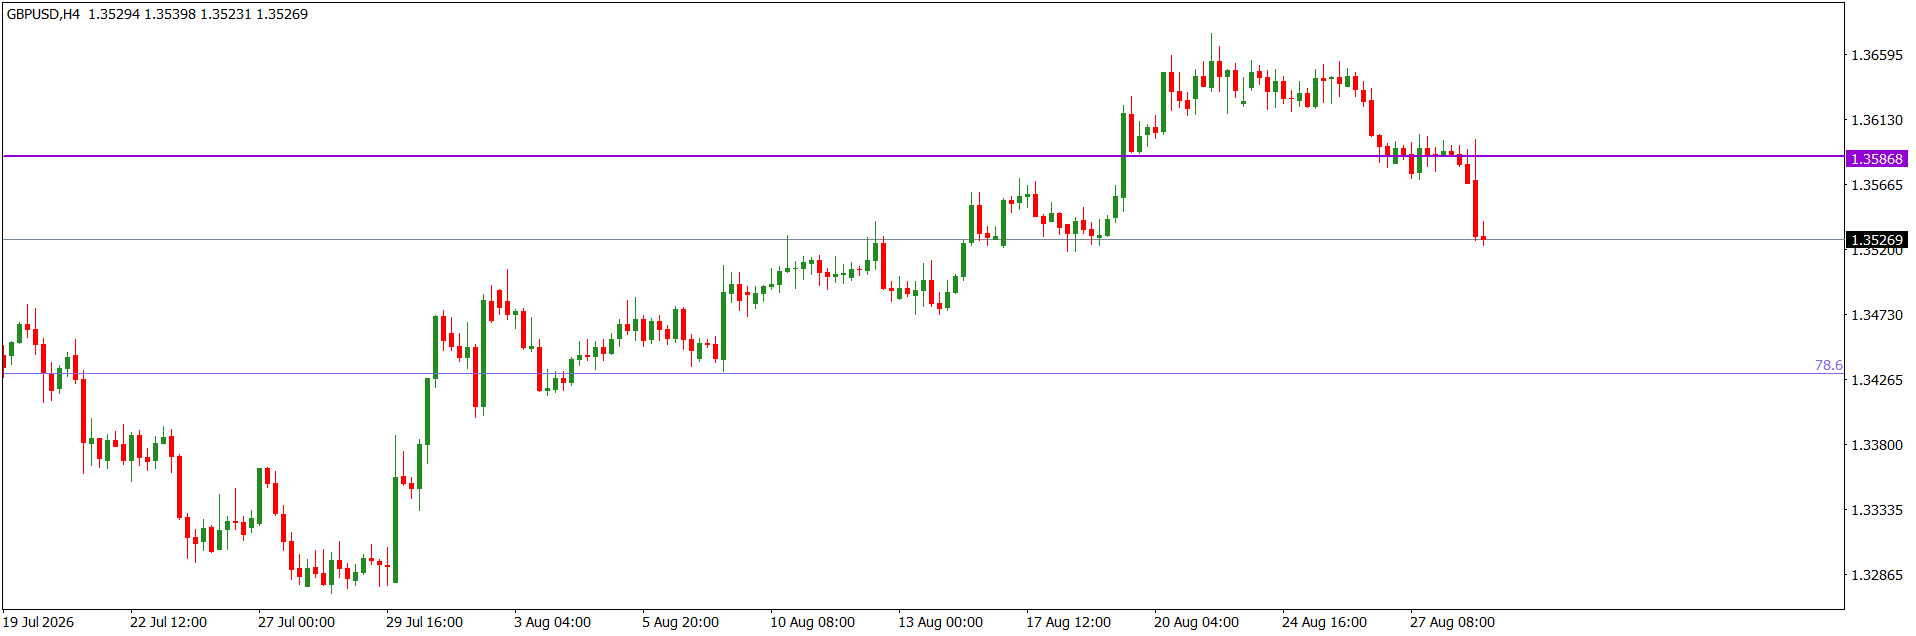
Last week, the GBPUSD market operation on the weekly time frame printed a bearish candlestick. However, technically, the market operation is in consolidation as the candlestick printed two weeks ago was bullish, but the bearish candlestick printed last week did not close below the low of the bullish candlestick printed two weeks ago. Also, the emerging ‘W’ formation favour bullish market operation this week.

The GBPUSD price action on the daily time frame issued a relatively moderate bearish candlestick on Friday to retest the 1.35270 intra-day horizontal support. Technically, the price action is in consolidation and we may see a bullish challenge in the early part of this week.

The GBPUSD price action on the H4 time frame went sideways at the 1.35270 intra-day horizontal support after a bearish retest on Friday. Recent technical prints favour further bullish price action. So, any bearish price action is likely to be short-lived.

I may be wrong. Trade safe and prosper.

Trap

The US dollar currently holds the upper hand, as Kevin Warsh’s hawkish remarks at Jackson Hole have boosted expectations for a Federal Reserve rate hike in September. The probability of a 25-basis-point increase has risen to approximately 57%, up from around 36% previously. However, the ECB has strong support; ECB minutes indicate that a September rate hike remains a possibility, given that inflation stays high. Market focus this week is on Friday’s NFP data release.

Rising Yields Pressure Global Markets (09.02.2026)

The 10-year Treasury yield climbed above 4.8%, approaching its highest since October 2023, as rising oil prices lifted inflation concerns and September Fed hike odds to around 70%. Oil gained for a third session as US-Iran hostilities intensified, while Barr reinforced the case for further tightening if inflation persists.

US stock futures steadied after a third straight decline, with the Dow down 0.79%, S&P 500 0.71%, and Nasdaq 1.03% on Tuesday. Rising oil and bond yields drove the pressure, while ADP, the Fed’s Beige Book, and earnings from Broadcom, HP, and Snowflake are next.

The Dollar Index climbed above 99.7, its highest in nearly three weeks, as surging oil prices pushed September Fed hike odds to around 70%. Fed Governor Barr said further hikes may be needed if inflation persists, with ADP and Friday’s jobs report next.

Japan’s 10-year yield topped 3% for the first time since 1996, driven by higher oil prices, BOJ hike expectations, and concerns over the Takaichi administration’s spending and tax-cut plans. Bessent also urged Ueda to take “decisive” steps against yen weakness.

Economic Calendar

Euro Dips Under $1.16

The euro traded just below $1.16 as investors digested fresh Eurozone inflation data. Driven by Middle East conflict and rising energy costs, annual inflation rose to 3.3% in August, hitting its highest mark since late 2023.

Markets now price the ECB deposit rate reaching 2.70% by December, with an 80% chance of a second rate increase, while the US dollar held steady.

The first resistance is positioned at 1.1630 while the support starts from 1.1550.

Gold Drops to $4,300

Gold fell to roughly $4,300 on Wednesday, marking its fourth consecutive daily loss and reaching a three-week low. Rising bond yields, high oil costs, and hawkish Fed comments lifted September rate-hike odds to nearly 70%.

Markets are now focused on upcoming US employment data, while ongoing US-Iran tensions continue to support energy prices.

First resistance is seen at $4330, with initial support near $4260.

Yen Crosses 160 Mark

The Japanese yen weakened past 160 per dollar on Wednesday, dropping to a one-month low and giving back two-thirds of its recent intervention gains. High energy costs, fiscal pressures, and rate gaps keep the currency down.

While US and Japanese officials agreed to coordinate on exchange stability, calls for decisive action have strengthened expectations for a Bank of Japan rate hike.

First resistance is seen at 160.80, with initial support near 159.50.

Sterling Drops Below $1.35

GBP/USD fell to around $1.3496, extending its losses past the 1.3500 threshold as hawkish comments from Fed Chair Warsh drove broad dollar demand. Rising UK public sector borrowing added pressure on sterling, while strong US manufacturing PMI data carried expectations for elevated Fed interest rates, steering capital away from European currencies.

From a technical view, resistance stands near 1.3590, with support around 1.3470.

Silver Falls Below $64 Amid Rising Yields

Silver fell below $64 on Wednesday, extending losses as rising bond yields and energy costs drove up Fed rate-hike expectations. Hawkish comments from Kevin Warsh lifted September hike odds near 70%.

Markets are now focused on upcoming US employment reports, while escalating US-Iran conflict continued to push oil prices higher.

From a technical view, resistance stands near $64.40, while support is located around $62.50.

Bitcoin (BTC/USD)

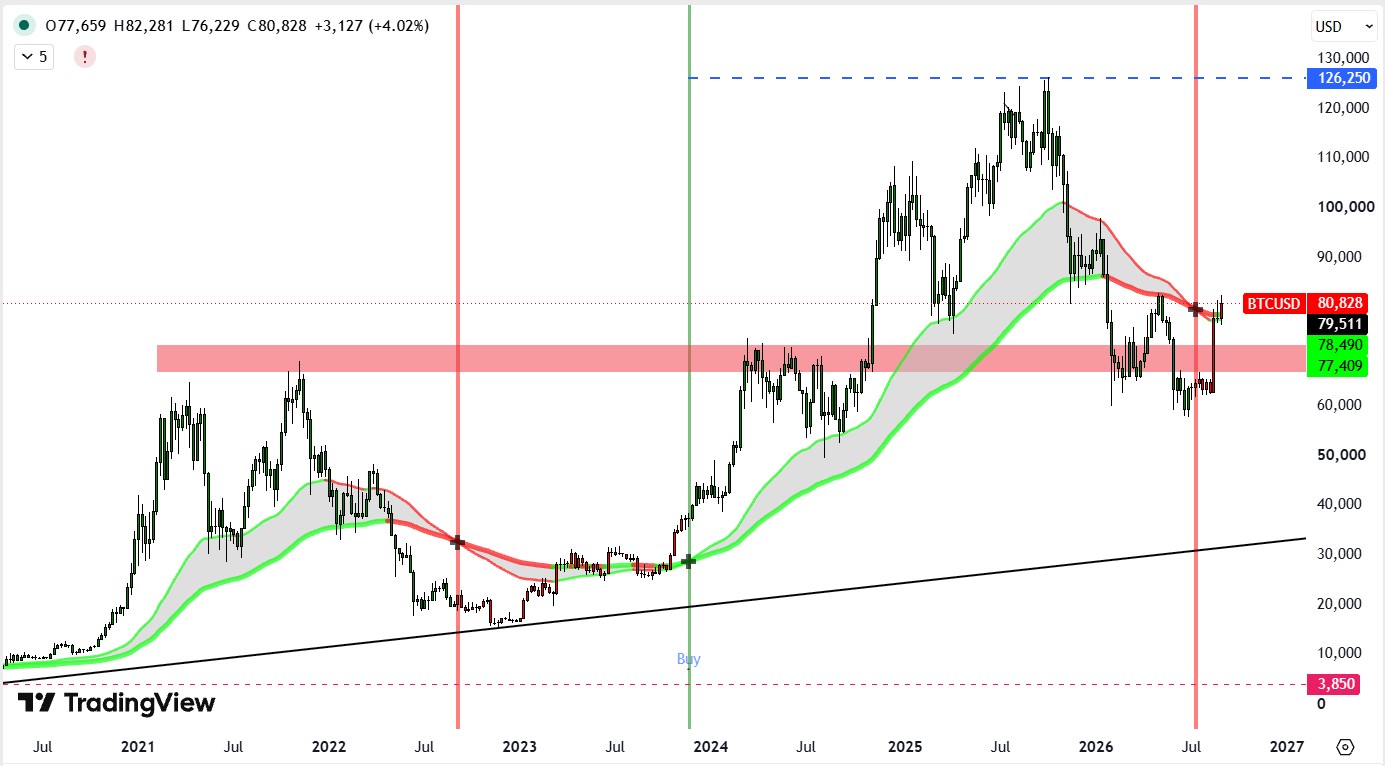
Bitcoin traded near $78,742, retreating from its recent $81,350 high as hawkish Fed expectations encouraged profit-taking.

MicroStrategy added roughly 4,600 BTC, taking its total holdings to 845,050 BTC, while BlackRock’s spot Bitcoin ETF reached $98.6 billion in assets, showing continued institutional demand despite tighter monetary expectations.

First resistance is seen at 81,400, with initial support near 75.500.

Brent Crude Oil

Brent climbed above $95, rising for a third session to a six-week high as US-Iran hostilities increased the threat of energy disruptions.

The US launched new strikes near Hormuz following Iranian mine-laying attempts and an attack on a base, while Trump threatened a larger response to further retaliation.

Bessent described Iran’s economy as being in an “acceleration phase” of bankruptcy and said 17 million barrels passed through Hormuz on Monday.

Resistance is seen at 97.17, while the nearest support stands at 93.00.

Nasdaq 100

The Nasdaq 100 fell 1.29% to 29,077, breaking below key support as global bond yields climbed and the US 10-year Treasury yield reached 4.79%.

Brent’s rise above $92 added to inflation concerns, while Warsh’s hawkish comments strengthened September Fed hike expectations and pressured tech stocks.

Resistance stands at 29,800, while the nearest support is located at 29,000.

Offshore Chinese Yuan

USD/CNY traded near 6.7230, extending its decline as strong export settlement and corporate dollar selling supported the yuan.

The PBOC set its official reference rate slightly higher to limit volatility while signaling comfort with further yuan appreciation. Higher US Treasury yields had limited impact as structural inflows supported the Chinese currency.

Resistance stands at 6.7300 while the nearest support is located at 6.7120.

Downward pressure on the EUR/USD pair persists, driven by market expectations of a more hawkish Federal Reserve stance amidst stubbornly high US inflation. The Beige Book indicates ongoing price increases across most US regions, while markets price in a 65% probability of an interest rate hike.

However, the outlook for the Euro is not entirely bearish. Eurozone inflation is hovering near or above 3%, and there have been indications that the European Central Bank (ECB) might consider a rate hike in September. Meanwhile, rising oil prices and the US-Iran conflict are fueling concerns about global inflation; these factors tend to bolster the US dollar by reinforcing expectations of tighter Federal Reserve policy.

Dovish Fed Lifts Metals as Dollar Pauses (09.04.2026)

The US 10-year yield eased to around 4.76% after reaching three-year highs as Waller said he would support holding rates if inflation keeps cooling. September hike odds dropped to roughly 50% from 63%. The jobs report is next, while oil heads for a strong weekly gain as Middle East tensions and Hormuz shipping uncertainty persist.

US stock futures held steady before the August jobs report after Thursday’s rally, when the Dow gained 1.18%, S&P 500 1.06%, and Nasdaq 1.4% as Treasury yields eased. DocuSign rose 4% postmarket on strong Q2 results and higher guidance, while Lululemon plunged 18% after weak sales and a disappointing outlook.

Japan’s 10-year yield fell to around 2.9% for a second session as the global bond selloff eased and a successful 30-year JGB auction drew pension-fund demand. Takata floated outsized or back-to-back hikes, while Ueda flagged upside inflation risks. A quarter-point hike this month and another in December are expected.

The Dollar Index held near 99 after a sharp decline, pressured by Waller’s dovish comments and a stronger yen as BOJ tightening expectations grew. With September hike odds down to 50% from 63%, the dollar is heading for a 0.7% weekly decline before the jobs report.

Economic Calendar

Time Cur. Event Forecast Previous
12:30 USD Average Hourly Earnings (MoM) (Aug) 0.3% 0.1%
12:30 USD Nonfarm Payrolls (Aug) 55K -23K
12:30 USD Unemployment Rate (Aug) 4.1% 4.1%

Euro Pauses Selloff Above $1.16

The euro edged slightly above $1.16, pausing its recent selloff as a strengthening yen weighed on the dollar. Easing energy prices provided brief relief after Brent crude pulled back from six-week peaks on comments suggesting a short-lived Iran conflict.

However, persistent inflation and fiscal worries keep the euro near multi-week lows, with markets fully pricing an ECB rate hike next week.

The first resistance is positioned at 1.1640 while the support starts from 1.1550.

Gold Holds Near $4,500

Gold hovered near $4,500 on Friday, posting gains for a second straight session after dovish remarks from Fed Governor Waller lowered September rate-hike odds to 50%. Waller indicated a preference for holding rates steady if inflation continues to cool.

The resulting decline in the US dollar and Treasury yields provided strong support for bullion, while oil advanced on persistent Middle East supply risks.

First resistance is seen at $4500, with initial support near $4450.

Yen Caps Strong Week

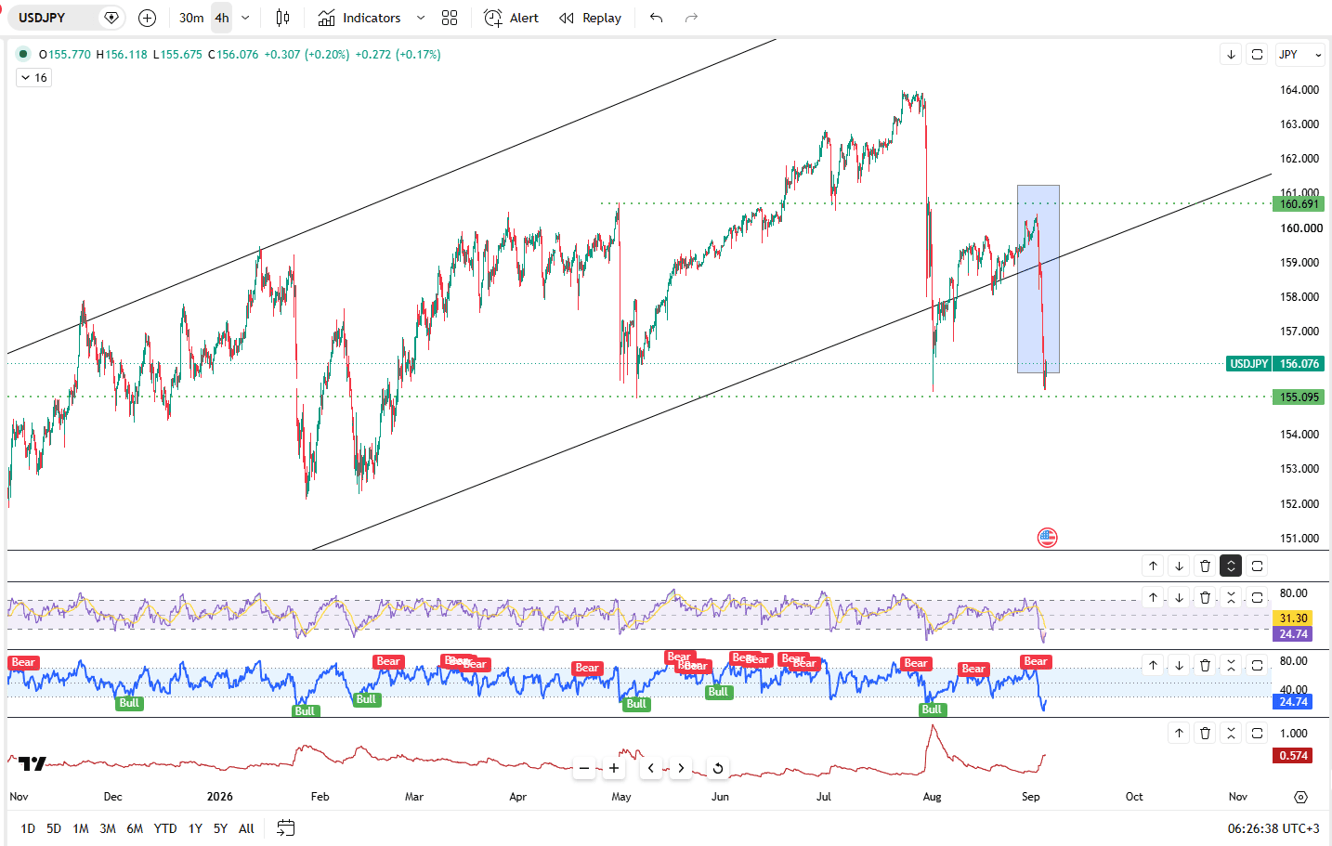
The Japanese yen hovered near 156 against the dollar on Friday, capping its best weekly gain of roughly 2.5% since July. While official intervention remains unconfirmed, speculation over recent rate checks supported the currency.

Investors now price in a quarter-point Bank of Japan rate hike this month and another in December, with broad dollar weakness after dovish Fed comments offering further support.

First resistance is seen at 158.00, with initial support near 155.10.

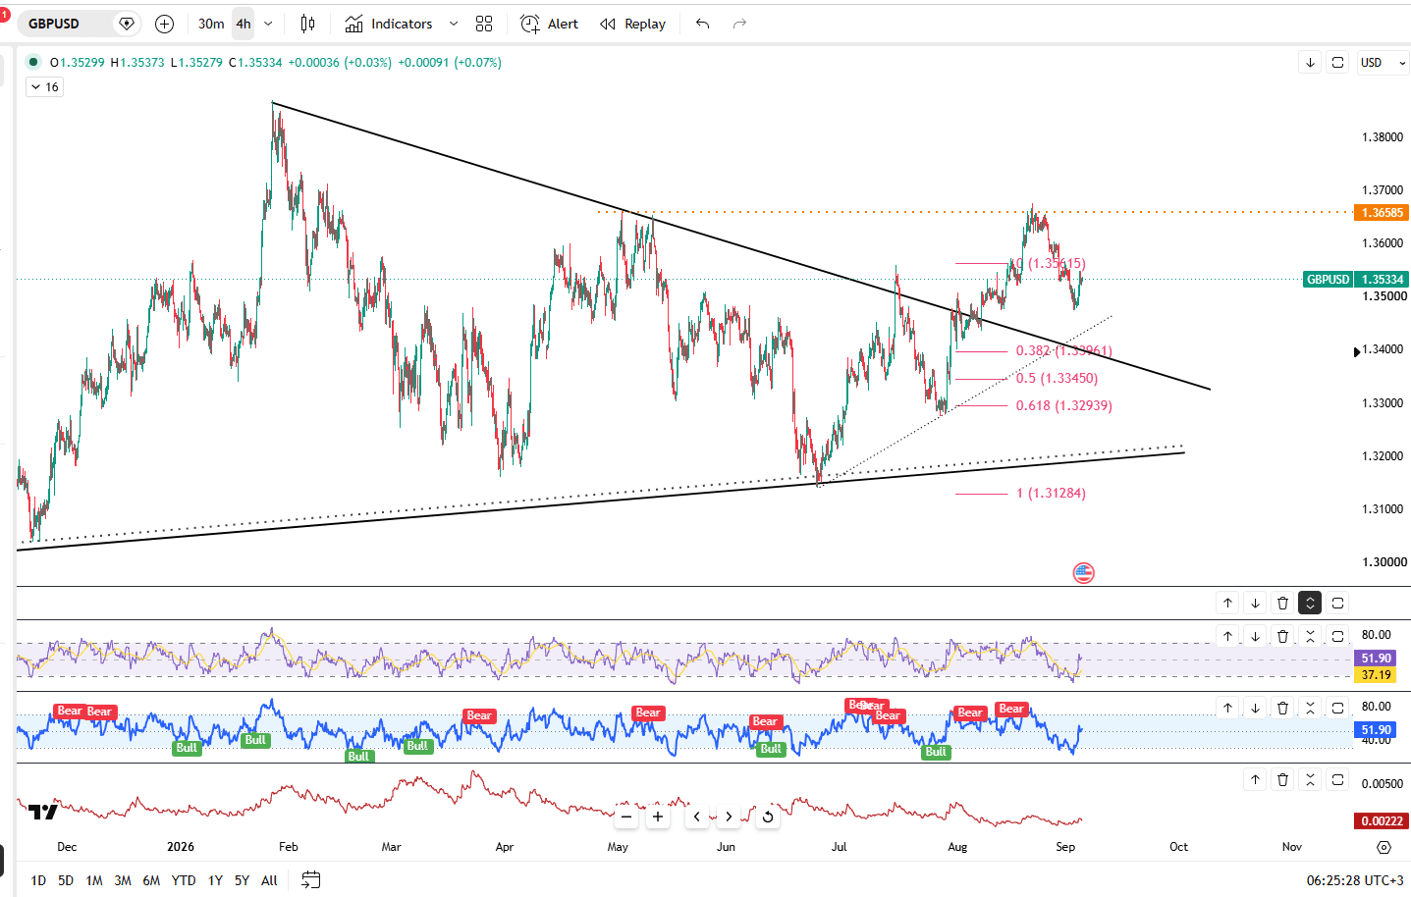
Pound Steadies Near 1.3530

GBP/USD rose toward 1.3530, recovering modestly from two-week lows. The pound drew support from BoE official Pill backing a rate increase to 4.00% and PM Burnham promising fiscal discipline.

Meanwhile, the recent US dollar rally stalled as traders pause ahead of key US payrolls data to gauge the Fed’s next policy moves.

From a technical view, resistance stands near 1.3590, with support around 1.3470.

Silver Rises Near $67

Silver climbed toward $67 on Friday, advancing for a second straight session after dovish remarks from Fed Governor Waller reduced September rate-hike expectations to 50%. Waller expressed support for holding interest rates steady if inflation continues to cool.

The resulting decline in the US dollar and bond yields supported precious metals, while energy prices posted strong weekly gains.

From a technical view, resistance stands near $68.50, while support is located around $66.00.

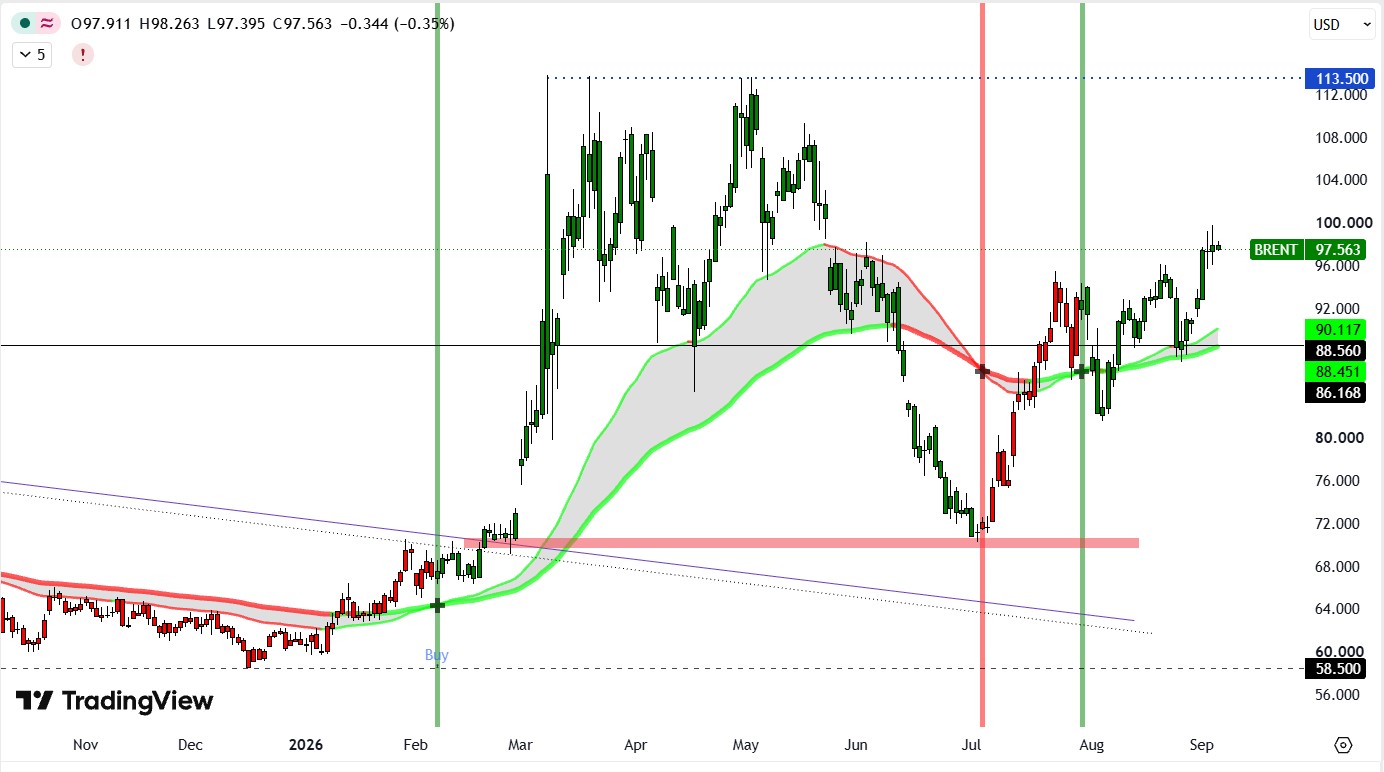
Brent Crude Oil

Brent crude climbed toward $96 Friday, on track for a ~9% weekly gain. US strikes on Iran prompted retaliation against American bases and Hormuz vessels, with transits falling to 6 on Wednesday from an 11-day average near 13.

Refinery damage in the region and Russia are expected to push prices higher into next year, with US diesel hitting its highest level since mid-2022.

Resistance is seen at 97.17, while the nearest support stands at 93.00.

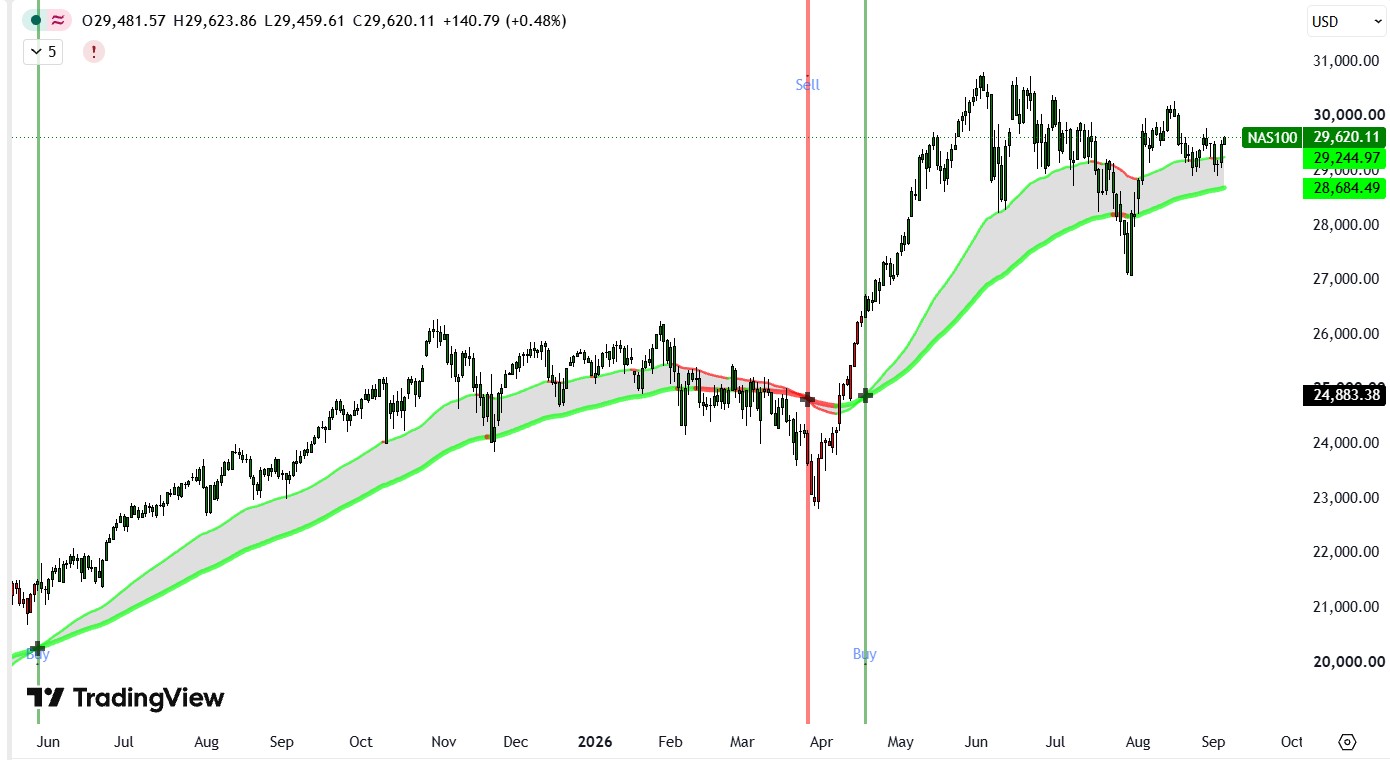
Nasdaq 100

The Nasdaq 100 trades near 29,482, snapping a three-session losing streak after Fed Governor Waller signaled he’d support holding rates steady if inflation data cooperates.

The 10-year Treasury yield retreated to 4.76% from near 4.80%, easing pressure on tech stocks.

Resistance stands at 29,800, while the nearest support is located at 28,900.

Offshore Chinese Yuan

The offshore yuan held near 6.71 per dollar, near its strongest since early 2023, as PMI data reinforced China’s recovery. Private Composite PMI rose to 52.1 from 50.8, with manufacturing and services both expanding. Official PMI improved to 49.5.

Dollar weakness after Waller’s dovish remarks also supported the yuan, with markets now awaiting next week’s trade and inflation data.

Resistance stands at 6.7300 while the nearest support is located at 6.7050.

Bitcoin (BTC/USD)

Bitcoin trades near $80,875, up 4.4% in 24 hours as dovish remarks from Fed Governor Waller reduced September hike odds from 70% to 50%, weakening the dollar and boosting risk assets.

Short liquidations of over $140 million added fuel to the rally, though ongoing US-Iran tensions kept it near $88-91, posing a lingering inflation risk.

First resistance is seen at 81,400, with initial support near 75.500.

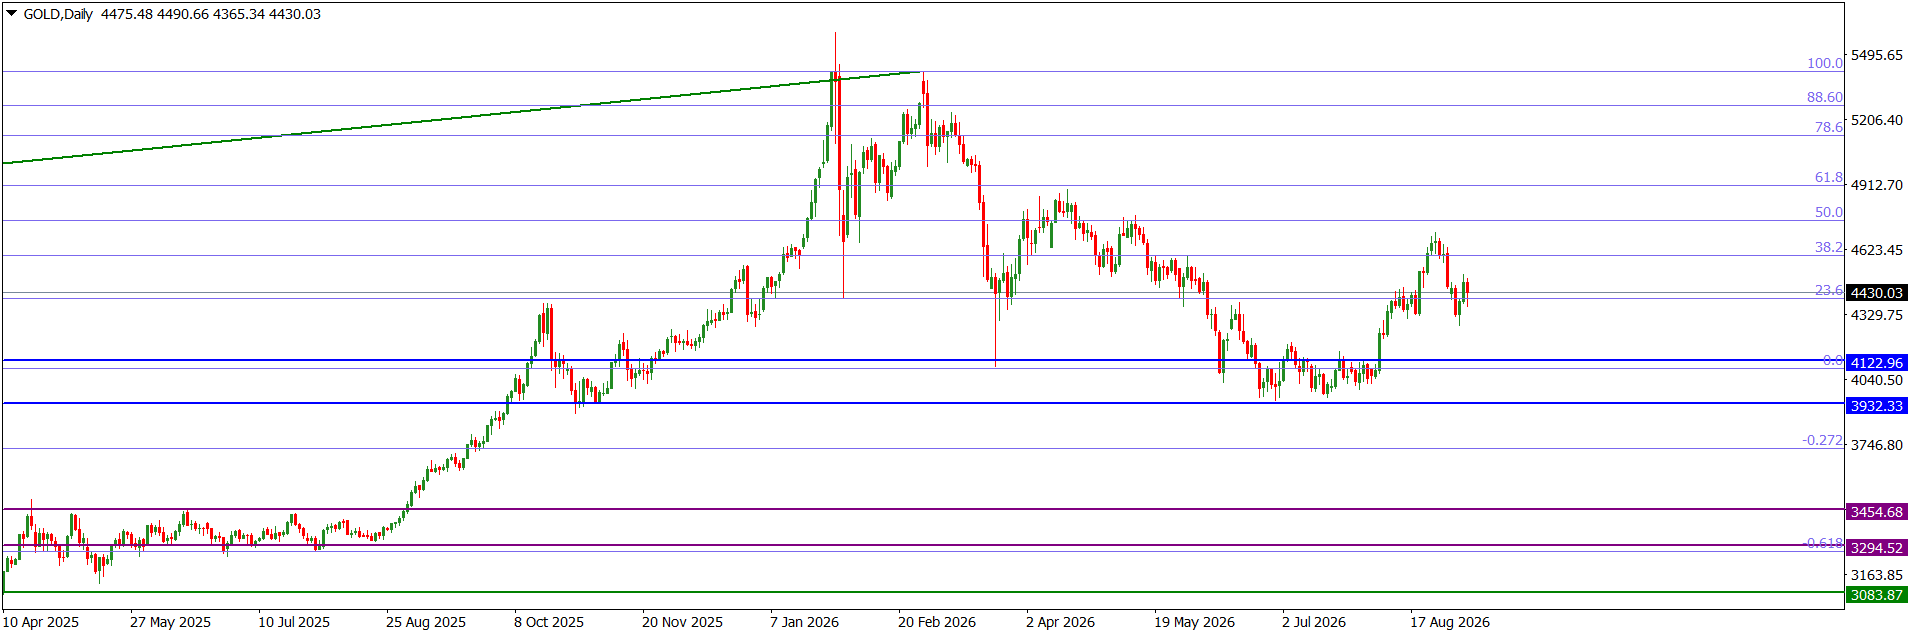
XAUUSD Weekly Technical Outlook

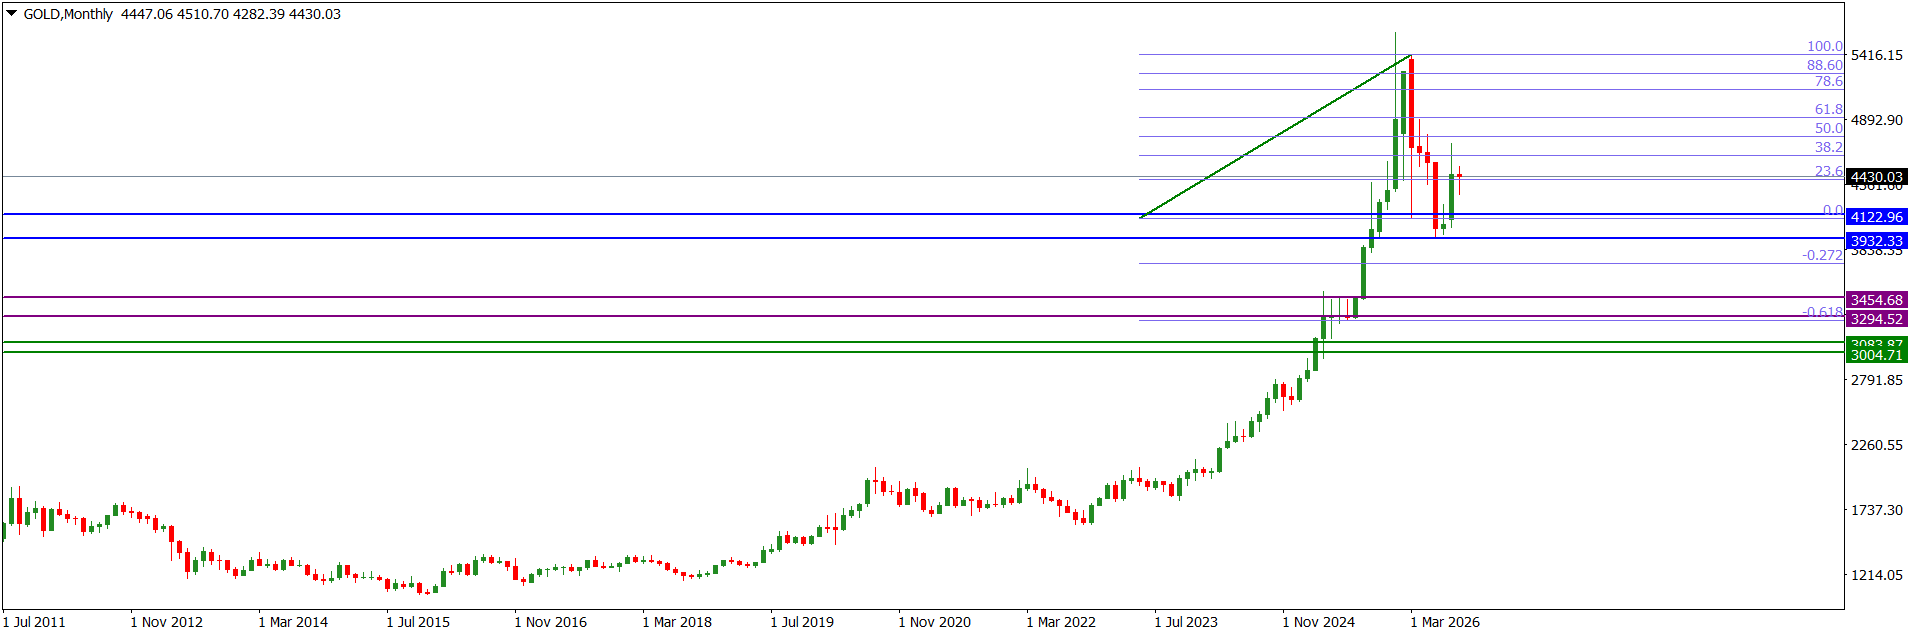
The XAUUSD market operation on the monthly time frame printed a bullish candlestick in August. The candlestick has a relatively long upper shadow.

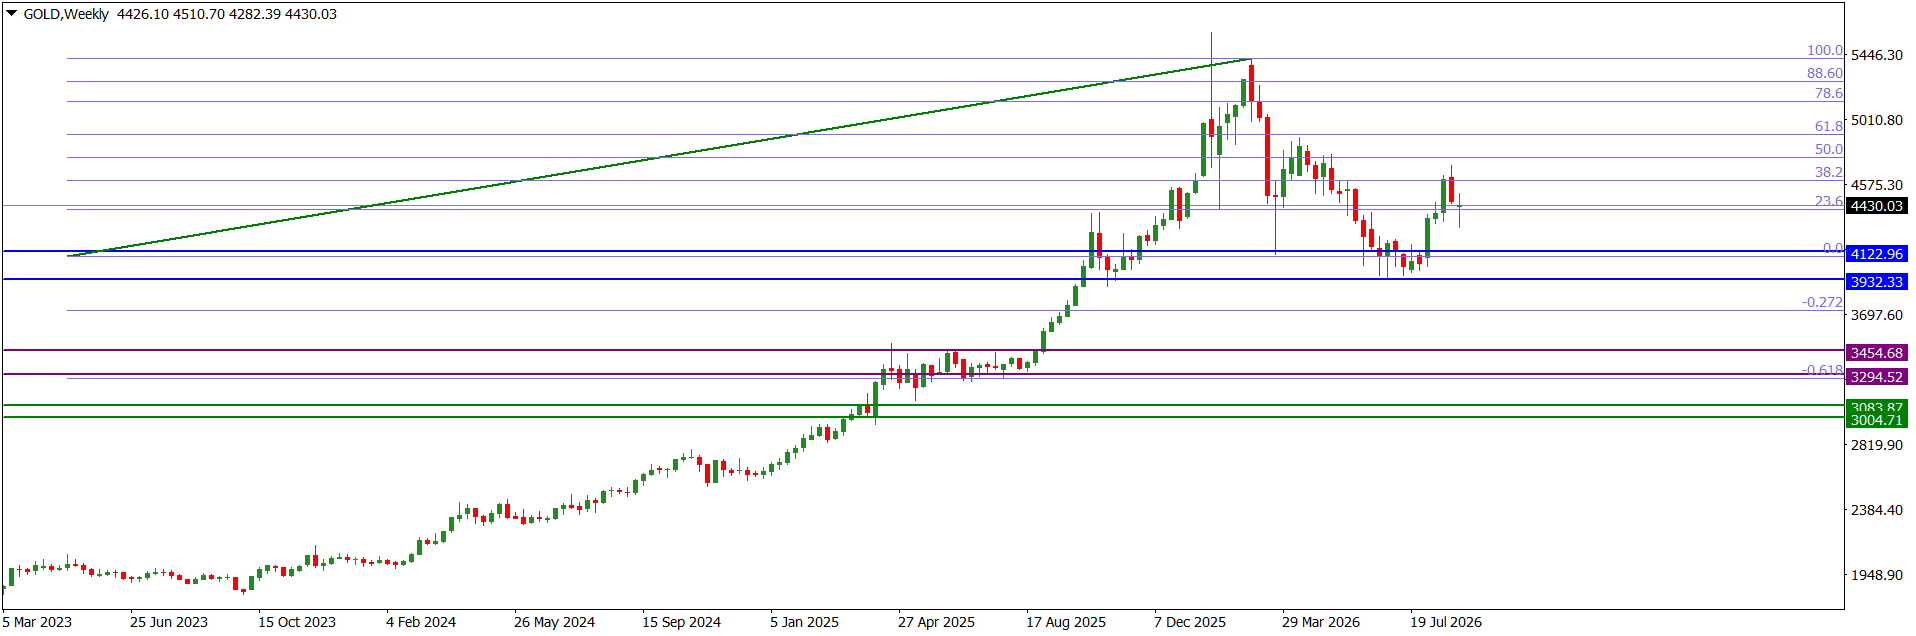
Last week, the XAUUSD market operation on the weekly time frame printed a doji-like candlestick. The technical environment indicates that this represents a pause in directional momentum, particularly as there was a bearish print two weeks ago to counter the bullish print of three weeks ago. Recent technical prints favour further northward market operation.

The XAUUSD price action on the daily time frame is sideways at the 4435.70 intra-horizontal support. Although we may still see a short-term southward price action to retest an intra-day value area, recent technical prints favour northward turnaround of price action.

I may be wrong. Trade safe and prosper.

Trap

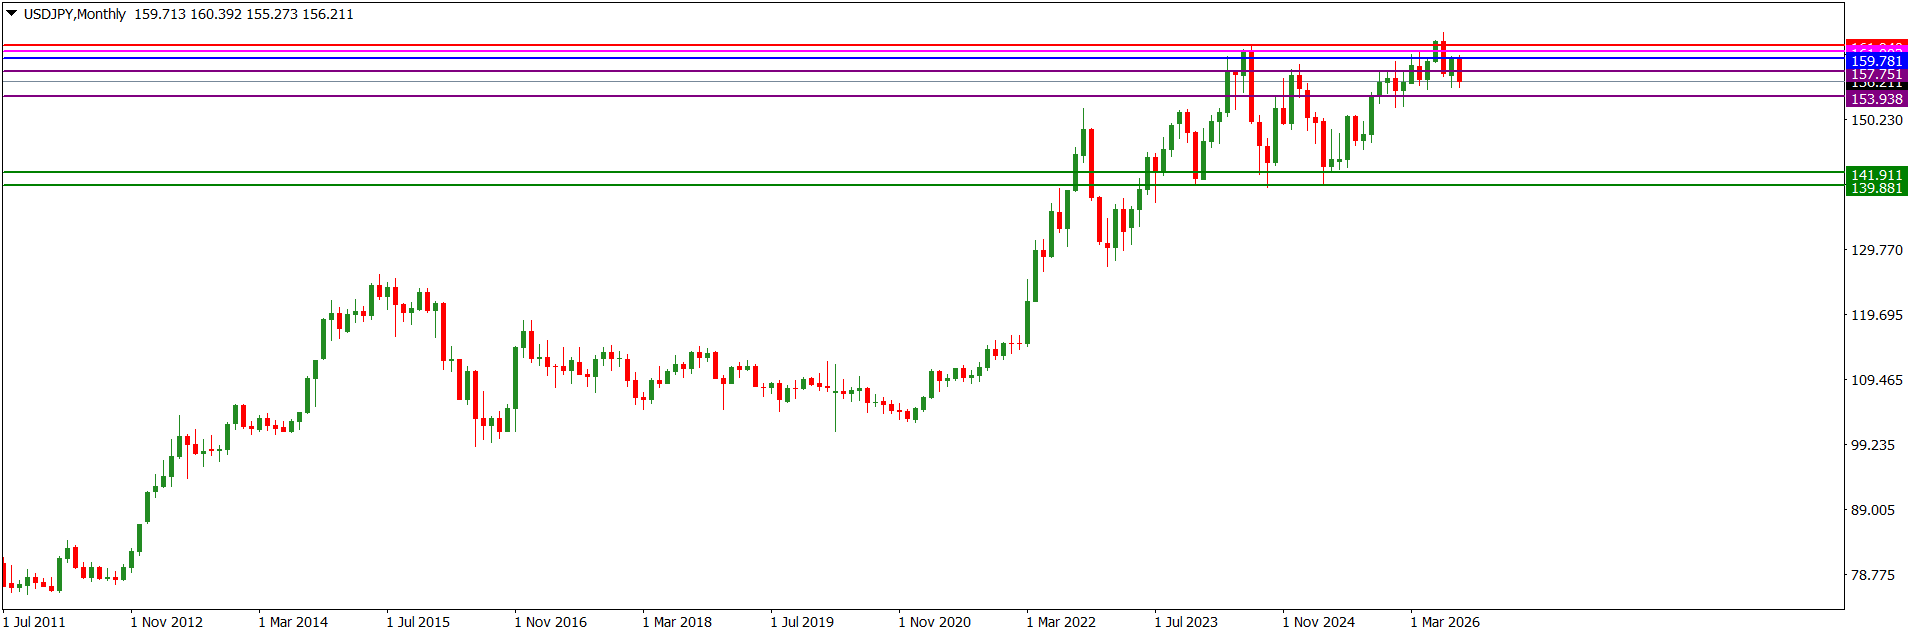
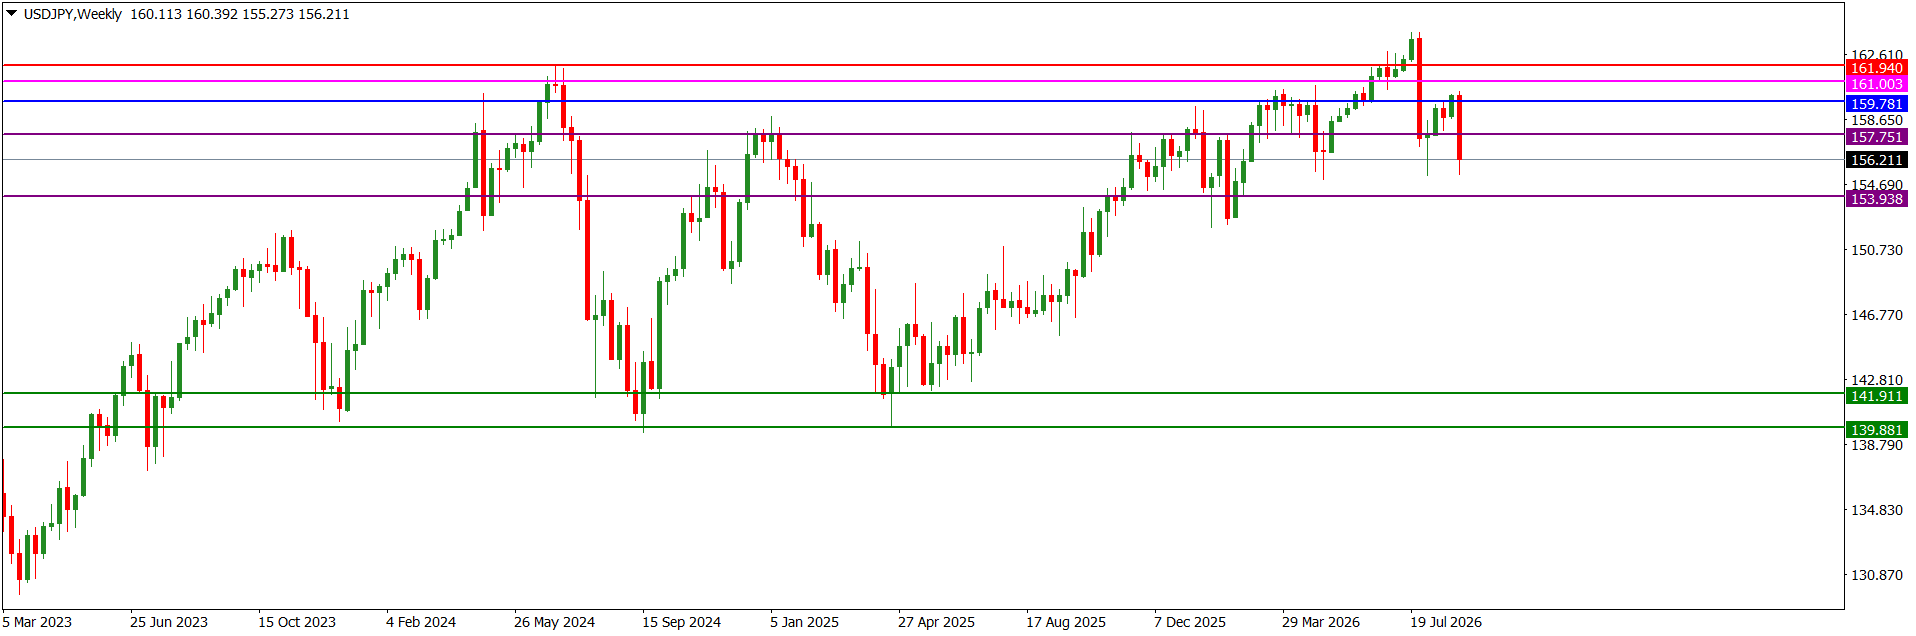
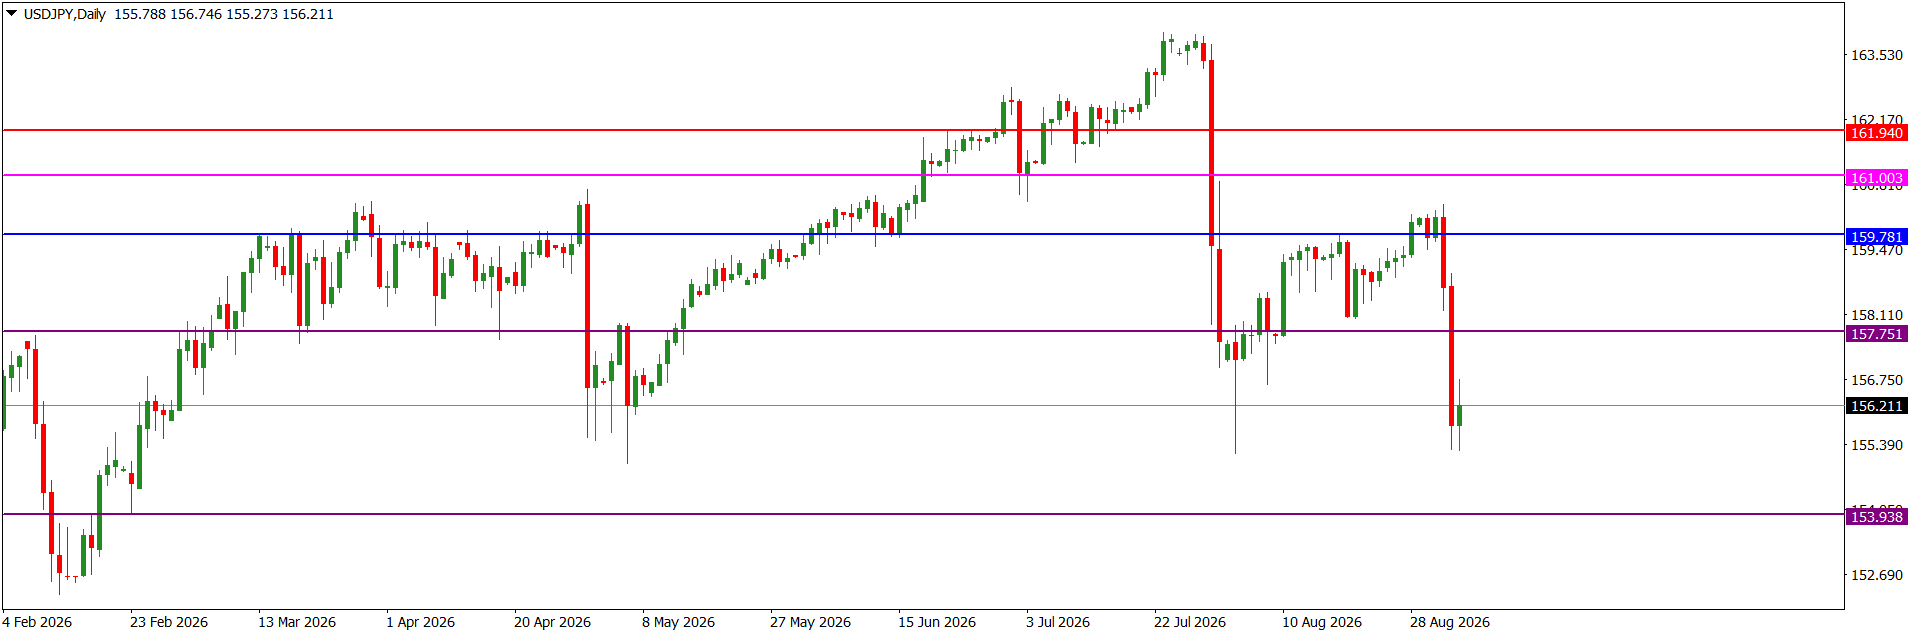
USDJPY Weekly Technical Outlook

The USDJPY market operation on the monthly time frame printed a bullish candlestick in August. However, the candlestick closed at the middle area of the bearish candlestick printed in July. Thus, technically the market operation is in consolidation.

Last week, the USDJPY market operation on the weekly time frame printed a bearish candlestick. Recent technical patterns favour further southward market operation, maybe on a short-term basis. But technically, the market operation is in consolidation.

The USDJPY price action on the daily time frame went sideways on Friday at the 156.210 area after a bearish drive to the area on Thursday. We may still see further southward price action, at least on a short-term basis. But the bigger technical condition of price action is consolidation.

I may be wrong. Trade safe and prosper.

Trap

EURUSD Weekly Technical Outlook

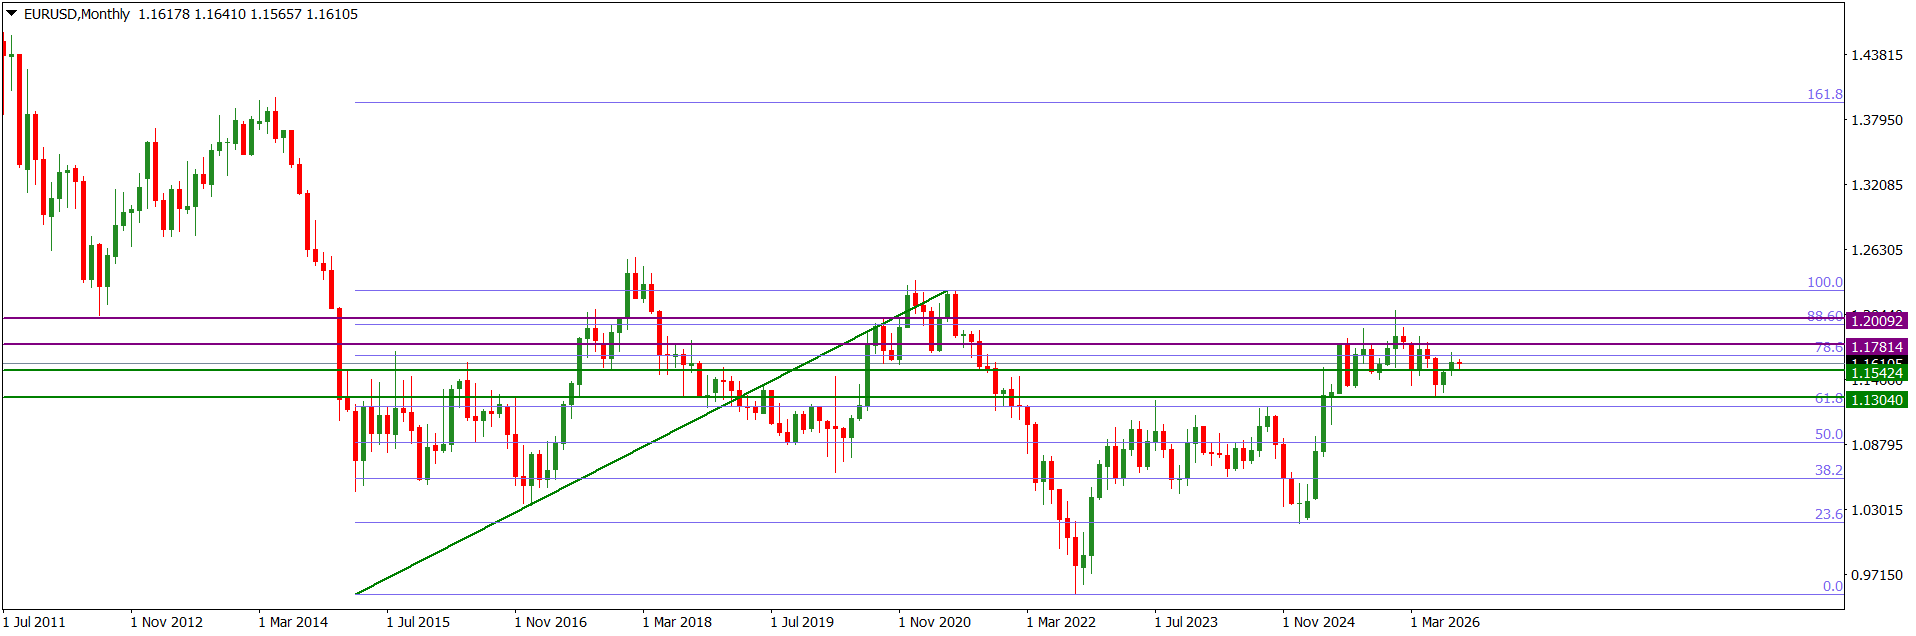
The EURUSD market operation on the monthly time frame printed a doji-like candlestick in August. As the bearish candlestick printed in June is still serving as a controlling candlestick, technically the EURUSD market operation is in consolidation.

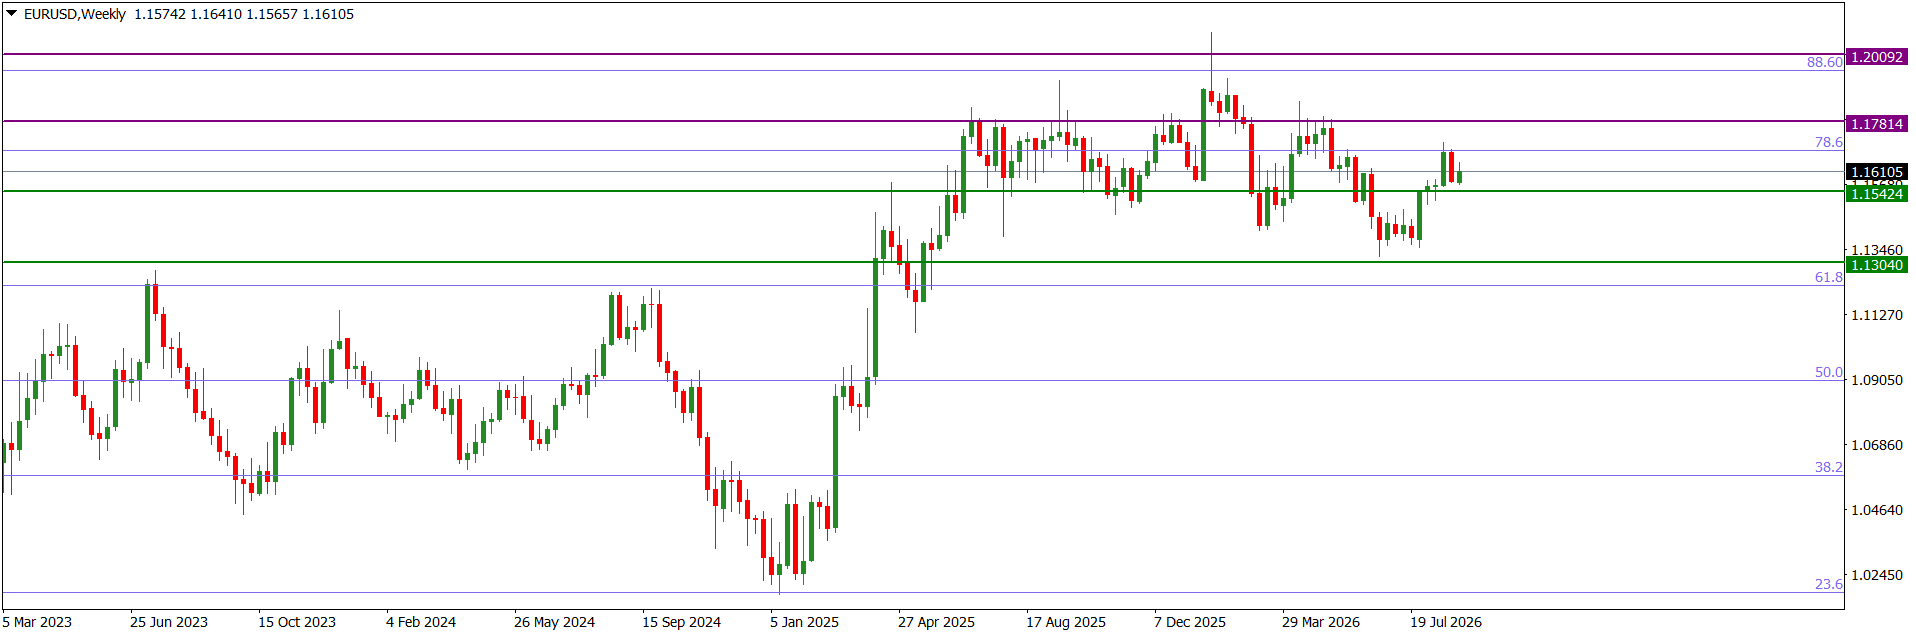
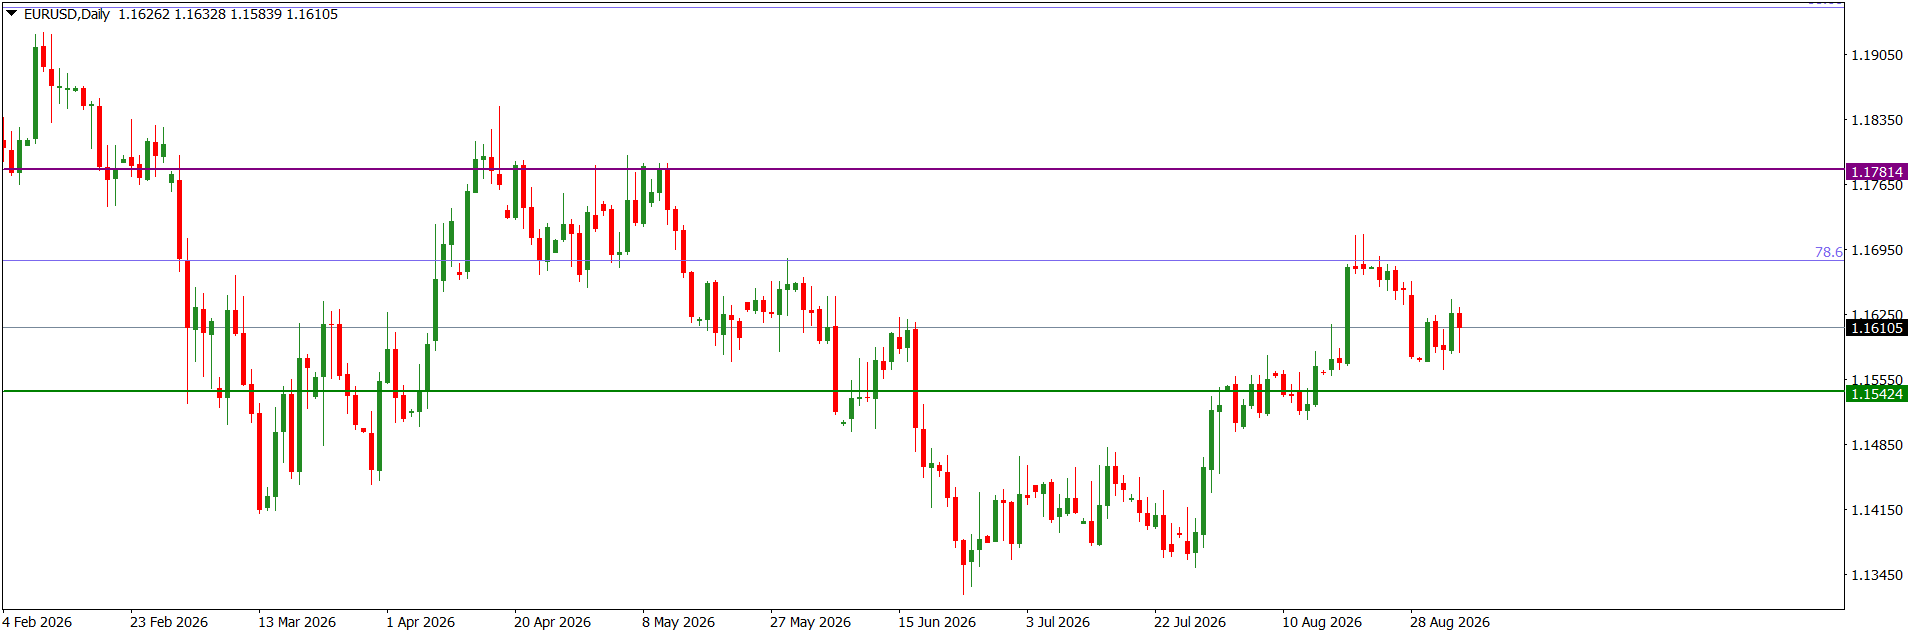
Last week the EURUSD market operation on the weekly time frame printed a doji-like candlestick. Technically the market operation is in consolidation. Presently, market operation is at the 1.16100 short-term horizontal resistance area. The 1.16870 area, which aligns with the 78.6-fib retracement of the bearish swing traceable to May 2021, is the prevailing medium-term horizontal resistance area.

The EURUSD price action on the daily time frame is sideways at the 1.16100 intra-day horizontal resistance. Technically, we may still see further northward price action. Nevertheless, the bigger technical pattern is sideways.

I may be wrong. Trade safe and prosper.

Trap

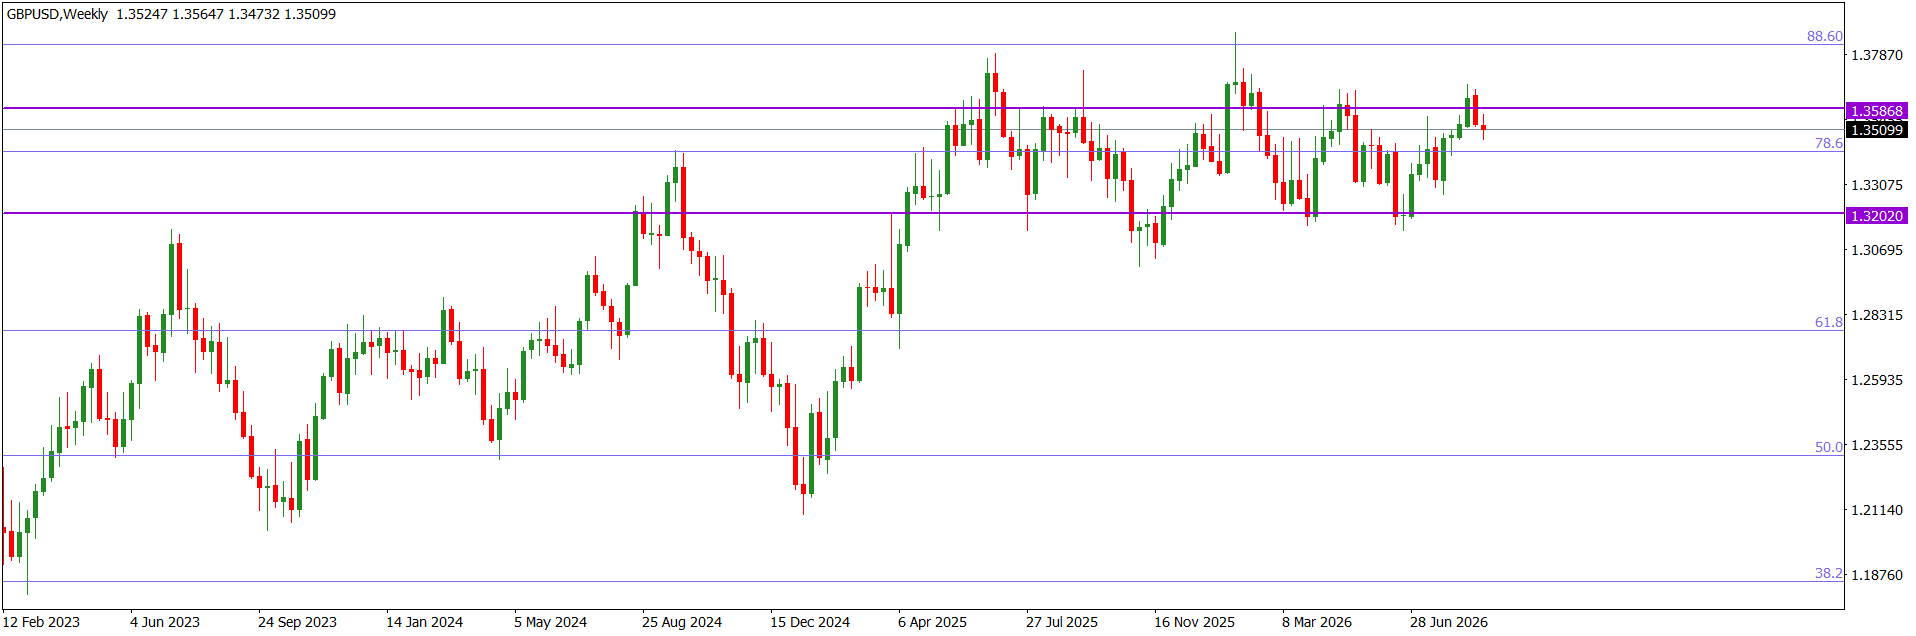
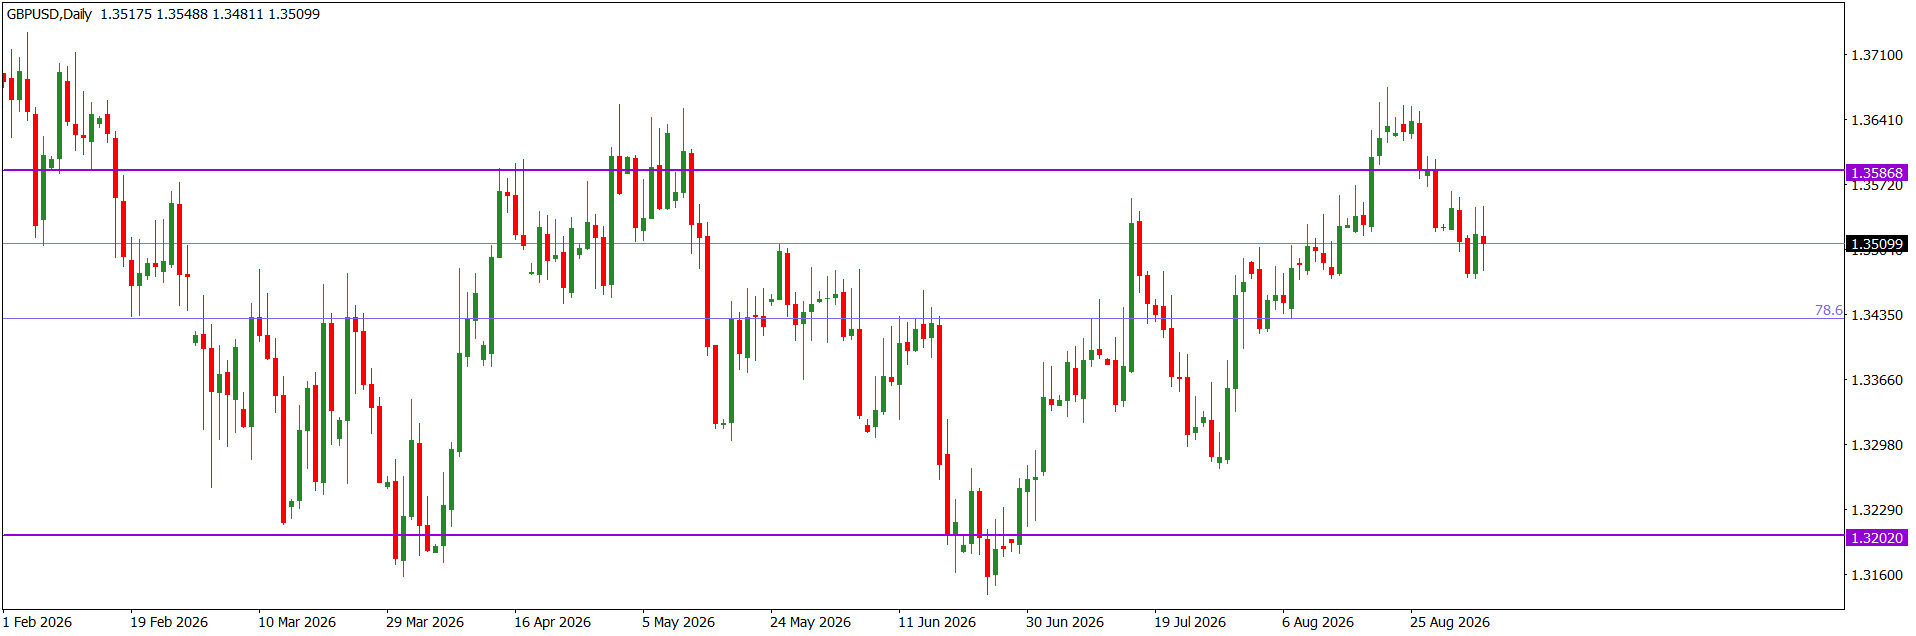
GBPUSD Weekly Technical Outlook

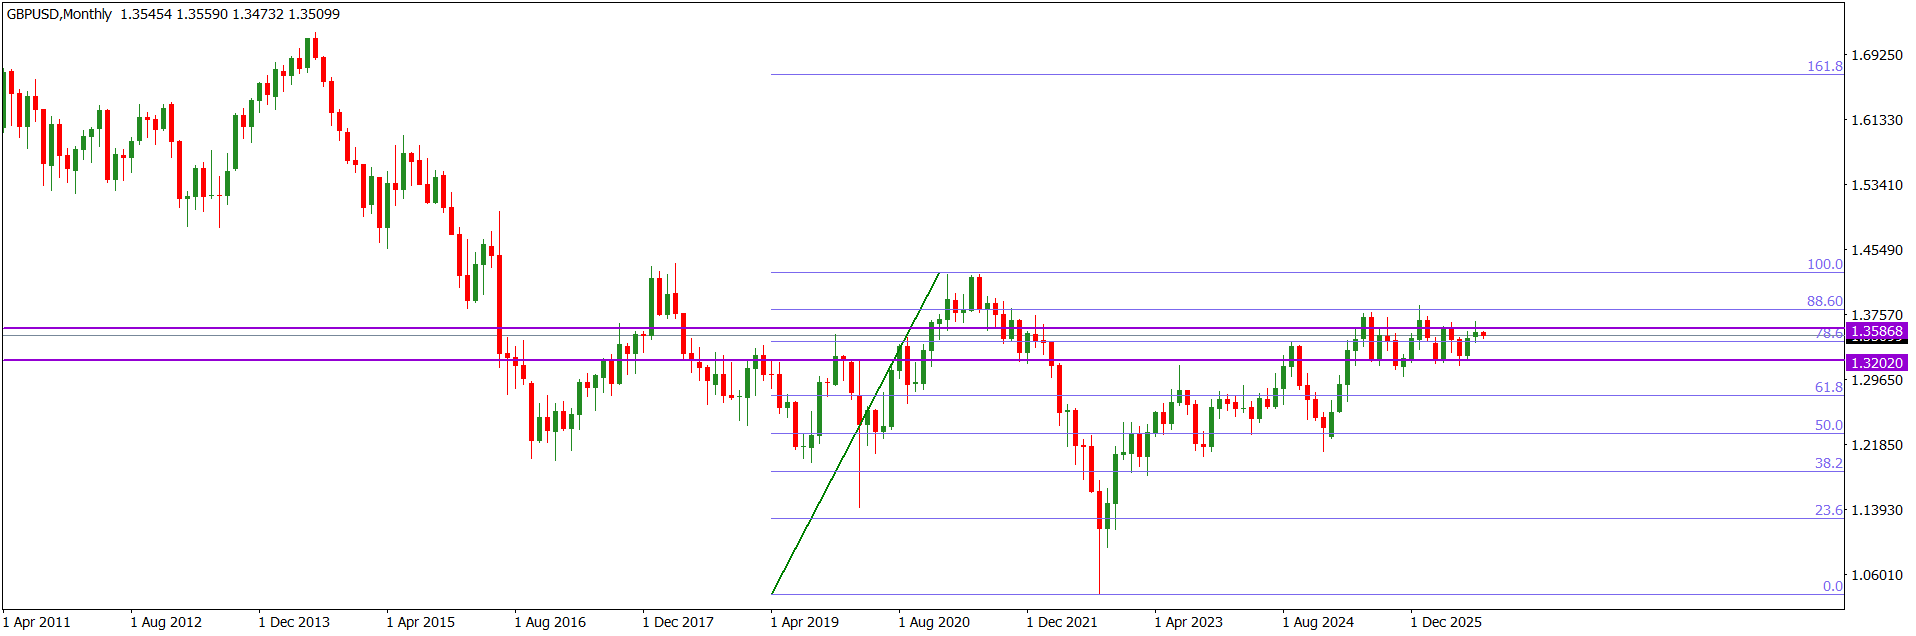
The GBPUSD market operation on the monthly time frame printed a doji-like candlestick in August. Presently, the market operation is tackling the 78.6-fib retracement of the bearish swing traceable to May 2021. The prevailing horizontal resistance is a few pips above the area. However, technically, the GBPUSD market operation is in consolidation.

Last week, the GBPUSD market operation on the weekly time frame printed a doji-like candlestick at the 1.35100 horizontal support area. The area is a few pips above the 78.6-fib retracement of the bearish swing traceable to May 2021. Technically, the GBPUSD market operation is in consolidation. But we may still see northward market operation to retest a value area, perhaps to consummate the emerging ‘W’ pattern.

On Friday, the GBPUSD price action on the daily time frame went sideways at the 1.35100 horizontal resistance. Technically, the price action is in consolidation. But recent technical prints favour further northward price action.

I may be wrong. Trade safe and prosper.

Trap