GBPUSD Weekly Technical Outlook
The GBPUSD market is sideways. On the weekly time frame, a bearish star pattern has formed based on the candlestick prints of the past three weeks, but the bearish print of last week, with a long bottom tail, indicates that bulls are still influential.
The order flow context on the daily time frame is in equilibrium although price action is presently on a northward mode. The 1.24500 area (magenta) is the immediate horizontal resistance and should be watched.
The price action is disposed northward on the H4 time frame, respecting a rising trendline (blue) from recent lows. The 1.24500 area is a horizontal resistance. A breakdown of the trendline may see bears target the 1.22000 horizontal support area (light green).
I may be wrong. Trade safe and prosper.
Trap
EURUSD Weekly Technical Outlook
The EURUSD market is still in a sideways mode. On the weekly time frame, the bearish candlestick prints of the past two weeks failed to close below the bullish print of three weeks ago. Last week, the bearish print surged below the bullish print of three weeks ago but snapped back northward and failed to close below it.
On the daily time frame, price action is retracing northward after a bearish swing. There are some congestion areas nearby but the 1.08870 area (magenta) is the main immediate horizontal resistance. It is in confluence with the 50/61.8 Fib zone of the most recent downward swing and technically susceptible to a southward turnaround.
Presently, price action on the H4 time frame is in a bullish mode. But the 1.09000 psychological area should be watched for possible southward turnaround. It is proximal to the 61.8 Fib of the most recent downward swing.
I may be wrong. Trade safe and prosper.
Trap
1 Like
XAUUSD Weekly Technical Outlook
The XAUUSD market is still disposed positively even though it has continued to offer some bearish discount. On the monthly time frame, a multi-year high was printed in April, when market punched through the 1725 ceiling.
On the weekly time frame, market operation is consolidating, and the 1746.30/1664.50 zone (magenta) seems to be the main operating range. Last week, a long-tailed bearish candlestick was printed on the weekly time frame and technicals indicate that presently bears have a slight edge.
Price action on the daily time frame is consolidating. A narrower range, 1700.46/1684.01 (blue), seems to be the short-term operating range. How the market handles the area in the early part of this week should be watched.
I may be wrong. Trade safe and prosper.
Trap
USDCAD Weekly Technical Outlook
The USDCAD market is disposed positively on the monthly time frame, respecting a rising trendline (red) traceable to 2012. Although there was a slowdown in April, the March bullish print is still influential.
Technicals and the order flow context on the weekly time frame favour bulls.
A falling wedge (blue) has formed on the daily time frame. In the context of the preceding bullish trend, technically, we may see a northward breakout of price action for the continuation of the bullish trend. The candlestick prints of last week Thursday and Friday were bullish, taking price action to a few pips of the wedge resistance trendline.
I may be wrong. Trade safe and prosper.
Trap
USDJPY Weekly Technical Outlook
Although USDJPY market operation is technically disposed southwards on the monthly time frame, the bearish momentum has weakened. The March candlestick print was a long doji-like one and the April’s was equally doji-like but relatively smaller. Presently, market operation is around the 106.900 horizontal support area.
On the weekly time frame, market operation has recently been sideways but technicals still give an edge to bears. Last week, a bearish candlestick was printed which broke below the horizontal support around the 107.600 area to nestle at the next horizontal support around 106.760. Should bears maintain their market influence, we may see further southward move this week.
On the daily time frame, price action completed a 50 Fib retracement of the downward swing from 111.680 to 106.800 and is presently retesting the 106.800 area. A bearish break of the area will likely expose the 105.890 area.
I may be wrong. Trade safe and prosper.
Trap
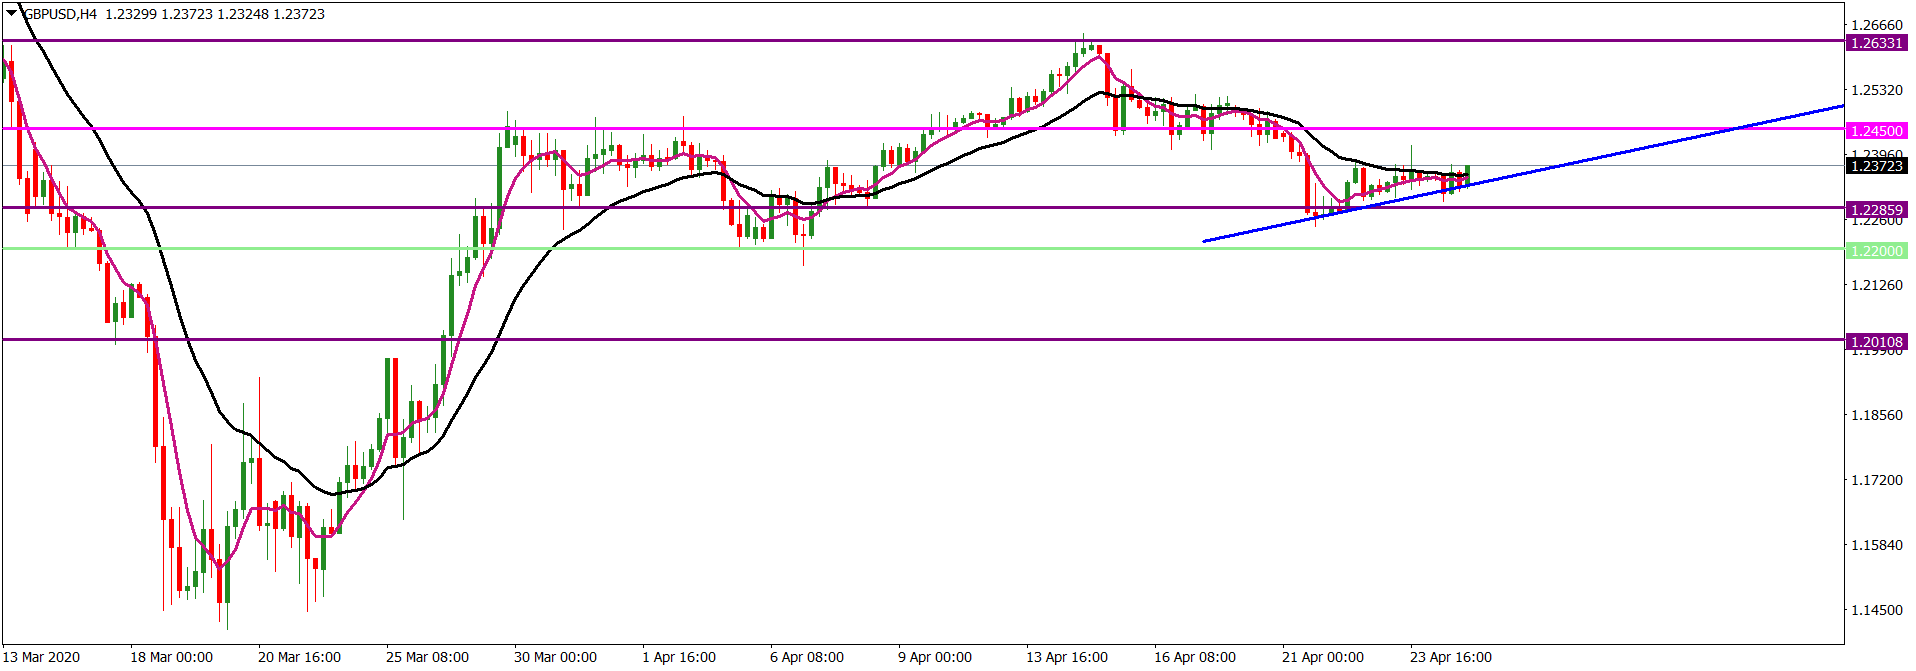
GBPUSD Weekly Technical Outlook
The GBPUSD market is generally sideways. On the monthly time frame, the bearish drive of March 2020 which created an all-time low was opposed by a bullish pull back in April. But the long lower wick on the March bearish print may encourage sellers to press for another surge southwards, perhaps to retest the 1.20110 multi-year horizontal support.
Market operation on the weekly time frame is sideways. While the 1.23330 area is the immediate horizontal resistance, the 1.22170 area is the immediate horizontal support.
Price action on the daily time frame is presently within he 61.8/78.6 Fib zone of the downward swing from 1.31000 to 1.14130. We may expect a bearish pressure in the area for a southward turnaround.
On the H4 time frame, price action has retested the 1.23330 horizontal resistance area from which it turned around on April 15, forming two topping patterns in the area, which suggests a weakening of bullish drive. We should watch how the market handles the area in the early part of this week. The next horizontal resistance is around 1.27490 (magenta), which aligns with the 78.6 Fib retracement of the 1.31000/1.14130 downward swing. I am bearish GBPUSD.
I may be wrong. Trade safe and prosper.
Trap
EURUSD Weekly Technical Outlook
Despite the northward spike in March, the EURUSD market is still disposed southward on the monthly time frame. However, the candlestick print in April, with a long bottom tail, indicates that bulls are still influential in the market.
Market operation is still sideways on the weekly time frame. Presently, bulls have seized the initiative to take it northward towards the 1.09800 horizontal resistance area. Given the bearish outlook on the monthly time frame, we may see some bearish pressure in the 1.09800 area in the early part of this week.
The daily time frame shows a market operation disposed northwards. However, looking left, the bearish impulsive swing from 1.14590 is still intact and any bullish move is retracement. The 1.09800/1.10250 area is the immediate horizontal resistance.
Presently, price action on the H4 time frame is disposed northward, apparently in a retracement; it is located around the 38.2 Fib of the recent major downward swing, from 1.15090 to 1.06360. The 50/61.8 Fib zone (bound by magenta horizontal lines) may be susceptible to a southward turnaround. We should watch how price action handles the zone in the early part of this week.
I may be wrong. Trade safe and prosper.
Trap
GBPAUD Weekly Technical Outlook
A rising trendline (red) traceable to January 2017 is still intact on the GBPAUD monthly timeframe. Presently, market operation is still far above the trendline but the bearish mode on the monthly time frame may be an attempt to retest it. However, the 1.89200 horizontal support, where market is presently operating, will have to be broken down first.
On the weekly time frame, market operation printed a bearish continuation candlestick last week. However, it is presently around the 1.89200 horizontal support. Any further southward move will likely see bears target the 1.87030 area. The 1.93890 area is the immediate horizontal resistance.
On the daily time frame, price action has broken below a recent rising trendline (black) traceable to July 2019 and is presently respecting a falling trendline (blue) from recent highs. The technicals and order flow context favour bears. I am bearish GBPAUD.
I may be wrong. Trade safe and prosper.
Trap
EURJPY Weekly Technical Outlook
The EURJPY market is disposed southward on the monthly time frame after breaking down the horizontal support around 116.110 in April. Market operation moved to the 114.000 multi-year horizontal support area at the beginning of May.
Market operation is presently sideways on the weekly time frame but the technicals still favour a southward continuation.
On the daily time frame, price action is on a northward pullback, but the bearish pressure is still in place. The 50/61.8 Fib zone (bound by magenta horizontal lines) of the most downward swing from 117.325 to 114.400 is susceptible to a southward turnaround should price action get there. I am bearish EURJPY.
I may be wrong. Trade safe and prosper.
Trap
USDJPY Weekly Technical Outlook
On the weekly time frame, after making the76.8 Fib retracement of the downward swing from 123.800 to 98.700 in December 2016, market is operating within a falling channel (blue). Presently, it is disposed southwards below the 38.8 Fib zone and technicals still favour bears. But price action is now at the horizontal support around the 106.760 area, where it printed a doji-like candlestick last week; which indicates a decline in momentum.
The daily time frame shows a USDJPY price action in a bullish pullback. Although technicals give a slight edge to bulls, this seems to be temporary given the bigger technical outlook on the weekly time frame. The 107.800 area is an immediate horizontal resistance which bulls will have to contend with.
Bulls are taking price action northward on the H4 time frame. Presently, price action is sideways around the 106.760 horizontal resistance area. If there is no southward turnaround in the area, bulls will find the 107.195/107.420 zone (magenta) challenging. Another challenge will quickly follow at the 107.650 congestion zone. I am bearish USDJPY, but I will wait for the bullish pullback to lose momentum before looking for a feasible sell trading opportunity.
I may be wrong. Trade safe and prosper.
Trap
EURUSD Weekly Technical Outlook
The EURUSD market is generally consolidating. On the weekly time frame, the 1.10000/1.07600 zone (bound by magenta horizontal lines) has held as the primary channel for the consolidating market operation since the first week in April.
The daily time frame shows a market in consolidation. Bulls are presently taking price action northwards but there is a decline in momentum.
Price action on the H4 time frame is presently consolidating at a minor horizontal resistance around the 1.08400 area. We should wait for how the market handles the area in the early part of this week. Although technicals give bears a slight edge, we should await a directional clarity.
I may be wrong. Trade safe and prosper.
Trap
GBPUSD Weekly Technical Outlook
The GBPUSD market is still under a bearish pressure although, presently on the weekly time frame, it is in a sideways mode. The 1.26100/1.22700 zone is operating as a channel for market consolidation. A significant break below the 1.21700 area may embolden bears to challenge for further southward gains.
On the daily time frame, price action is within a rising triangle (blue). Last week Friday, it printed a bullish candlestick which took it from the triangle base. However, it is presently located at a minor horizontal resistance around the 1.24500 area and we should await how the market handles the area in the early part of this week. The 1.21800 area (magenta) can be an initial target of a bearish attempt to complete a down-leg of the ’M’ pattern on the daily time frame.
I may be wrong. Trade safe and prosper.
Trap
XAUUSD Weekly Technical Outlook
The XAUUSD market finally nestled at the multi-year horizontal resistance around the 1751.60 area. On the weekly time frame, market operation pulled southward from the area five weeks ago and has been sideways until last week. Last week, a relatively strong bullish candlestick broke from the sideways operation of the previous four weeks to nestle in the area. However, the area, which has held as resistance since November 2012, has not been breached. Although technicals give a slight edge to bulls, it seems the pattern of recent price action, with a largely sideways mode, may see some bearish retracement. On the other hand, any further or extended bullish drive is likely to expose the nearby 1763.15 horizontal resistance.
On the daily time frame, price action is disposed positively. Presently, an ascending triangle pattern (blue) has formed. However, the ‘wicky’ nature of recent candlestick prints indicates a decline in bullish momentum and we may see a bearish pullback or a resumption of the sideways of price action.
On the H4 time frame, price action is still disposed positively. However, the bullish momentum is declining as the market entered the 1743.40/1751.60 multi-year horizontal resistance zone. The prevailing rising trendline (magenta) from recent lows is too steep and is susceptible to a bearish breakdown. Any such breakdown may see bears initially target the 1725.20 horizontal support area, and, by extension, try a retest of an older rising trendline (black) which was active until recently. Technically, I am bearish XAUUSD on the short term, but I will await what price action does in the early part of this week. In the medium term, failure of price action to break down the longer term rising trendline (black) on a daily closing basis will kick in a bullish bias.
I may be wrong. Trade safe and prosper.
Trap
GBPJPY Weekly Technical Outlook
The GBPJPY market is disposed negatively. After a 61.8 Fib retracement of the downward swing from 144.530 to 123.800, last week, market operation printed a relatively big bearish candlestick which broke down the 132.610 area; the area has held as support for the previous six weeks. Market operation is now around the 130.000 area, which is close to the zone where it rallied northwards in the last week of March. There is still room for a southward continuation as any significant bearish drive has over 250 pips to expose the low of the bullish candlestick, 127.315, from where market operation rallied northward in late March.
On the daily time frame, price action is presently at the 130.000 horizontal support area. The area has held as support since October 9, 2019 until it was broken down on March 18, 2020. Thus, it will take a strong bearish display to break down the zone. We may likely see a pullback from the area first before bears make another attempt to break it down. Therefore, we should await how price action handles the area in the early part of this week. Technicals give a slight edge to bears.
On the H4 time fame, technicals still favour bears and the last candlestick print on Friday broke below the 130.000 significant horizontal support. Nevertheless, the bearish print was still under a bullish pressure judging by the fact that it has wicks on both ends. Besides, it will take a more dominant candlestick print to break down a zone that has held for several weeks in the recent past, and for over one year earlier. Furthermore, price action is too far from the mean and, technically, a pullback is due.
I may be wrong. Trade safe and prosper.
Trap
EURUSD Weekly Technical Outlook
Although the EURUSD still has a negative tinge, its market operation is presently sideways. On the weekly time frame, in the past six weeks the bullish and bearish candlestick prints have been very much in equilibrium. Last week, market operation printed a doji-like inside candlestick to the bearish print of two weeks ago. It is presently located at the 1.08190 area, which has held as support for over five weeks. We should await how the market handles the area in the early part of this week,
Price action on the daily time frame is generally flat although technicals give bears a slight edge. The order flow context has been in equilibrium for several days and the recent candlestick prints have wicks at both ends. The 1.07690/1.08930 zone (magenta) is the channel for price operation, and we may not see a feasible directional momentum until the zone is significantly breached on a daily closing basis.
I may be wrong. Trade safe and prosper.
Trap
GBPUSD Weekly Technical Outlook
The GBPUSD market is still negative although the bearish momentum is declining. On the weekly time frame, after a retracement of the recent significant downward swing, last week, market operation printed a relatively big bearish continuation candlestick which broke down the ascending wedge (blue) which has held for about six weeks. The dominant nature of the candlestick print shows the determination of bears to gain market advantage. This may see them sprint to cover the less than 100 pips to expose the next horizontal support around 1.20100. Technicals give a slight edge to bears.
Technicals and the order flow context on the H4 time frame still favour bears. We may see a further bearish move, perhaps to target the 1.20100 horizontal support area, before any pullback.
I may be wrong. Trade safe and prosper.
Trap
AUDUSD Weekly Technical Outlook
The AUDUSD market operation has been sideways for four weeks on the weekly time frame. But technicals favour bears, given the strong bearish drive from the 0.66500 area 11 weeks ago. Presently, market operation is in the 0.65650 area, with the 0.66500 area acting as immediate horizontal resistance. The 0.62800 area is the immediate horizontal support.
Topping formation can be seen on the daily time frame. This indicates a decline in bullish momentum as price action gets near the 0.66500 horizontal resistance. The candlestick prints of Thursday and Friday last week are bearish, but they are relatively small. Nevertheless, they indicate a bearish pressure.
Recent price action on the H4 time frame is primarily within a horizontal channel spanning the 0.65650/0.64060 zone (blue). Presently, it has disposed southward from the channel resistance line, but bulls effected a pullback in the last two sessions on Friday. We should watch how price action handles the 0.65650/0.66000 area in the early part of this week. Personally, I will be interested in a bearish setup in the area, which will align with the recent dominant market operation on the weekly time frame.
I may be wrong. Trade safe and prosper.
Trap
XAUUSD Weekly Technical Outlook
Market operation on the XAUUSD is still disposed positively but there is a decline in directional momentum. On the weekly time frame, market operation is within a rising channel (navy). Last week, it printed a bearish candlestick with wicks on both ends, indicating a slowdown of bullish momentum.
Price action on the daily time frame is still technically in favour of bulls but there is a decline in bullish momentum. The recent candlestick prints show that bulls are finding it difficult to break above the recent high around 1765.50. The 1715.70/1752.70 zone (blue) is the operating horizontal range for price action since the past seven trading days. On Thursday last week, a bearish candlestick spanned the area. On Friday, bulls resisted the bearish move of Thursday, but the attempt to restore parity failed, leading to the printing of an inside candlestick to the bearish print of Thursday. Presently, price action is located at the 1735.40 horizontal resistance area, which should be watched in the early part of this week. We should also watch how price action handles the operating rising trendline (magenta).
Technicals and the order flow context on the H4 time frame favour bears. A Fibonacci test of the two recent downward swings on the H4 time frame, the 1765.00/1725.00 swing and the 1753.40/1716.50 swing, shows a rejection of key Fib levels. Presently, the 1753.40/1716.50 swing is at the 50 Fib retracement and we should watch how price action handles the area in the early part of this week. Technically, as there was a bullish print in the last 4H-session on Friday, we can expect a brief retest of the 61.8 Fib area, around 1740.00, before a southward continuation. But, at any rate, I will await what price action does in the early part of this week as the XAUUSD market operation presently offers good trading opportunities on either side.
I may be wrong. Trade safe and prosper.
Trap
EURGBP Weekly Technical Outlook
The EURGBP is still disposed positively but it is experiencing a decline in momentum. On the weekly time frame, last week, there was no bullish follow-through to the strong bullish drive of two weeks ago. Instead, market operation printed a doji-like candlestick as it approaches the 0.92000 horizontal resistance area (magenta).
Price action on the daily time frame is presently in a sideways mode around the 38.2 Fib retracement zone of the downward swing from 0.95190 to 0.86750. Recent candlestick prints, with decreasing size of bullish ones and the printing of a relatively significant bearish candlestick last week Tuesday, technically portend a weakness of bullish influence and the appearance of bearish pressure.
I may be wrong. Trade safe and prosper.
Trap
GBPUSD Weekly Technical Outlook
The GBPUSD market is still disposed negatively. On the weekly time frame, two weeks ago, market operation broke down the 1.23000 horizontal support which had held as support for the previous four weeks. Last week, bulls retested the 1.23000 area, but bears made a strong push back. Technicals still favour bears and the next horizontal support is technically around the 1.20100 area.
Technicals and recent order flow context on the daily time frame favour bears.
Although there was a sideways of price action last week Friday, technicals on the H4 time frame still favour bears. Price action is respecting a falling trendline (magenta).
I may be wrong. Trade safe and prosper.
Trap