Hi María here. Hope it will help you.
[B]EURUSD Weekly & Monthly Pivots May 21-25, 2012[/B]
The pivot points’ chart for the EUR/USD pair for this week indicates that pivot points are set according to the weekly highs and lows of the pair as well as the close price. This chart will enable you to place Take Profits or Stop Losses. These pivot levels can serve as a trading map allowing you to know beforehand the prospect highs and lows of the pair.
Therefore it is recommended to open short positions at the R1 level and long positions at the S1 level. If the weekly pivot is considered as a target, it can be a good strategy for swing trading. The strategy can be used in other way by opening long positions in S2 positions and short R2 weekly with S1 or R1 seen as weekly targets or to the pivot point.
[B]WEEKLY_[/B]
Weekly - R3 = 1.3171
Weekly - R2 = 1.3038
Weekly - R1 = 1.2908
[B]Weekly Pivot = 1.2775[/B]
Weekly - S1 = 1.2645
Weekly - S2 = 1.2512
Weekly - S3 = 1.2382
:p:p:p
[B]MONTHLY__[/B]
Monthly - R3 = 1.3801
Monthly - R2 = 1.3590
Monthly - R1 = 1.3415
[B]Monthly Pivot = 1.3204[/B]
Monthly - S1 = 1.3029
Monthly - S2 = 1.2818
Monthly - S3 = 1.2643
[B]EURUSD Monthly & Weekly Pivot Points for June 4-8, 2012[/B]
The weekly and monthy pivot chart for EUR/USD indicates that the pivot points are placed according to the last week’s highs and .
The pivot point should be the first place to look to open a trade
The more times a currency pair touches the pivot level and then return, the stronger is the level.
Recommendations to operate these levels:
If the price is in the PP (Pivot Point), expects a move to R1 or S1
If the price is R1, waiting for a move to R2 or back towards PP
If the price is in S1, waiting for a move to S2 or back towards PP
If the price is R2, waiting for a move back to R3 or R1
If the price is in S2, waiting for a move back to S3 or S1.
No news, important to influence the market, probably the price moves to pivot S1 or R1
If news, important to influence the market, the price may be sent directly to R2 or S2 or S3 and R3 reach.
WEEKLY_[/B]
Weekly - R3 = 1.2947
Weekly - R2 = 1.2786
Weekly - R1 = 1.2610
[B]Weekly Pivot = 1.2449[/B]
Weekly - S1 = 1.2273
Weekly - S2 = 1.2112
Weekly - S3 = 1.1936
[B] Signal:[/B]
Buy Long Above 1.2449 Take Profit 1.2610
[B]MONTHLY__[/B]
Monthly - R3 = 1.3933
Monthly - R2 = 1.3608
Monthly - R1 = 1.2986
[B]Monthly Pivot = 1.2661[/B]
Monthly - S1 = 1.2039
Monthly - S2 = 1.1714
Monthly - S3 = 1.1092
:57::57::57:
EURUSD Weekly Analysis for July 5, 2012
The Euro-Dollar pair has a strong level of support as part of the weekly fractal 1.2385, this level is important in defining the trend in the coming months. If this level is breaches and the market closes the week below 1.2384, it will mean that the euro can reach 1.20.
On the other hand, a weekly close above this level increases the likelihood of upward sequence to our target of 1.2890.
Today and tomorrow, we would expect that the market is too volatile for this currency pair. Given that, it is interesting to see, what kind of reaction at the end of the week will be.
We should remember that the announcement about nonfarm payroll out on Friday can affect this pair as well.
:18::18::18:
EURUSD Weekly Strategy for August 2, 2012, Pivot at 1.2251

This morning before the press conference with the President of the European Central Bank Mario Draghi, the euro reacted very volatile, rising rapidly to 1.2385 then quickly changed its tendency, and at this point the currency is quoted below weekly pivot 1.2150
In view that the euro has only reacted to a fundamental fact, we must wait until the midday ET to define the trend. Therefore, in the course of return to the weekly pivot, we recommend sell objectives at 1.2110. On the other hand, if the price closes in 4 hours charts above the pivot at 1.2150 recommend buying with targets 1.2410.
Have a nice day!
María
:20::20::20:
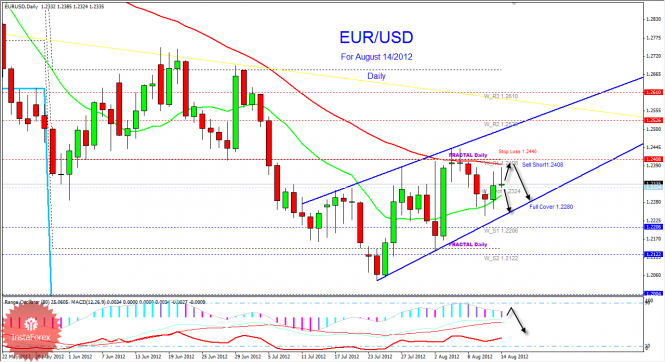
EURUSD Sell Below Fractal 1.2408
The euro is trading above the weekly pivot point of 1.2324, this supportive dynamic keeps the pair within an upward trend and it is possible that the pair will continue the view up to 1.2408. This level is a strong weekly resistance, daily fractal is at 1.2410. Furthermore, given that there is a downward pressure, only break of 1.2324 could extend the fall towards 1.2280 and 1.2240.
Our outlook remains bearish for this pair, the indicators show exhaustion in volatility and a downward sequence.
It seems that this pair is trying to form a rising wedge pattern. This is usually a bearish signal and sell signal is confirmed, it is possible that the upward rally reaches 1.2526; after we enter this area we will begin selling.
Our stop loss is placed above the maximum of the last week.

Have a nice day!
María
:eek::eek::eek:
EURUSD Bearish Outlook for August 29, 2012
The euro is trading above the psychological level of 1.25; we have seen that the pair demonstrated a recovery these days. This upward movement is more likely based on the idea that the Fed will provide more monetary easing and the ECB will probably do something of this magnitude. But of course, we will be probably disappointed. Because of this, it is really difficult for the market to operate now.
We, therefore, recommend being very cautious when buying, as before the rise there will likely be a correction to the level of 1.24.
Therefore, we recommend selling if the price closes below the daily pivot of 1.2535 or if gives a pullback to the level of 1.26. Sell with targets at 1.2464 and 1.2390.
Our outlook remains bearish below the level of 1.27.

Nice day everyone!
María
;);)
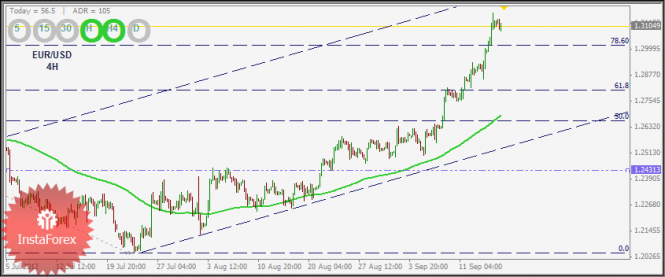
EURUSD Intraday Technical Analysis and Trading Recommendations for Sept. 17, 2012

The EUR/USD pair resumed its bullish movement last week recording a high at 1.3167.
As it is seen on the chart above, the view remains bullish in near-term as long as the pair is trading above 78.6% Fibonacci level around 1.3015.
Intraday support is seen around 1.3090. However, breakdown below that area could lead price to neutral zone in nearest term testing 1.3050 – 1.2970 while a longer-term support is seen around price level 1.2810 (61.8% Fibonacci Level).
Have a nice day!
María
:33::33::33:
Will keep tracking. Liked the way you detailed things in pictorial manner. keep up!
Hai this is EURUSD pivot point details For December 06.12.12.
Use this for your good trade friends .
Thank you
R3 R2 R1 pivot S1 S2 S3
1.3175 1.3151 1.3108 1.3084 1.3041 1.3017 1.2974


