The Recursive Engine of Market Structure
In the pursuit of understanding markets, many have leaned on tools that appear mathematically sound. Markov chains, machine learning models, and probability-based systems all use approaches that seem logical on the surface, collapse when tested against the true structure underpinning market behaviour. They fail not because of poor implementation, but because they are trying to solve the wrong kind of problem.
What these models assume is that market movement can be captured as a set of transitions from one state to another, with those transitions governed by historical frequency or probability. A Markov chain, for example, posits that the next state of a system depends only on the current one, not the path taken to get there, and not the deeper structural position of that state within a larger framework. In a world where price movement is assumed to be random or sentiment-driven, such tools seem reasonable. But what if that assumption is wrong?
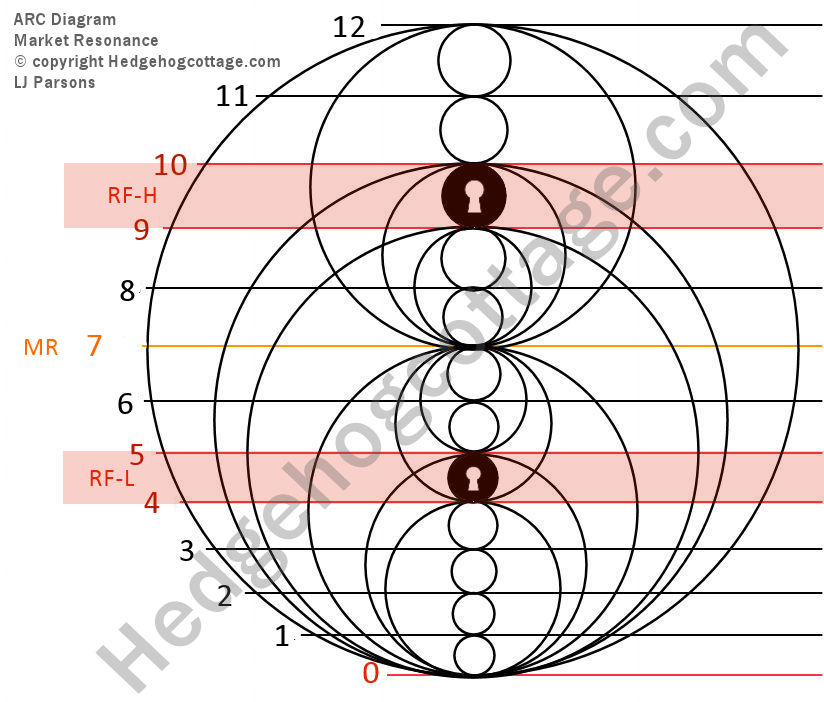
My theory is grounded in a very different premise: that market movement is not random at all, but structured, intentionally, and recursively. At the heart of this structure lies a fractal and logarithmic scaffold, where each level of market movement, primary, secondary, and ternary, is governed by the same internal logic. That logic is a 12-point cycle, which repeats not just across timeframes, but within every fractal layer of the system. Each level begins its own 12-point recursive cycle based on its position within the Primary level above and below it. This is not merely a visual fractal, but a functional fractal, a nested system of structure that modulates itself at every level.
To understand this, imagine a Shepard tone, an auditory illusion of a tone that seems to endlessly rise in pitch, never actually reaching a higher or lower note. It’s created by layering multiple tones separated by layers that continuously fade in and out, producing the sensation of infinite ascent. This illusion captures the essence of recursive design, a system that appears to move forward or change endlessly, yet fundamentally cycles within a pyramid of fixed structures. Similarly, market movement can appear continuous and unpredictable, but beneath that surface lies a repeating, recursive framework that governs every shift.
A rise in price may look like an “Up” state to a statistical model, but without knowing where that movement sits within the larger structure, what level, what polarity, what point in the 12-step sequence, it has no actual meaning.
This is why statistical models fail. They treat market behaviour as memoryless and flat, while in reality, the market is recursive and context-aware. Each layer of price movement inherits the logic of its parent layer, yet begins its own variation of the same underlying theme. This nesting of logic within logic creates a system that no traditional computer model, no matter how advanced, can decode unless it understands the source code of the structure itself.
And that source is design. Not randomness, not noise, but intentional structure that follows elegant mathematical laws. What appears chaotic at first glance is, in fact, composed. Each level of movement is modulated by its position in the hierarchy, and each modulation gives rise to new structure. This is the essence of the recursive engine that drives market behaviour.
To model such a system requires more than computation. It requires alignment with the structure itself. One must begin not by asking what happened last, but by asking: Where are we in the structure? What level are we in? Which point of the 12? Which polarity phase? Which resonance zone? These questions are not just philosophical, they are functional. They provide the key to seeing what statistical models cannot: that the market is not reacting, it is playing out a score.
When I arrived at this stage in writing my book, I had reached a critical conclusion: no model based on historical price alone will ever decode the market. Because the market is not a statistical machine. It is a recursive instrument. And until one tunes in to its layered, logarithmic, fractal design, all efforts to forecast it will amount to guessing at shadows on a wall.
My book, “By Design” shows how this recursive structure can be mapped, measured, and used, not to predict with probabilities, but to align with design. Because when the market moves, it is not reacting. It is resonating.