We will look at the past performance of the 1H Hour Elliott Wave chart of Exxon Mobil Corp ($XOM). The rally from 11.16.2023 low at $101.15 unfolded as a 5 wave impulse. So, we expected the pullback to unfold in 3 swings and find buyers again. We will explain the structure & forecast below:
$XOM 1H Elliott Wave Chart 11.21.2023:
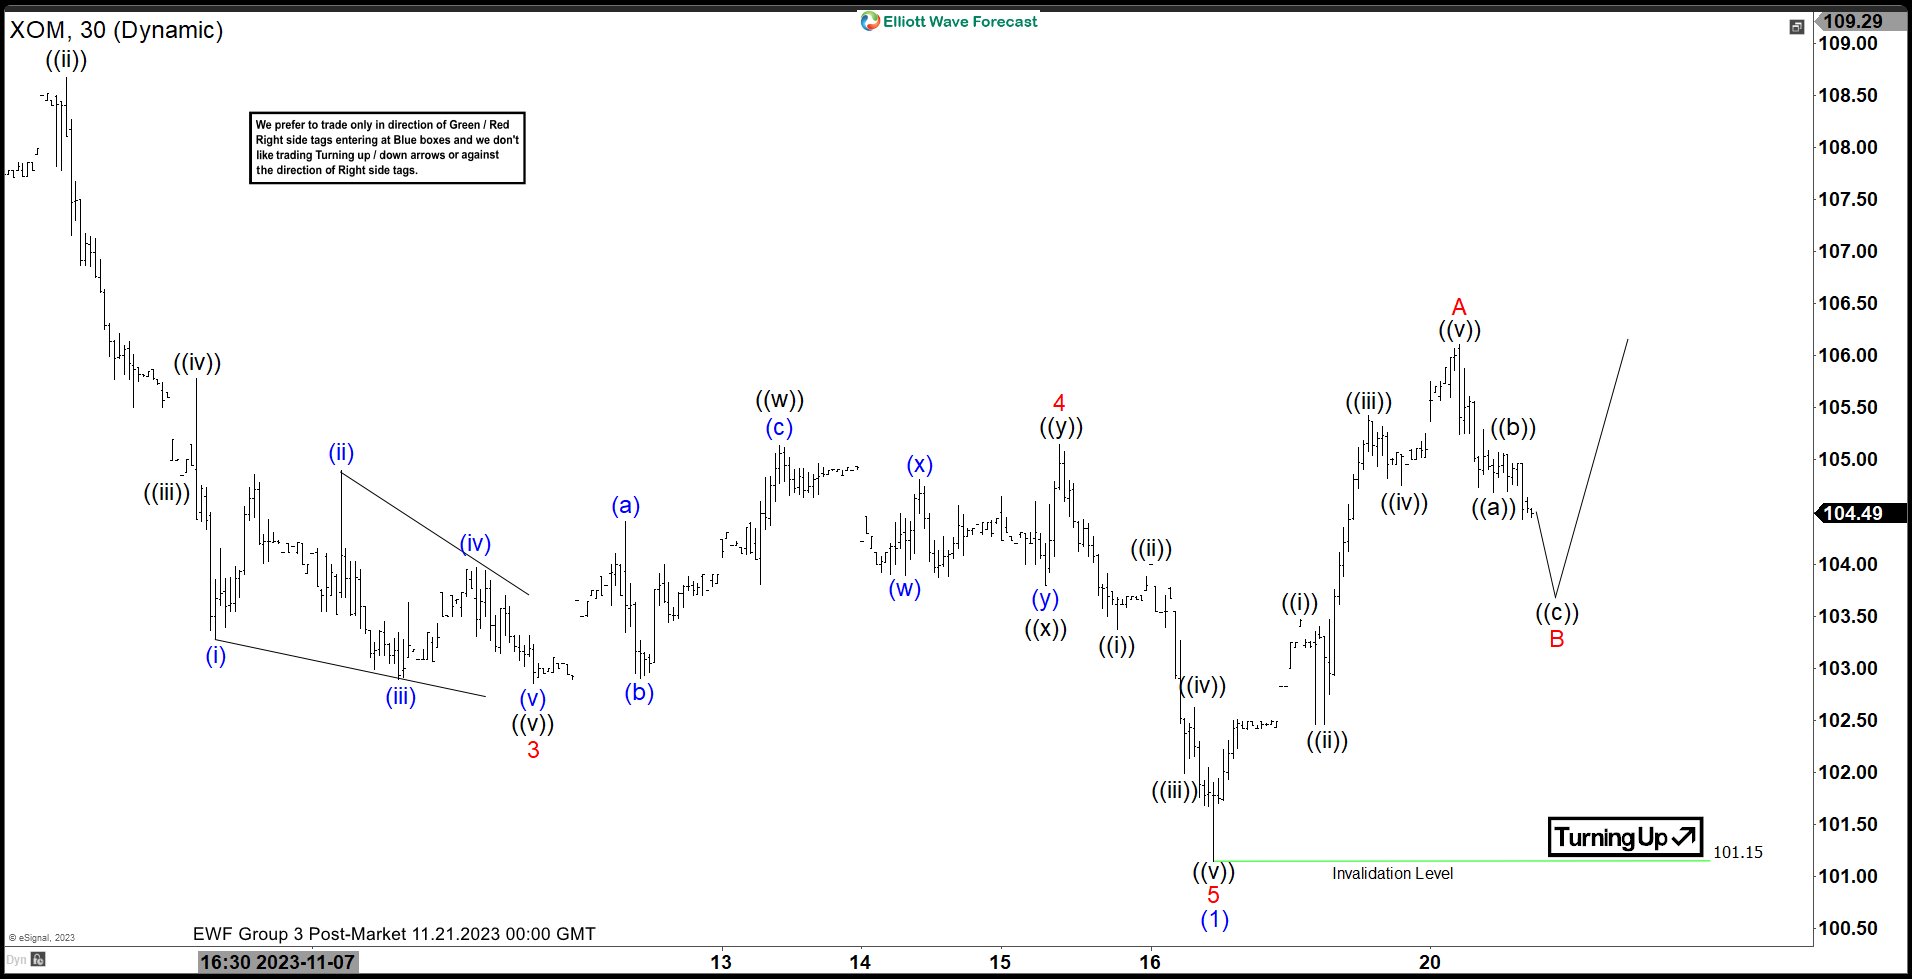 Here is the 1H Elliott Wave count from 11.21.2023. We were calling the pullback to find buyers at red B in 3 swings (ABC).
$XOM 1H Elliott Wave Chart 11.19.2023:
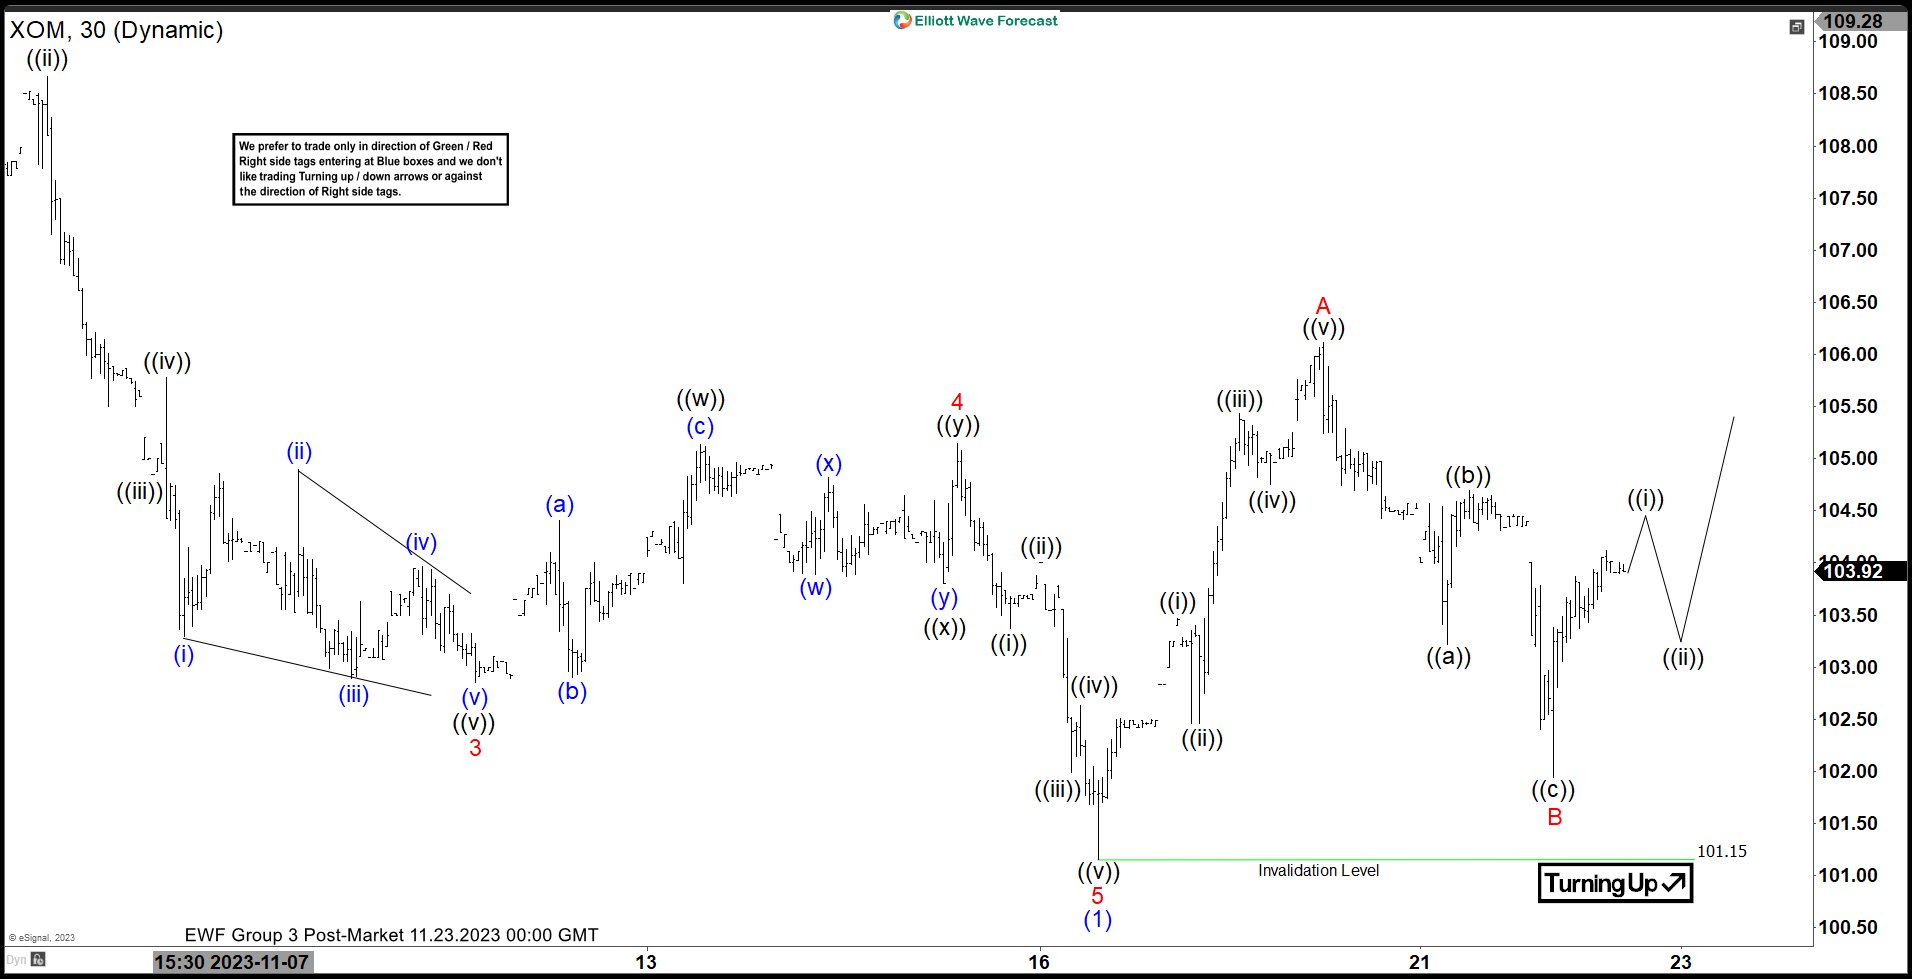 Here is the 1H update from 11.23.2023 showing the bounce taking place as expected. The stock reacted higher after reaching the equal legs area from 11/20 peak allowing longs to get a risk free position. We expect the stock to continue higher and reach $106 - 109 as long as $101.15 remains intact.