Facebook (FB) Elliott Wave Analysis: Pullback Remains In-progress
Facebook ticker symbol: $FB short-term Elliott wave analysis suggests that the rally to $203.55 ended primary wave ((1)). Down from there, the pullback in primary wave ((2)) remains in progress in 3, 7 or 11 swings to correct cycle from 3/26/2018 low. The internals of that pullback shows an overlapping structure thus suggesting that the correction takes the form of corrective structure i.e either (W),(X),(Y) or (W),(X),(Y),(X),(Z) structure within the intermediate degree.
Below from $203.55 high, the pullback is proposed to be unfolding as Elliott wave double three structure where Intermediate wave (W) ended at 193.11, Intermediate wave (X) ended at 200.75, and Intermediate wave (Y) of ((2)) remains in progress. The internal of Intermediate wave (W) also unfolded as a double three structure where Minor wave W ended in 3 swings at $199.31, Minor wave X ended $202.24 and Minor wave Y of (W) ended at $193.11 as a Flat. Up from there, intermediate wave (X) also unfolded in 3 swings as Elliott Zigzag structure with Minor wave A ended at $199.40, Minor wave B ended at $195.98 and Minor wave C of (X) ended at $200.83 high.
Down from there, intermediate wave (Y) of ((2)) remains in progress as another double three structure. Internals of that decline ended Minor wave W in 3 swings at $192.22 and Minor wave X ended at $197.45. Near-term focus remains towards $188.91-$186.90, which is 100%-123.6% Fibonacci extension area of Intermediate wave (W)-(X) to end primary wave ((2)) pullback. Afterwards, the stock is expected to find buyers for primary wave ((3)) higher ideally or should do a 3 waves reaction higher at least. We don’t like selling it into a proposed pullback.
Facebook ($FB) 1 Hour Elliott Wave Chart
What’s the latest on Facebook? any forecasts? it’s going to return its position next few months
Facebook Ends Cycle from IPO. What’s Next For The Social Networking Giant
Even today with the explosion of advancements in quantitative analysis utilizing the most sophisticated algorithms and artificial intelligence available the debate rages on between whether a technical-based trading methodology is superior to a fundamental-based trading methodology and vice versa. That debate is examined below via analysis of individual financial instruments such as Facebook (FB).
The price of Facebook’s stock has pretty much been on bullish rip higher ever since the IPO of 2012 reaching an all-time high over this past July at 218.62. However, the company has been mired in unflattering publicity that the fundamentalists claim has taken the wind out FB’s sails. The first chink in the armor of FB came during US General Elections of 2016 when a Russian company named Internet Research Agency start buying Facebook digital ads to allegedly spread propagandist messages about various politically hotspots that included religion and immigration. This event brought the company into the biggest crises of its short history. I have to say it’s definitely a unique event to see an American company as the tool of a foreign plot to influence a major democratic election. Even so, the stock pushed higher. However, on this very day we read about a seemingly endless series of “events” which are said to have caused the company stock to decline nearly $100/share with its most recent print of 126.85.
Facebook has billions of members and was perhaps the greatest information dissemination tool ever created. Far from its stocks perch of July 2018 FB hasn’t been able to control the narrative and the fundamentalist claim this has caused the stock price to plummet. The company tensions are playing out in the mass media with corporate leadership denials, tension, finger-pointing and even testimonies in front of Congress. After some 150 million Americans were exposed to the disinformation campaign of the Russian internet troll farm, Internet Research Agency crisis, FB wasn’t quick to come clean. Now Facebook is in crises mode trying to turn sentiment to not only the American public but to the entire world. The latest event happened last week when the news came out that the company hired Definers Public Affairs to downplay public statements and deflect public scrutiny onto rival tech companies. FB has since ended the relationship this week. It seems like one issue after the other.
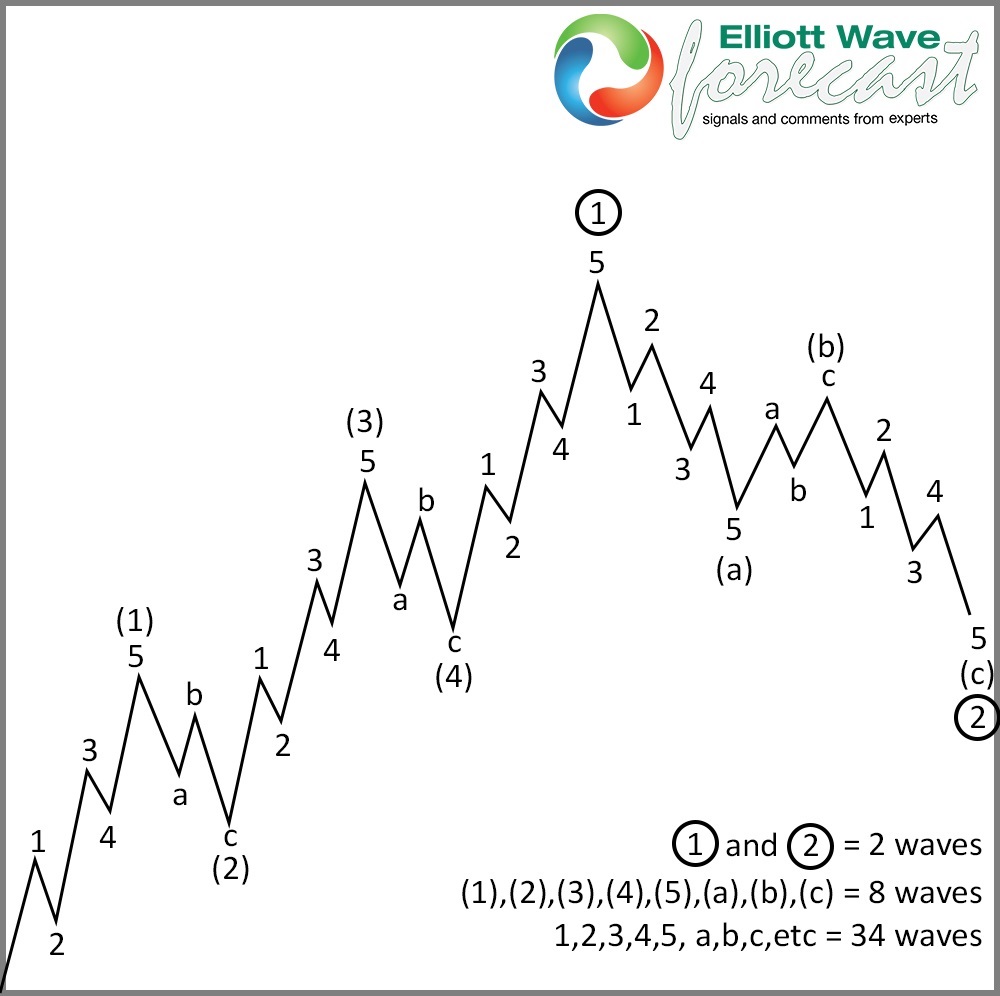
The events described above can definitely be part of the landscape of fundamental reasons that we now see such a decline in Facebook’s stock price. We haven’t even mentioned anything financially related. It’s simply how the masses currently “feel” about Facebook. I want to shift gears now and talk for about what we see are the technical reasons for the decline. This social network company held the initial public offering May 18, 2012. Since then we can see an advance in 5 waves from that day. The Elliott Wave Theory states that after a 5 wave advance then the instrument of analysis should regress in 3 waves lower. That sequence of 5 waves higher and 3 waves back lower is where we are now with regards to FB. The following chart shows the Elliott Wave Theory pattern of progression and regression for reference.
The Following chart show Facebook price action and showing the 5 waves advance and now 3 waves back.

Facebook Long-term Elliott Wave View

The Blue Box highlighted in the chart above encompasses a range from 135.22–101.72 and it is the area in which the 3 wave regression lower can be ending. We use these extreme areas to look for inflection points in terms of price reaction or to reverse a prior trend. In the case of FB it is in the area to look for a bottom. From the current price lows, we should see a bounce higher and also now is the time to expect the Fundamental analysis to align with the aforementioned brief primer on the technical. Something will happen to justify the coming bounce in terms of an “event”, “news”, or some other fundamental based “feeling”. In our view the Market’s nature advances in either 5 or 3 waves, but when it corrects it is always in 3, 7, or 11 waves. The question now is this decline all we will see? Or, is this the beginning of a deeper pullback and we will now only experience a 3 wave bounce higher that ultimately reverses in extension of another precipitous decline into the $80.00–60.00 area?
As we always say, nobody knows exactly what the future will bring. While it is evident that the possibility of huge decline is viable, knowing The Market Nature is the ultimate key. Buying FB within this box can be an unique opportunity that one should at least can expect a tradable bounce higher. If the bounce fails then there will be an even a greater opportunity lower. The reality is that the fundamental reason for lower price action is getting crowded and one-sided. The technicals are telling us that the company is about to stabilize and a solution to the current crises is on the horizon. Let’s see what happens!
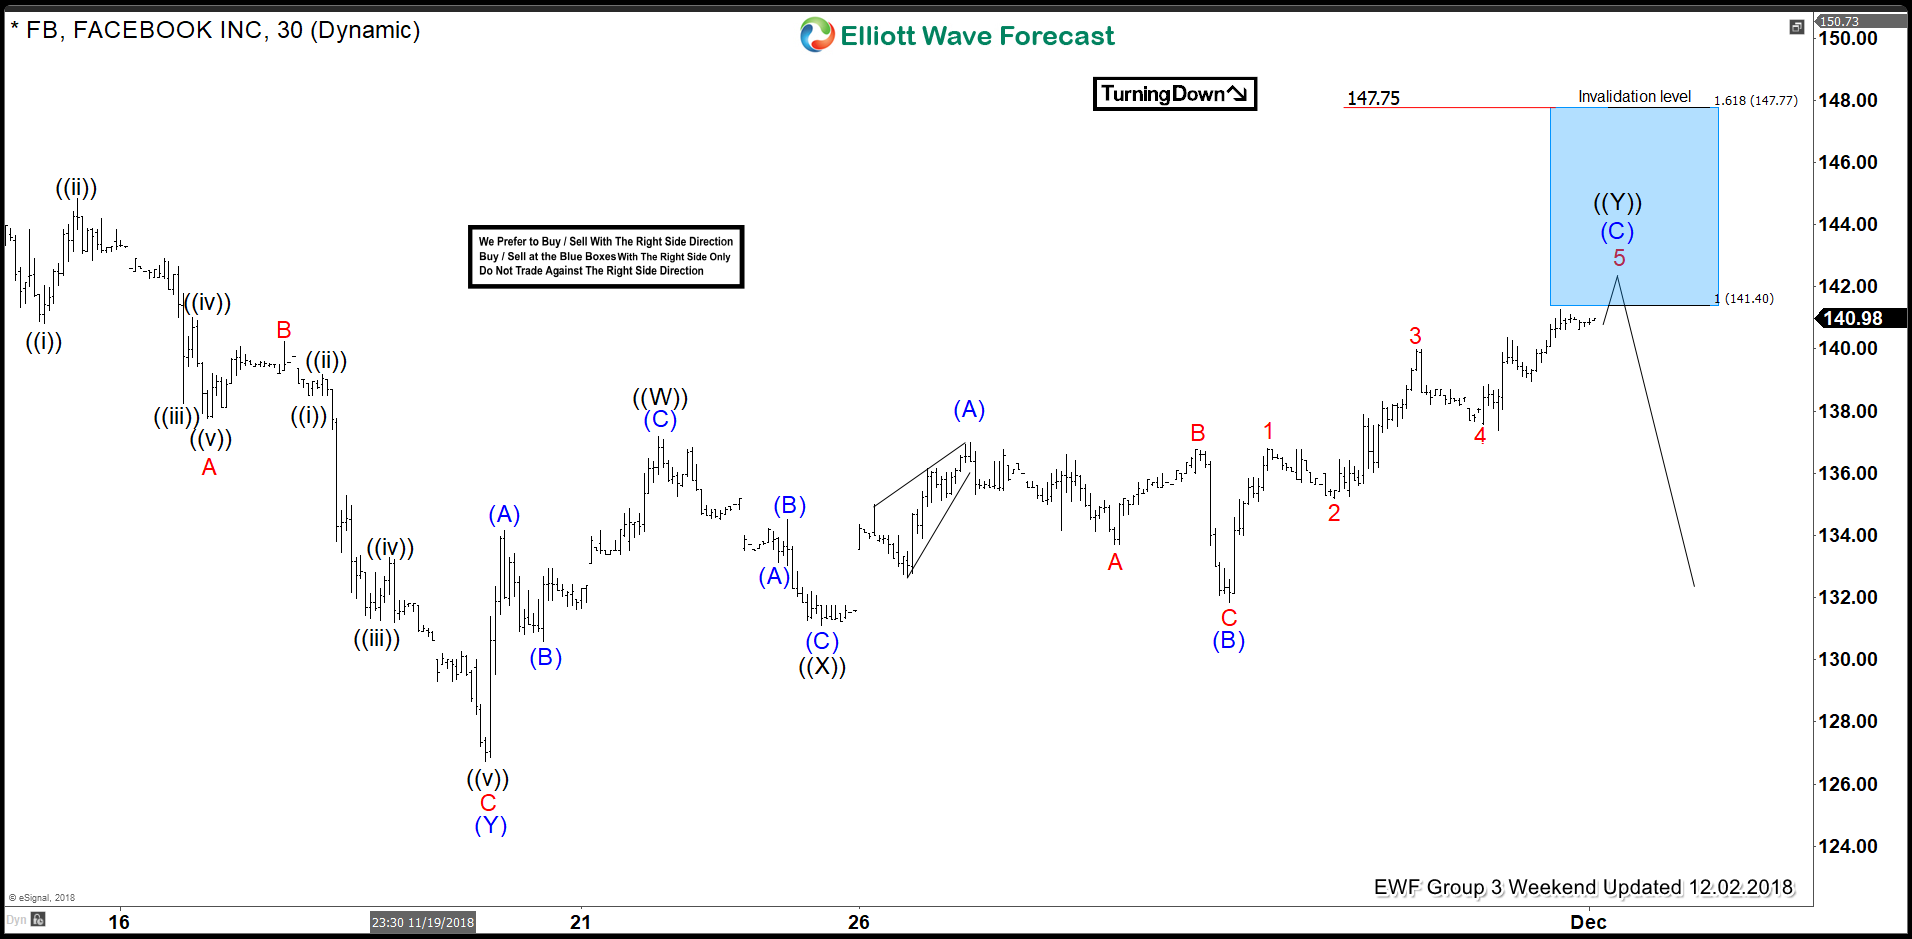
In this blog, I want to share some short-term Elliott Wave charts of Facebook which we presented to our members in the past. Below, you see the 1-hour updated chart presented to our clients on the 12/02/18. Showing that Facebook ended the cycle from 09/27/18 peak in red wave III at 11/20/18 low (128.45).
As Facebook ended the cycle from 09/27/18 peak, we expected a bounce to occur in red wave IV. Above from 11/20/18 low (128.45), the bounce unfolded in an Elliott Wave double correction structure. We advised members that Facebook ideally should continue lower. Therefore, we expected sellers to appear in the sequences of 3, 7 or 11 swings. At the 100 - 1.236 Fibonacci extension of black ((W))-((X)) which came at around 141.41-147.77 area and that was the first area for sellers to appear.
Facebook 12.02.2018 1 Hour Chart Elliott Wave Analysis

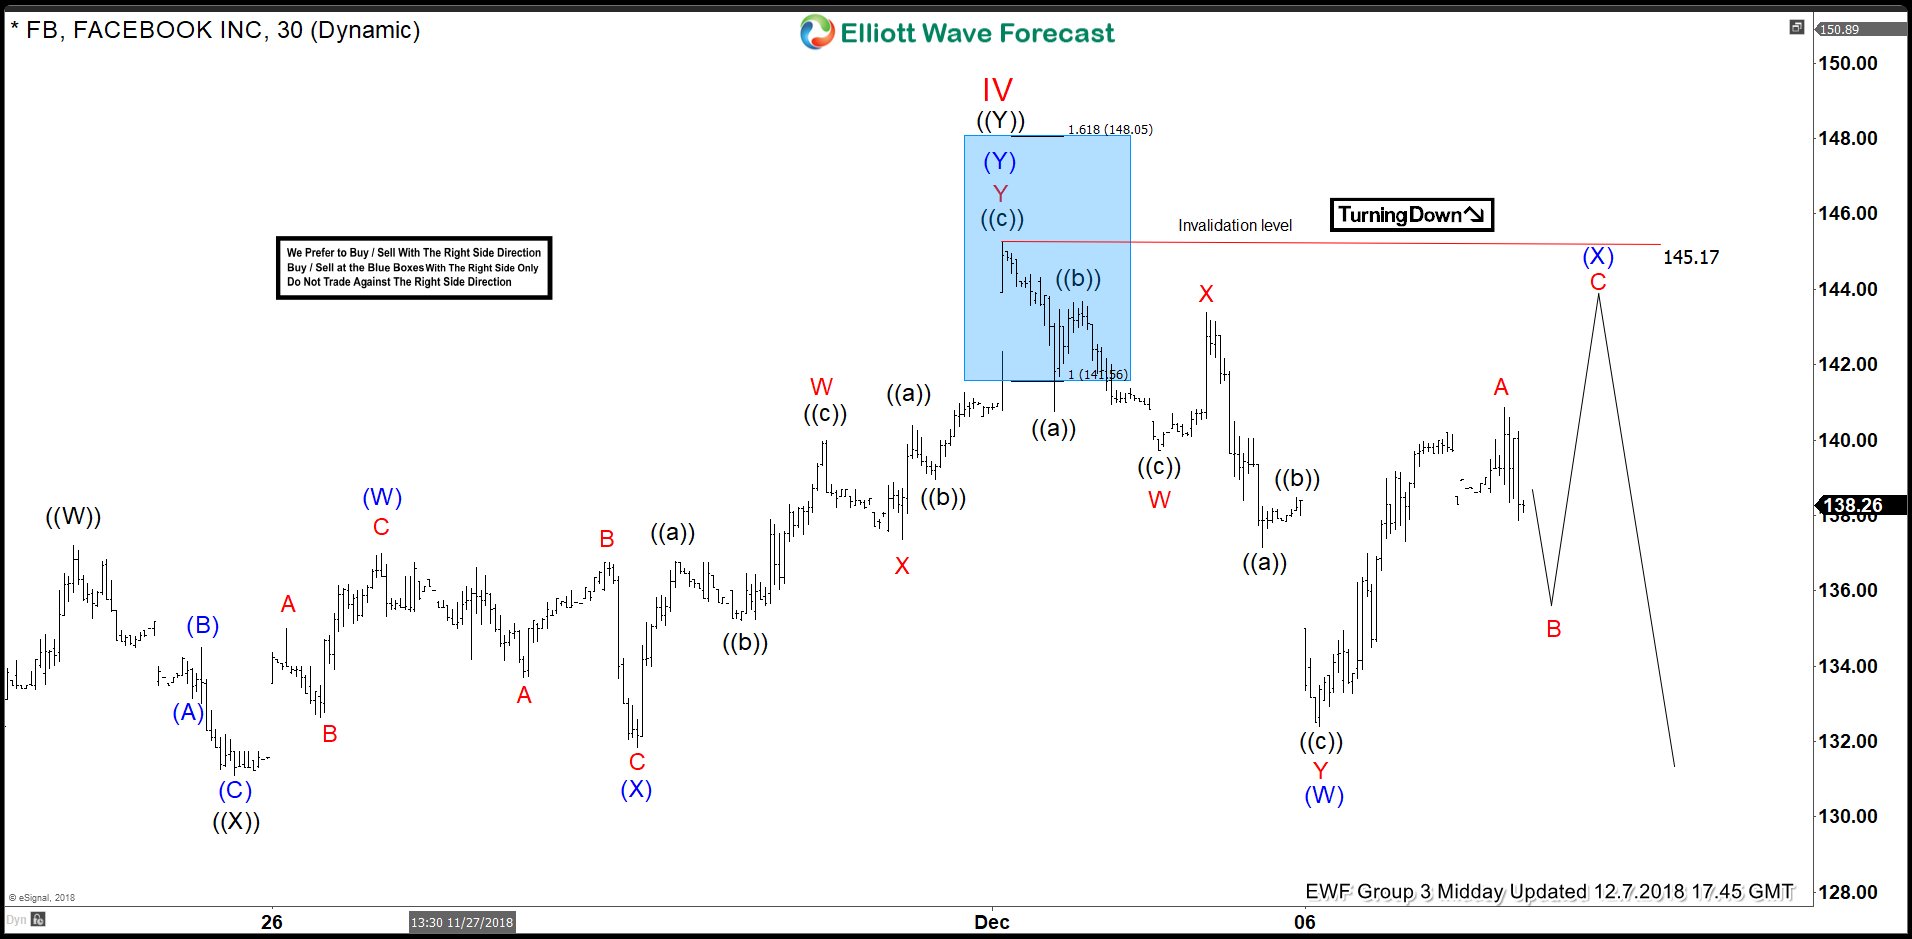
In the last Elliott Wave chart. You can see that the stock reached the blue box area (141.41-147.77) and reacted nicely lower. If traded our blue box area shown in the chart above. Then, any trades from that area were risk-free, which means the stop-loss should be moved to break even, targeting lower levels. Do please keep in mind that the 1-hour chart which I presented may have changed already. And as long as Facebook doesn’t break 11/20/18 low (128.45). A double correction in red wave IV higher still can’t be ruled out. This blog should just illustrate how accurate our blue boxes are, and how our members trade our 3-7 or 11 swings strategy.
Facebook 12.07.2018 1 Hour Chart Elliott Wave Analysis


