From March, November 2021 and October 2022, we have discussed the price action and the outlook for the Frozen Concentrated Orange Juice. As it has been expected, the soft commodities have advanced or they are nesting higher. In particular, we saw cocoa rallying. Others, like sugar, coffee and cotton are nesting before acceleration higher should take place. Hereby, orange juice futures OJ #F are the strongest. In fact, they broke to the new all-time highs.
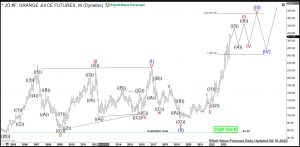
Orange Juice Monthly Elliott Wave Analysis 08.20.2023
The monthly chart below shows the FCOJ front contract OJ #F at NYBOT (e-Signal ticker: JO). From the important low in May 2004, the prices have developed a cycle higher in blue wave (I) of a super cycle degree. Hereby, wave (I) has demonstrated a leading diagonal pattern and has ended in October 2016 at 227.50. From the highs, a correction lower in wave (II) has unfolded as an Elliott Wave double three pattern. In 2.5 years, OJ #F has become cheaper by 60% reaching 90.60 level. Hereby, an important bottom in May 2019 has been set and the correction has ended.
From the May 2019 lows, a new rally within blue wave (III) has already started. As a matter of fact, break of the 227.50 highs has confirmed that. The target for wave (III) is 264.29-371.64 area and even higher. Even though the minimum target level being 264.29 has been reached already, OJ #F should still extend higher in series of waves 4-5. Also, wave (III) can easily surpass $372 and extend towards 2 and 2.618 multiples of wave (I) being $438 and $545 levels, respectively.
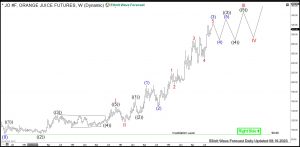
Orange Juice Weekly Elliott Wave Analysis 08.20.2023
The weekly chart below shows in more detail the blue wave (III). From the May 2019 lows at $90.60, we see 4 nests in red waves I-II, black waves ((1))-((2)), blue waves (1)-(2), red waves 1-2 and an acceleration in red wave 3 of blue wave (3) of black wave ((3)) of red wave III. Hereby, RSI reading has provided a higher high. Typically, waves 3 of 3 demonstrate higher highs in price and also in RSI. Now, series of waves 4-5 should take place. That should allow OJ #F for more upside. Currently, red wave 5 is underway. Once ended, a pullback in blue wave (4) and another 3 highs should take place.
Investors and traders can be, therefore, looking to buy FCOJ in short term pullbacks in 3, 7, 11 swings against 90.60 lows targeting 1.236 inverse Fibonacci extension higher based on the depth of the previous pullback.

