Fibonacci levels for intraday trading

In this thread I’m going to post intraday Fibonacci levels that I’m using for opening positions. Hope that will help.
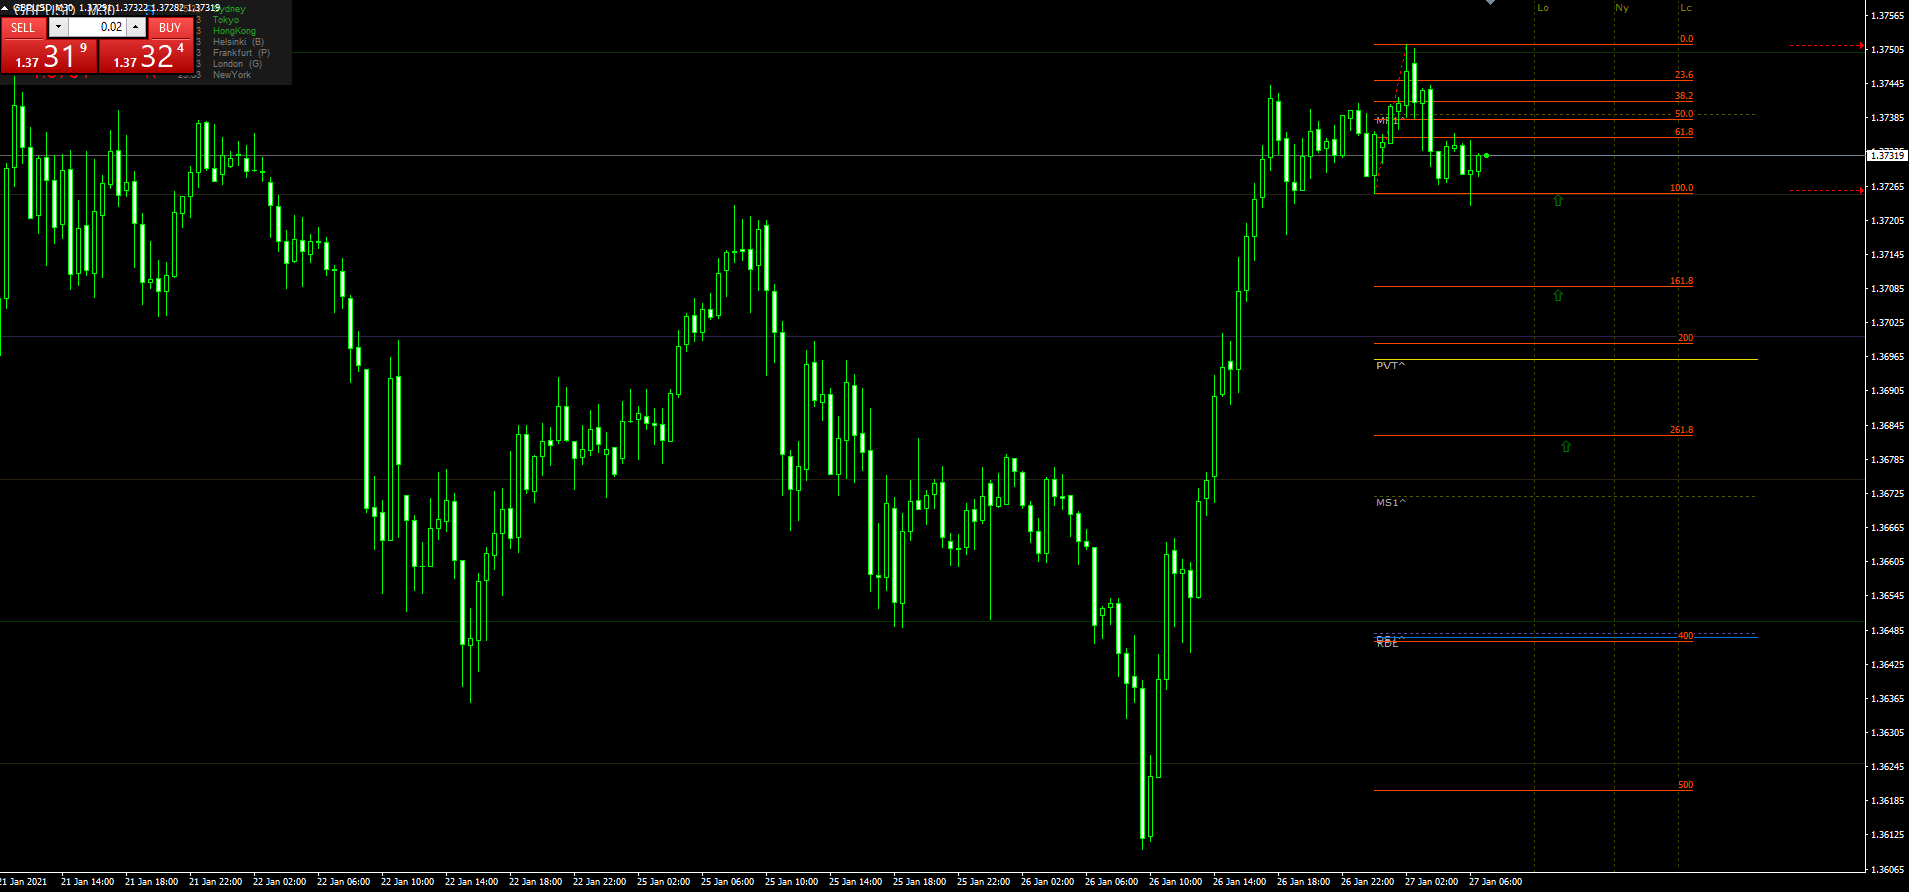
GBPUSD - 26/01/2021

Possible trend : DOWN

Here are the target Fibo levels :

N1: 1.3650
N2: 1.3632
N3: 1.3603

My plan is to take some buy orders when the price reaches these levels and take advantage of the rebound ; in the following graph, you can see my levels marked by some green arrows.

USDCAD - 26/01/2021

Possible trend : UP

Here are the target Fibo levels :

N1: 1.2767
N2: 1.2792
N3: 1.2850

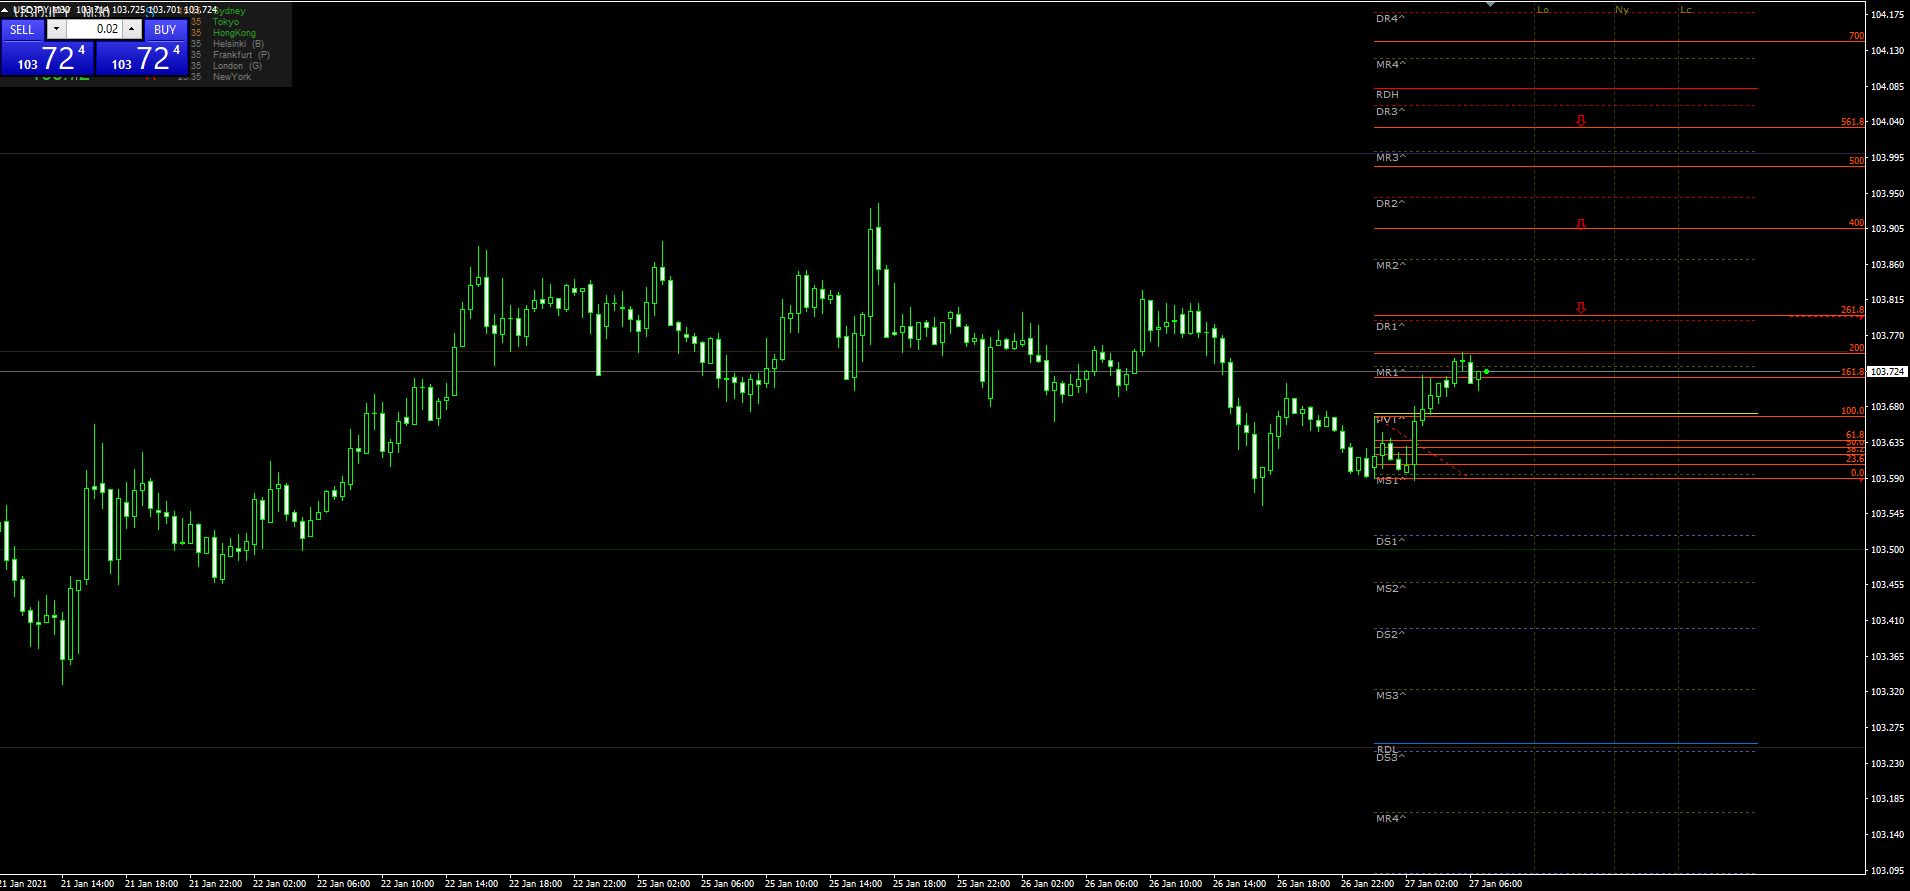
My plan is to take some sell orders when the price reaches these levels and take advantage of the correction ; in the following graph, you can see my levels marked by some red arrows.

I plan on following this thread cos I know this would help me better my experience on Fib.

Ps-checked out GU and it did well and might still be doing well.

Thank you. Fibo are the real deal.

Yesterday USDCAD and GBPUSD fibo levels were pretty good, the reversal was quite powerful.
Let’s see today’s Fibonacci levels.

EURUSD - 27/01/2021

Current possible intraday trend : DOWN

With that in mind, here are the levels where I’m intending to take BUY orders :

N1: 1.2153
N2: 1.2142
N3: 1.2128

In green arrows on the graphic (I will try to post better graphic when I figure out a solution) :

GBPUSD - 27/01/2021

Current possible intraday trend : DOWN

With that in mind, here are the levels where I’m intending to take BUY orders :

N1: 1.3725
N2: 1.3708
N3: 1.3682

In green arrows on the graphic :

USDJPY - 27/01/2021

Current possible intraday trend : UP

With that in mind, here are the levels where I’m intending to take SELL orders :

N1: 103.79
N2: 103.90
N3: 104.03

In red arrows on the graphic :

USDCAD - 27/01/2021

Current possible intraday trend : UP

With that in mind, here are the levels where I’m intending to take SELL orders :

N1: 1.2735
N2: 1.2761
N3: 1.2791

In red arrows on the graphic :

USDCHF - 27/01/2021

Current possible intraday trend : UP

With that in mind, here are the levels where I’m intending to take SELL orders :

N1: 0.8873
N2: 0.8882
N3: 0.8895

In red arrows on the graphic :

Hello everyone,

Here are the levels for today 28/01/2021

GBPUSD

Possible intraday trend : DOWN

With that in mind, I will take BUY orders at these levels :

N1: 1.3650
N2: 1.3626
N3: 1.3610

See green arrows in the following graph :

1 Like

AUDUSD

Possible intraday trend : DOWN

With that in mind, I will take BUY orders at these levels :

N1: 0.7622
N2: 0.7597
N3: 0.7563

See green arrows in the following graph :

USDCAD

Possible intraday trend : UP

With that in mind, I will take SELL orders at these levels :

N1: 1.2850
N2: 1.2891
N3: 1.2937

See red arrows in the following graph :

USDCHF

Possible intraday trend : UP

With that in mind, I will take SELL orders at these levels :

N1: 0.8909
N2: 0.8925
N3: 0.8944

See red arrows in the following graph :

Good morning everyone,

All yesterday trades have been closed with more or less profits, which is a good think ; it remains me only a USDJPY block of positions, which I’m planning to close today, if the market allows it.

That being said, here are the levels for today :

EURUSD

Possible current intraday trend : DOWN

In that context, I’m looking for BUY orders at these levels :

N1: 1.2090

N2: 1.2069

N3: 1.2039

See green arrow in the following graph :

GBPUSD

Possible current intraday trend : DOWN

In that context, I’m looking for BUY orders at these levels :

N1: 1.3700
N2: 1.3683
N3: 1.3659

See green arrow in the following graph :

AUDUSD

Possible current intraday trend : DOWN

In that context, I’m looking for BUY orders at these levels :

N1: 0.7634
N2: 0.7608
N3: 0.7579

See green arrow in the following graph :

USDCAD

Possible current intraday trend : UP

In that context, I’m looking for SELL orders at these levels :

N1: 1.2891
N2: 1.2932
N3: 1.2979

See green arrow in the following graph :

USDCHF

Possible current intraday trend : UP

In that context, I’m looking for SELL orders at these levels :

N1: 0.8910
N2: 0.8933
N3: 0.8965

See green arrow in the following graph :

Hello everyone,

Last friday, some pairs have changed intraday trend regarding the system rules ; when that occurs, I draw new Fibonacci levels in the direction of the new trend ; I didn’t have time to post updates last time, but I will try to post the updates next time they occur.

Reminder : in that system, when price touches Fibo level ZERO, we say that the intraday current trend has changed.

Here are the levels for today 01/02/2021 :

EURUSD

Intraday possible current trend : UP

In that context, I’m looking for SELL orders at the following levels :

N1: 1.2137
N2: 1.2148
N3: 1.2163

See red arrows in the following graph :


GBPUSD

Intraday possible current trend : UP

In that context, I’m looking for SELL orders at the following levels :

N1: 1.3738
N2: 1.3761
N3: 1.3788

See red arrows in the following graph :