Fibonacci Made Easy

I don’t know why, maybe because those “forex coaches” like to make money off newbie traders, but for some reason with most things in forex the simplest of things are turned into insurmountably complex ideas and theories that leave people frustrated and confused instead of educated and empowered. And never has this been more true than in the case of Fibonacci Lines. More literature and debate has gone into this area than most of the other 1,001 indicators, and more “expert” use them to baffle and confuse traders than any other indicator . But it only shows that these lines are hugely popular and important to trading success. And I am about to give you a very simple lesson on how to use them.

[B]Why are Fibonacci Lines so important?[/B]

Just as support/resistance and pivot point lines work so well because big banks and thousands of successful traders use them in their trading strategy each and everyday, the same goes for fib lines. It becomes a self-fulfilling prophecy when so many people see the same things and interpret them in similar ways. They work on any timeframe and with any commodity (oil, gold, stocks, futures, etc.).

Traders use these lines for two crucial reasons: 1) They are great at predicting where a retracement will likely end and 2) they are great at predicting where the price action will continue towards once the retracement period had ended. So in other words fib. lines tell you where you can jump back into a major trend when a currency pair starts retracing and where to take profits on that same trade once the pair resumes in the direction of the main trend.

[B]How do fib lines do this?[/B]

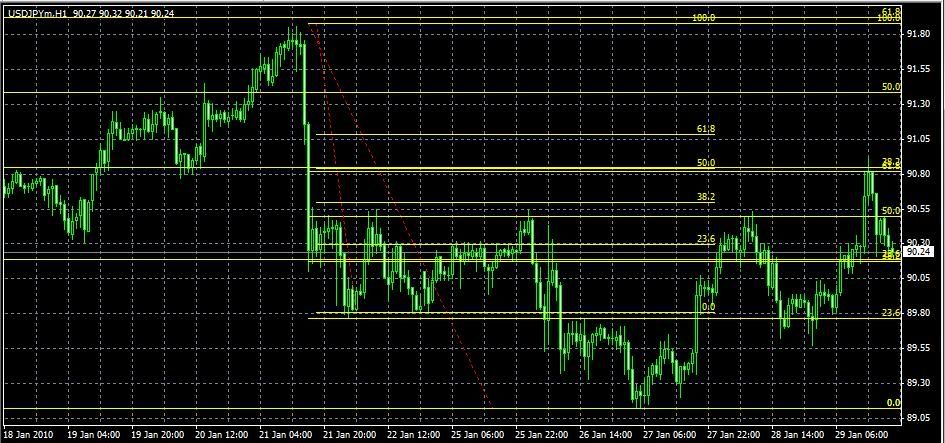
Continuing along with the above two points, you can think of fib. lines as having two distinct functions: retracement lines and extension lines. One tells you key levels to watch for support/resistance during a retracement, the other tells you where you should set your T/P once the trend resumes its original course. Here’s a pic that shows how I used fib lines to predict where the EUR/USD was headed after a brief retracement period. *** I would love to post the pic, but then the moderators are one infraction away from kicking me out of here due to useful links that broke the “rules” when including in my post. For those interested, there is a link provided through my user profile.***

[B]How to draw fib lines
[/B]
So let’s go over what that pic showed you. First in order to draw your retracement and extension lines you need a swing high and swing low point (points A and B in the picture). Now there’s no science behind picking these two points because everyone interprets their own charts a little differently, so you try to get as close as possible to what everyone else sees. How do you do that? One good method is to look for long wicks on the candle sticks because that usually indicates that a reversal is in the making.

Once you can clearly see that price action is in a true retracement you wait and see at what level does the price action encounteres support (in a up trend) or resistance (in a down trend). Usually that level corresponds to the 38.2, 50, or the 61.8 retracement levels. Aggressive traders will jump into a position right at each one of those levels with their S/L 10 pips above it, then if that didn’t work out and price continues to the next retracement level, they will jump back in again. This explains why price action apears to be in a tug-of-war at certain times. At some point the retracement period will end and then price action will continue back in the direction of the trend and those aggressive traders will make up for lost pips. A conservative trader, like myself, will just wait and see where price action actually did finish retracing, and then jump in a little late but safer and with less stress, still knowing where the trend should meet support/resistance again based on the extension levels. I would rather go for 80% of the safe pips than try and snatch up the 10% to 20% of the pips that I miss out on through waiting. Remember in trading it’s not about how much you make, its how much you make AND can hold onto in the long run.
[B]
Rules for success when using fib lines[/B]

So what are the rules for where price action will go once we see its finished retracing and back to trending in the original direction again? Again, this is not an exact science here so you don’t want to just place your T/P right on one of these lines, as prices may not quite reach the line, since other traders are interpreting their own fib lines and acting accordingly too. But in general the rules go:

23.6 will continue on to 118 or 127

38.2 will continue on to 138.2

50 will continue on to somewhere in between 138.2 and 161.8 (use other indicators to know where)

61.8 will go to 161.8.

The big ones to always watch for are the 38.2, 50, and 61.8 retracement levels and their corresponding extension levels. I’d say about 75% of the time those levels are the ones that end up being hit.
[B]
Setting this up in MT4[/B]

So the last thing I need to do is tell you how to draw these lines within your MT4 platform. Sorry for those of you who use other platforms, but you still learned the bulk of the lesson. Now for certain reasons, MT4 designed their platform to have two separate fib tools, one for retracements and one for extensions. But as I just showed you, both of them are used in conjunction with the other, so I just combined them into the retracement tool so that I don’t have to draw the lines separately. Here’s how to do it.

Place a fib retracement on you graph (it’s the 7th button from the lower left row of your chart toolbars in MT4). Then go to Charts, then Objects, and then click on Objects List where you will see the “fibo line” as it’s listed as. Highlight it by clicking on it once, and then click on edit to your right. Once in there you can input levels of your own. Input the levels and their corresponding descriptions in this order:
Level Description
0 --------0.0
.236 -----23.6
.382 -----38.2
.5 -------50
.618 -----61.8
.786 -----78.6
.86 ------86
1 --------100
-0.18 -----118
-0.27 -----127
-0.382 -----138.2
-0.618 -----161.8
-1.618 -----261.8
-3.236 -----423.6
One more trick: Click the Fibo level tab, then type next to the numbers in the description, %$. This will give you the corresponding price for each level you have selected.

Now whenever you go to draw a fib retracement you’ll have both the retracement lines and the extension lines drawn simultaneously!

There’s two more points I have to address here. The first is the “bonus” levels of 261.8 and 423.6. You’ll see these levels reached sometimes when applying fib’s on the lower timeframes and they are bonus rounds you could say for an extension. The rules you follow to know if the bonus round will happen is if you see the 161.8 level broken AND then retested as support/resistance AND it holds up as such. In that case your likely going to see the 261.8 target hit and if that holds up as support/resistance you can expect 423.6 to be reached. Lock in profits behind the 161.8 line just to be safe.

The second rule, and this is a real crucial one, is that fib’s are ALWAYS to be used in conjunction with other indicators. They are not a standalone kind of thing where you can base your decisions exclusively on these lines. You should have moving averages telling you what the main trend is doing, your own support/resistance lines as well as pivot points confirming retracement and extension levels, and whatever other indicators you specifically rely on to make decisions.

If you have any questions, feel free to comment below, otherwise good luck trading!

Thx. Nice post.
I’ll take the risk on my first post.

hope i finally learn fibonacci…

thank you for start this treath

I thought the target/extension for the 23.6 and the others below 61.8 is the 161.8 and the 78.6 target is the 127. Reason is faster moving markets at times will only retrace at a level below 61.8, so the extension is normally higher(161.8) while slow markets will retrace all the way to the 78.6 there about and make a smaller extension.

And the answer here is sometimes and this is where it gets complicated, so I’ll just say stick to the 3 main retracements levels (38.2, 50, and 61.8) and their corresponding extension levels and you’ll at least not get overwhelmed with this indicator. Faster moving and slower moving markets do react differently though, but that’s another discussion.

And thanks tybizzel. Maybe the moderators will see the usefulness in applying reason to the rules that they create instead of the black and white standard that’s almost got me banned. I believe everyone can be successful at trading and believe in forums like this one to help create that reality in new traders. I believe the moderators want the same thing too!

i have to agree fibonacci is extremely important but the problem being it is only half taught to new traders!

when using fibonacci one retracement level is not always enough, if you can draw several fibs from several swing highs to swing lows on several timeframes and find a combination of the 3 key levels that all correspind around a particular price level then this will most likely serve as the turning point in price action.

there is a perfect example of this on the USD/JPY at the moment, i will post the chart along with comments in a minute

lee

ok here is the image of the fib lines i have drawn up on the USD/JPY at the moment

i used the hourly, 4H and daily chart to draw these.

the 38.2 retracement level of the fibo drawn from the daily chart lies around 90.82

now the 50% retracement level of the fibo drawn from the 4H chart also lies around the 90.82 level

and finally the 61.8% retracement level of the fibo drawn on the hourly chart also lies around 90.82

now we have 3 diferent key levels corresponding at the same price level but on diferent timeframes, this is a very strong reversal signal!

on friday i placed my sell order at 90.82 and just before 3pm GMT my order was hit and i am now 60+ pips in profit :slight_smile:

there are also several other fibo techniques that can be used but i’ll give everybody a chance to grasp this concept first before going into more detail

hope this helped :slight_smile:

lee

Good to see another thread focused on fib levels. I know for sure they are powerful levels to take a look at.

May I ask how you confirm where your actual turning point is or what other tools you use?

All the best.

I’ve always wondered about the roots of Fib lines. Considering that in the early days of their implementation, they tool was not widespread and only calculated by a select few people at the end of each trading day. They must have found SOME relationship between price action and Fib lines prior to the self-fulfilling prophecy effect came into effect. Otherwise, its popularity would never have increased so.

i have too thought about this and heres my theory

market movements are formed by either impulsive or corrective movements, i think it boils down to basic human psychology, 50% or half has always been a key number regardless of its context, so in financial markets once a move has retraced by 50% or halfway most traders believed the corrective move was over and jumped back in with the longer term trend but as with everything you have impatient and patient people, the impatient people were those that couldn’t help jumping in slightly before that 50% retracement level incase it wasnt hit and the impulsive move continues without them,this is were fear of missing the move comes into play hence we have our 38.2% level, you then have the patient people who are willing to wait for it to surpass the 50% mark and feel as though they are getting an even better price and a higher probability trade hence the 61.8 level. then some genius came up with the application of fibo ratios in the financial markets which seemed to fit almost perfectly into what was actually happening here so those ratios pretty much became the golden self fulfilling ratios they are today :slight_smile:

lee

hopes for an informative, beginner friendly, BIG fib thread

First q: Different fib levels for the majors ( eur/gbp/aud/USD, USD/jpy/chf, eur/bgp)? I believe this whas somewhat discussed in Moneybags thread, would be great with some clarification:)! Example: Moneybags said the eur/gbp retraced @ the 0.786 line.

Now to profitforextrader:
Thx for the “basic” fib example:), BUT, did you reuse the fib line? As it worked again if im not totaly mistaken. What would you have done if the pattern didnt work out? When does a fib divergence become invalid ( seeing as it worked again)? Hope im beeing clear here:p!

To contribue something, ive found that correctly drawn fibs are great for catching reversal patterns when one uses the bollinger bands, I.E outside the bbs, not that this matters to ppl who doesnt use them but still:).

first off there is no particular ratio that works with a specific pair, ie all fib ratios are used on all pairs, the difficulty is determining which one of those levels if any the price will actually begin to reverse at.

now there are many diferent techniques and ways to use fibonacci ratios, as well as the most commonly used fibo retracements and extensions, you also have some slightly more advanced techniques such as fibo projections, symmetry and price clusters but generally these are all used for the same purpose, to identify possible support and resistance as well as possible price targets. unlike conventional support and resistance these price levels do not hold very long and often become invalidated when price either retraces past the fib ratios or continue to head towards its extension levels.

so to answer your question yes i did use that particular level again, i shorted from 90.82 but instead of using extensions to set my take profit i just simply placed it 5 pips above above the psychological support at 90.00. during the night my tp was hit for a profit of 76 pips inclusive of the spread, at 8 in the morning i saw price was heading back up so put in another sell limit at 90.82 and again my order was hit and i closed that position out 90.36 not long ago for another profit of 45 pips profit inclusive of spread.

there is no rule of thumb when using and reusing fibos it comes entirely down to your personal preferances and your trading style but i always follow the saying of “if somethings not broken why fix it?” lol its worked out quite well for me so far :slight_smile:

lee

i like this thread so far, its helpin my out pretty well but i still have a tough time using fibo extensions. finally got the retracements down tho :slight_smile: how bout some more charts just for reference?

Fib traders look for retracements at natural fib extensions.The extension levels are projected exaution levels for the market. In the chart shown you will see that the retrace was to the 61.8, therefore the natural extension would be the 161.8. When it reaches this level a retrace is anticipated which happened in this case.


Here you will find a few examples of trading extensions.
http://forums.babypips.com/show-me-money-daytrading/30468-counter-trend-trading-fibonacci-bounce.html

ty for the new info i appreciate it :stuck_out_tongue: gonna try some trades using fibos :wink:

Thanks for your answer Lee, much appriciated:)!
Kind of one i was hoping for also, with the fib reuse & the ratios, entering on a fib is cheating, but doing it twice thats stealing :D!

Now heres a 1H chart, where i draw my fibs, its drawn from the start of the week, not the top, the bands help more to choose an entry, for me at least.
As you can see, 3 times the price hit, meaning you could get stopped out, and entered again, or just kept your stop loss with no worries. Good thing about the 1h lines is that you can “check” them on the 30 min. Also there was no science behind the #161 line, could have said 23, just a feeling with the bbs and all. AND i enter + 5 to +15 pips from line, and a 30 pip stop loss FROM the line.

I have also used line convergence when lines from two or three weeks cross, but again im hoping for a reversal pattern, not a spike. There is also some checking to be made with the 1Htf where the lines are, and the 30mtf. Not blindly jumping on a line but doing some consideration first, very important. What i do need is more drawing practice, i realise weekly start to finish drawings differ, its just that they have worked so well:o. Ill put two charts from this weeks aud/usd so you can see what i mean, how they change hehe.

What i like most about this method is the profit potential, with the low risk, but its scary when that 1hour train comes thundering towards you, do you bail out or call the bluff?:cool:

looks like the gbp/usd worked out well, a cheat entry on the fib and a confirming reversal pattern, now too bad i didnt take it myself hehe, a VERY great combo example indeed!


If anyone had trouble when setting this up in MT4, I hope you didn’t just give up. My haste to post the lesson caused me to leave out some crucial information. I updated the thread with the levels (which I had forgotten) and then their corresponding descriptions. Sorry for the mess up, but now it should look just like my own when you set this up in MT4.

made 190 pips today off of fibs :smiley:

As, a trend trader, I like to draw fibs from the high of the corrective move to the low of the impulse move for every leg of the trend. This allows me to easily gauge trend strength and assess whether to stay in or close out. In my case, if price closes above 50% retracement, I will close out of the position if there is no other resistance level very close by.

A simplified setup:

(Click for higher res)

On the last leg where it penetrates 50%, it went to test the swing high of the 3rd to last leg and a doji formed. Price closed down the session after, so I re-entered.

hi,

You have simply said out the point exactly.
I am using price action to do my trading and fibo is quite important to me.

I have a question, is it trend always ended at 423.6?

I have a concept to identify the overall trend, drag fibo, if it reach 423.6, means that there is reversal taking place.

Do you agree to it?

yeo
newbie