Ford Motor Company is an American multinational automobile manufacturer headquartered in Dearborn, Michigan, United States. It was founded by Henry Ford and incorporated on June 16, 1903. The company sells automobiles and commercial vehicles under the Ford brand, and luxury cars under its Lincoln luxury brand.
FORD (F) Daily Chart November 2022
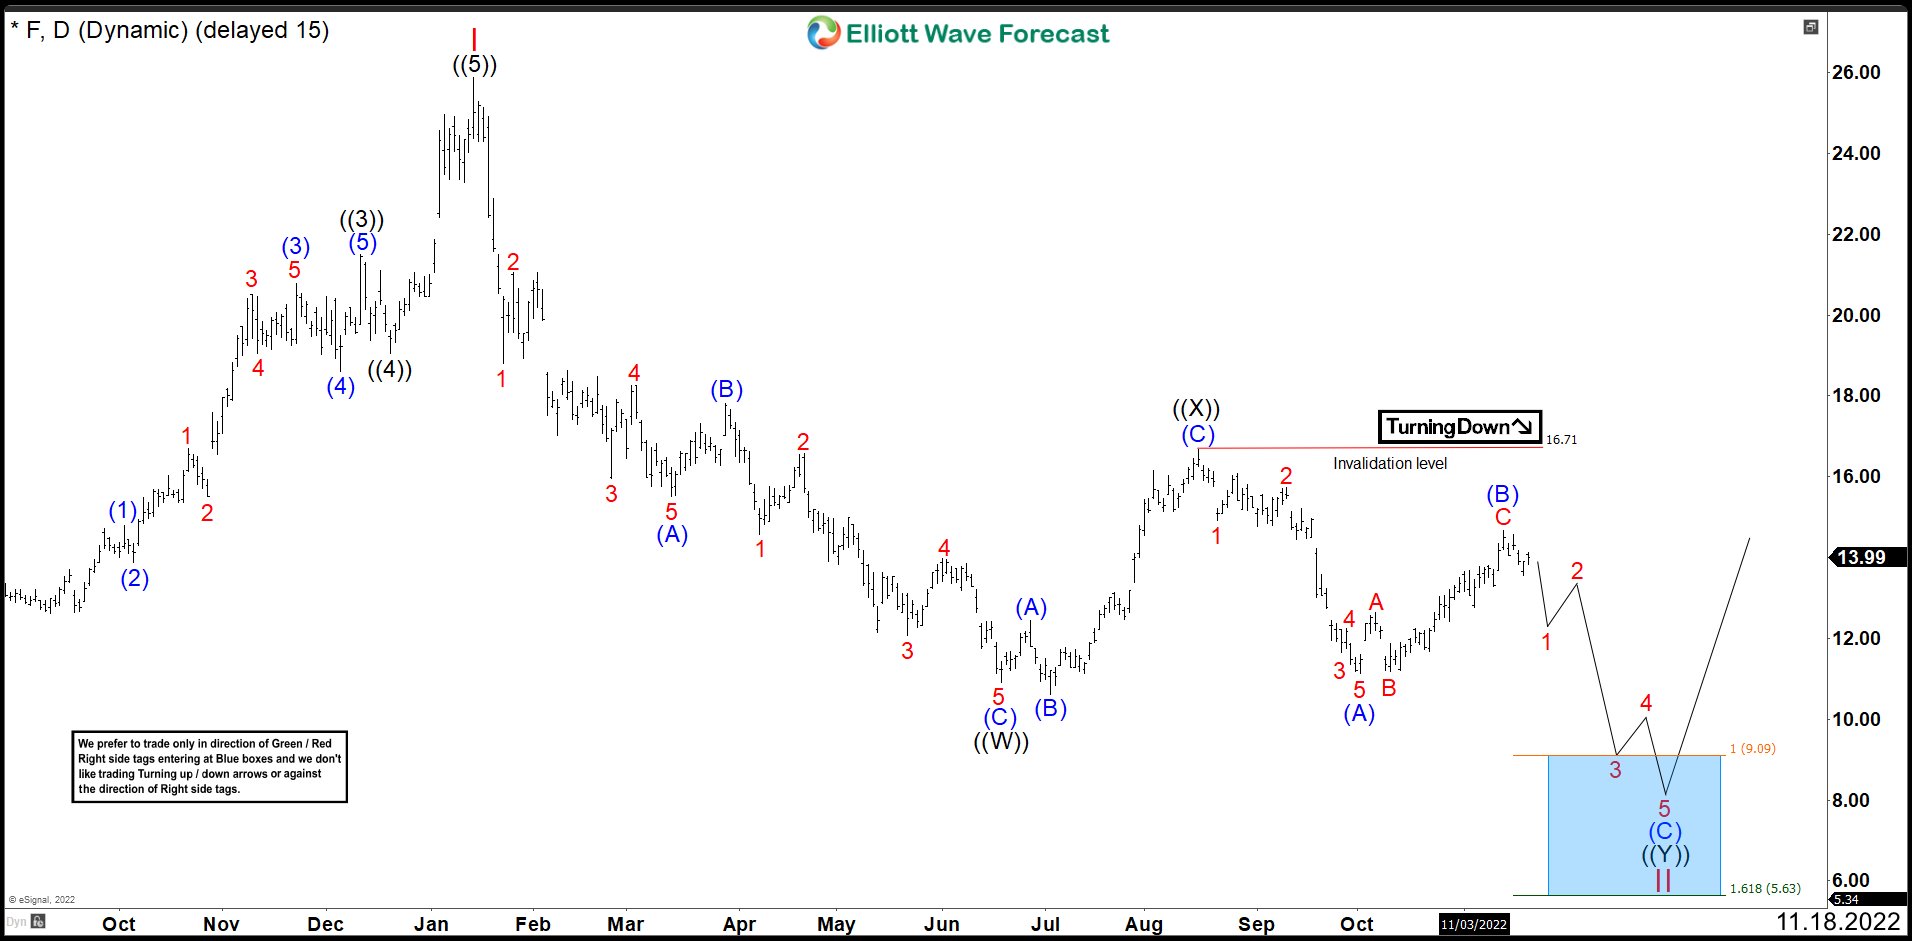 From the top of wave I, we can see 3 swings down ending wave ((W)) at $10.88. Then, we saw a 3 swings bounce forming an expanded flat correction that ended at $16.71 to complete the connector ((X)). Now to complete the double correction structure we need 3 more swings down to break below $10.57. Wave (A) of ((Y)) ended at $11.11. Wave (B) seemed to have finished making another flat correction at $14.67 and we expected more downside, but this did not happen as we thought.
FORD (F) Daily Chart March 2023
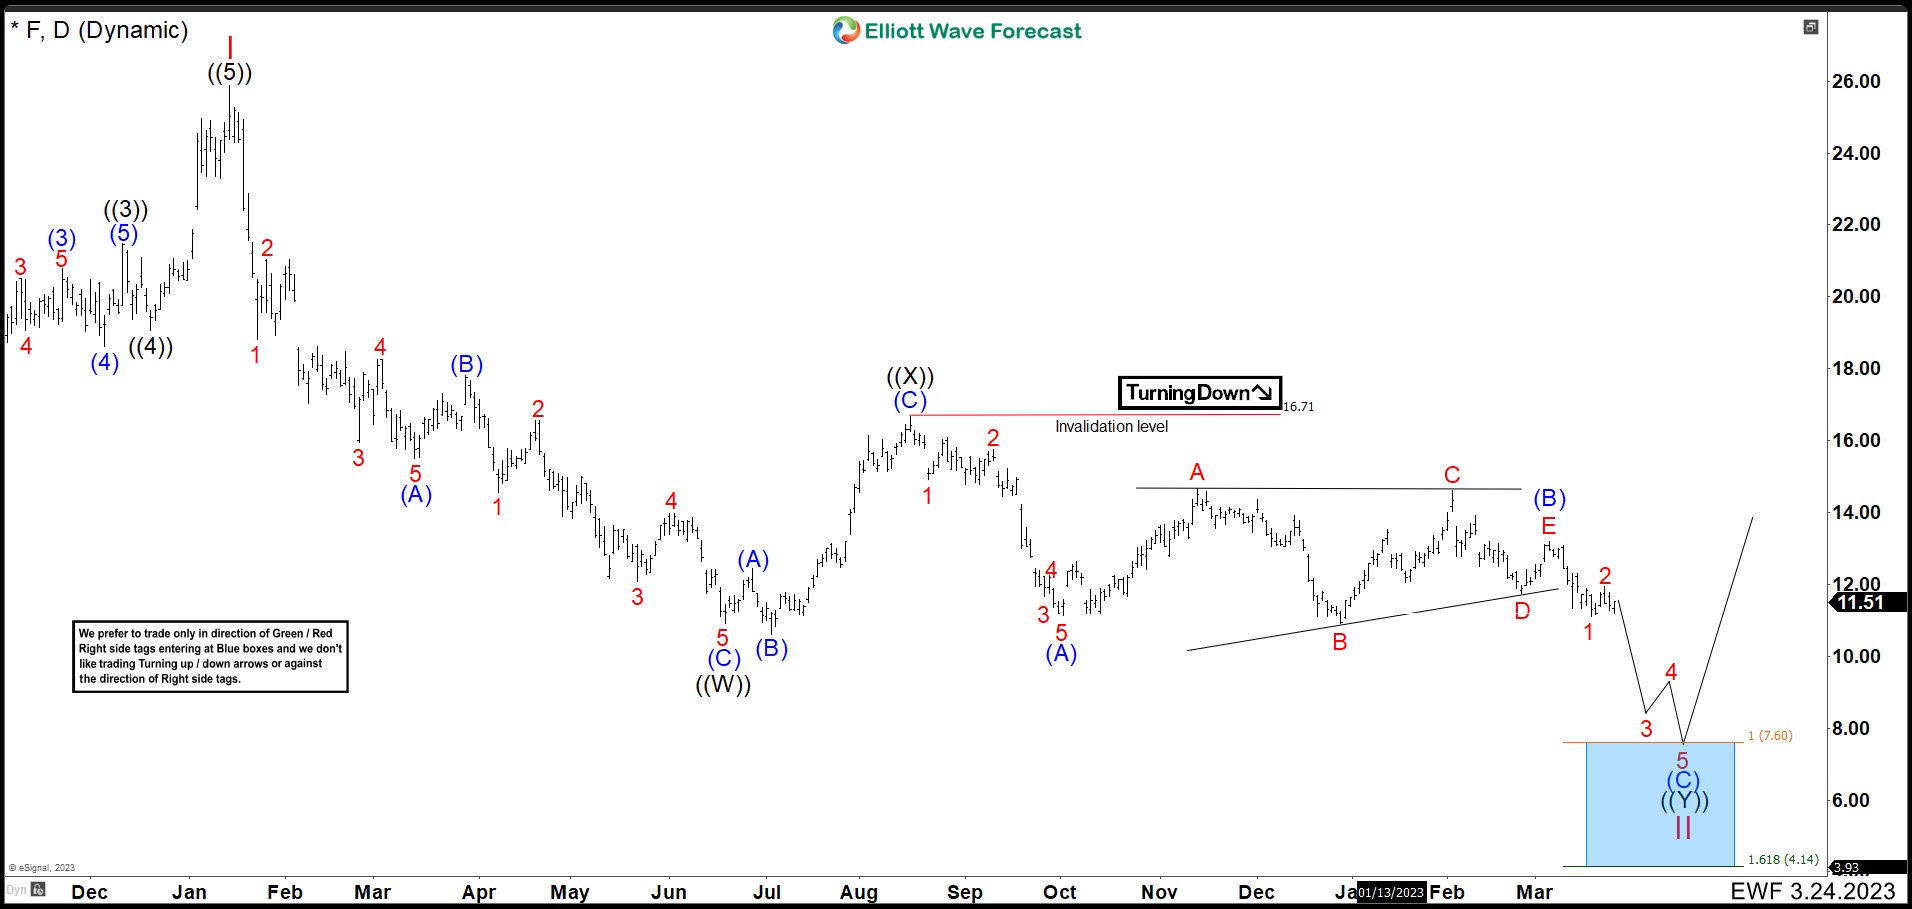
After 4 months, we can see that Ford (F) price remained sideways creating a triangular structure. For this reason, it is preferable to adjust the Elliott count and the wave (B) is better a triangle that ended at the price of $13.20. From this value the shares should keep the downward movement; however, to confirm the continuation of the downtrend it must break $10.57 low. After breaking this level, the drop should accelerate to form the impulse proposed as wave (C).
There are some alternatives looking for the best area to buy the stock in long term. The most indicated is the $9.09 - $7.60 area. This area is created for two differents 100% Fibonacci extension. However, if the market breaks down below $7.60, it would be better to check the impulse Elliott wave structure. This would be looking to buy FORD (F) after seeing 5 waves to the downside and a significant bounce that suggests that wave II is over.
Source: https://elliottwave-forecast.com/stock-market/ford-f-stock-must-lose-value/