Ford Motor Company is an American multinational automobile manufacturer headquartered in Dearborn, Michigan, United States. It was founded by Henry Ford and incorporated on June 16, 1903. The company sells automobiles and commercial vehicles under the Ford brand, and luxury cars under its Lincoln luxury brand.
FORD (F) Daily Chart March 2023
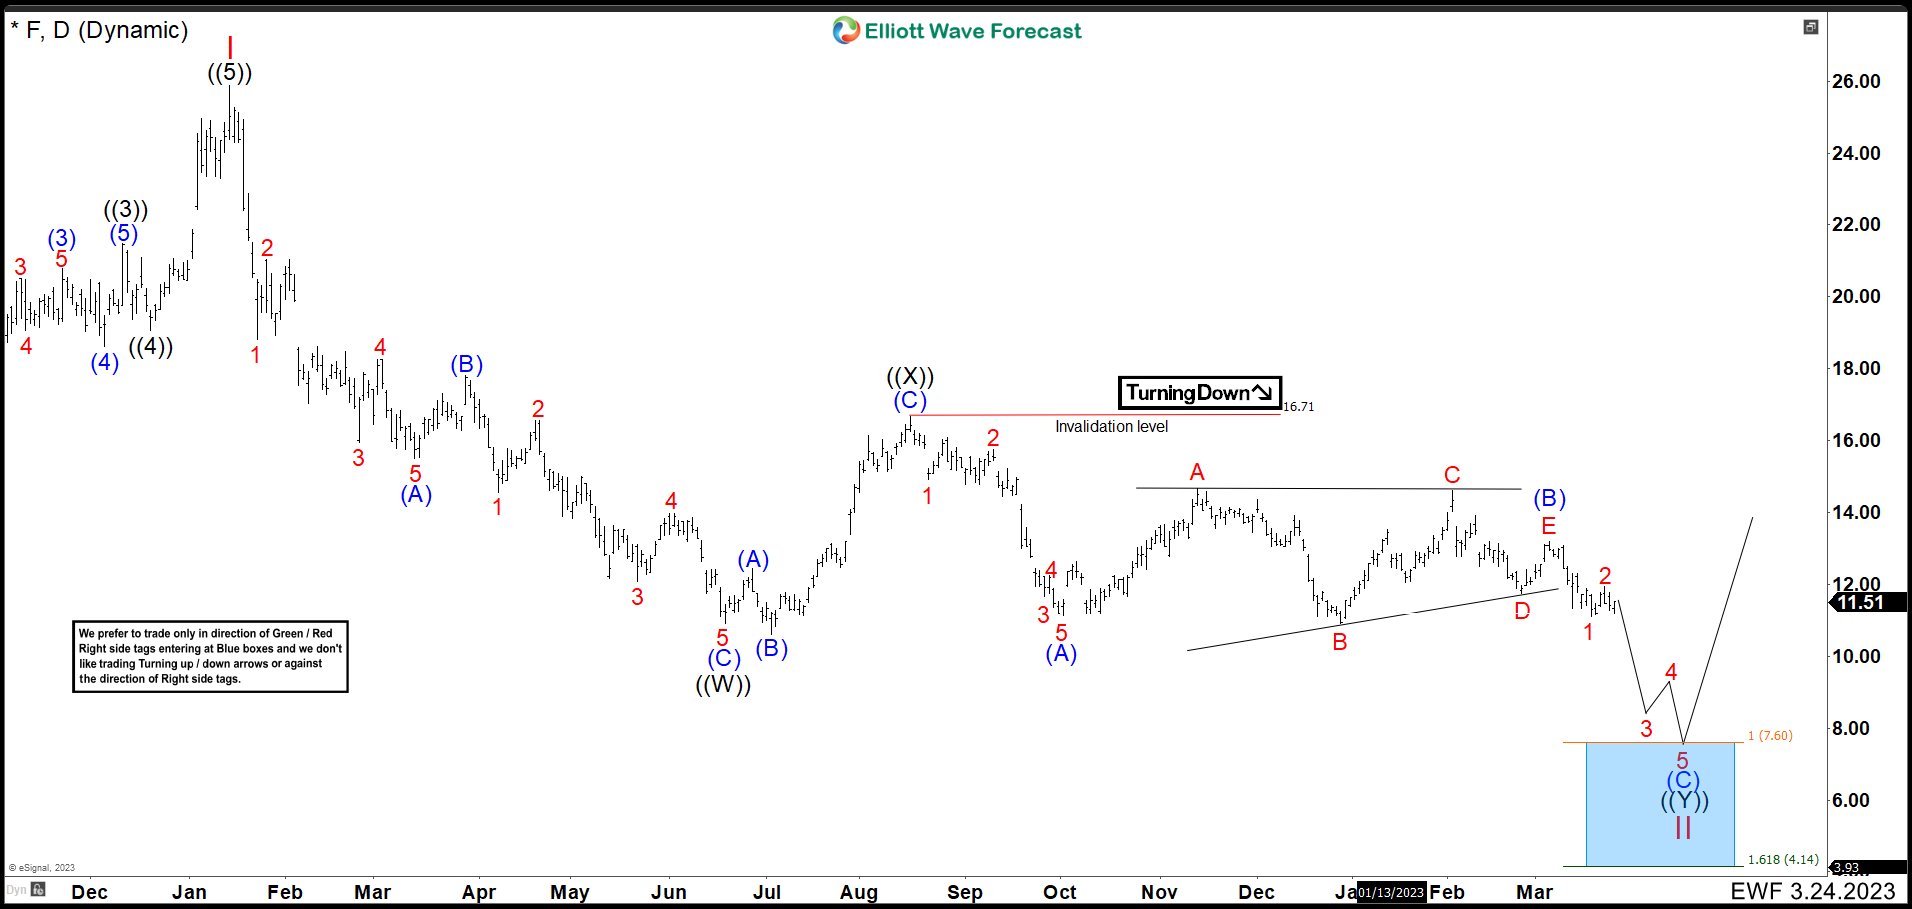
Last update in March, we can saw that Ford (F) price remained sideways creating a triangular structure. For this reason, we adjusted the Elliott count and the wave (B) we called as a triangle that ended at the price of $13.20. From this value, we expected that shares should keep the downward movement. However, to confirm the continuation of the downtrend it had to break $10.57 low.
FORD (F) Daily Chart August 2023
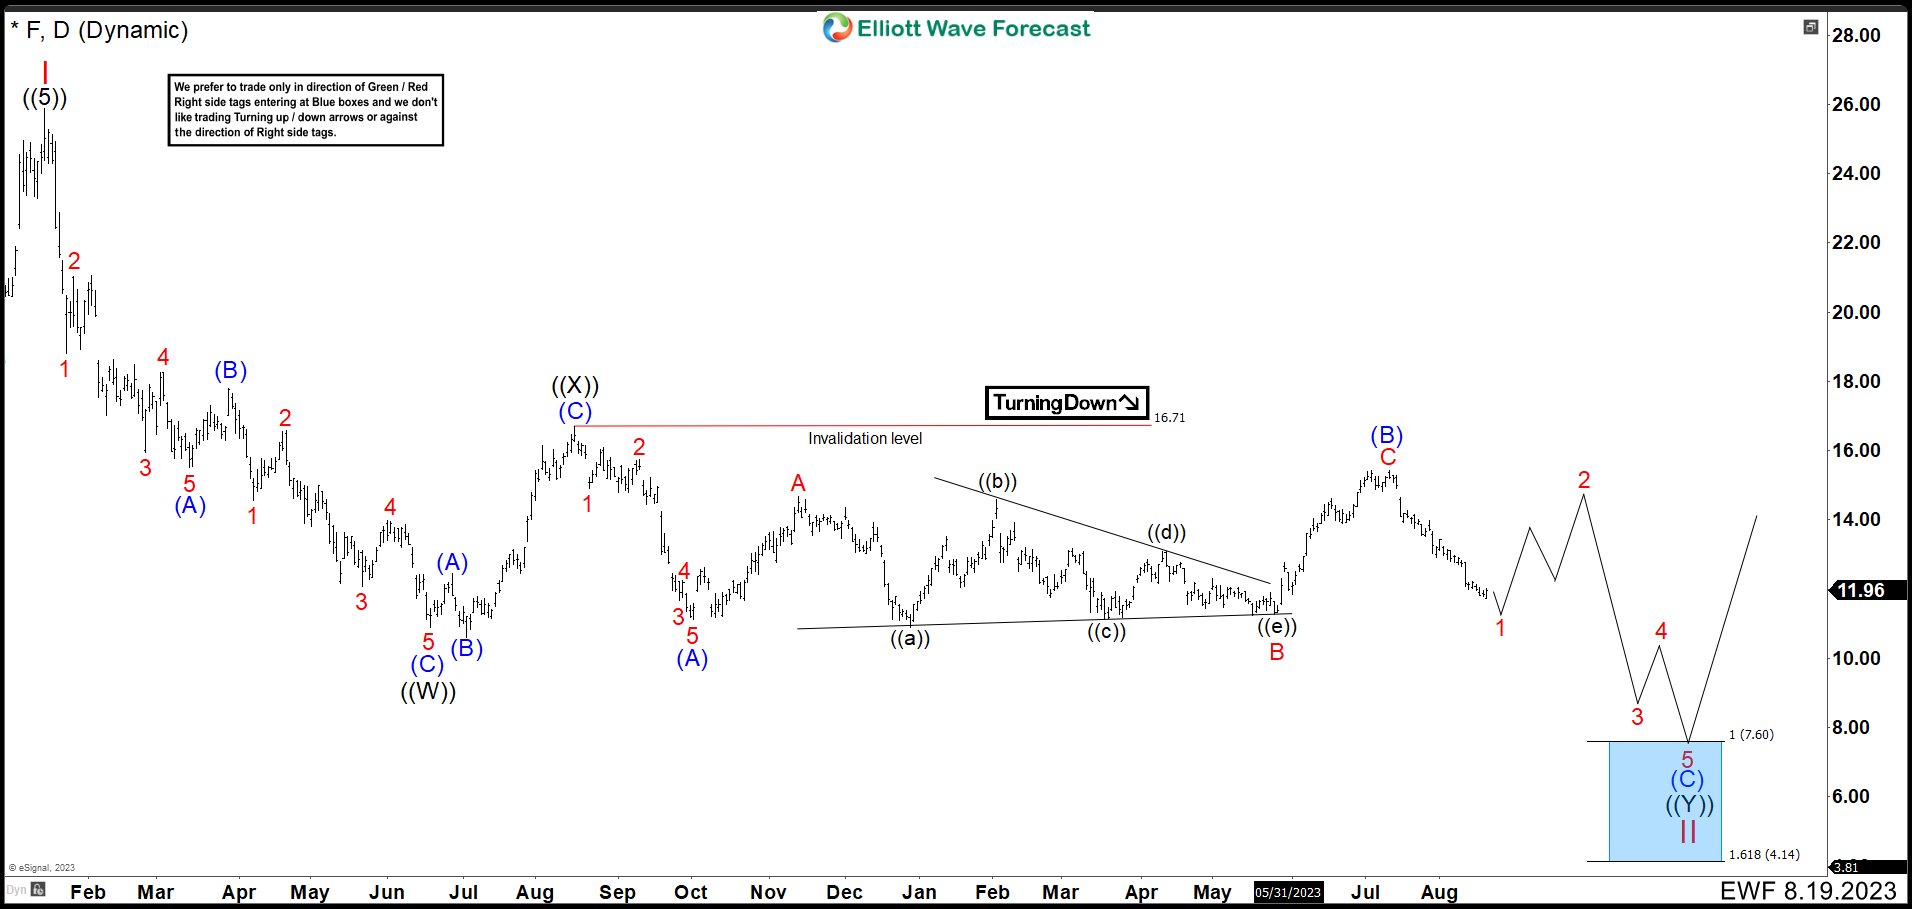
After 5 month, the price action could not break the pivot level of $10.57. Rather the stock rally, but without breaking the invalidation level making a more complex structure as wave (B). The end of wave A was at $14.67 in November 2022. Then, we have a triangle structure as wave B that completed at $11.27 and rally. The rally was a clear impulse that ends at $15.43 as wave C of (B) finished the wave (B) correction. From July high, the price action has dropped returning of wave B levels. This bearish movement should be the beginning of a wave (C), but we still need to break $10.57 low to confirm the path. The wave 1 of (C) should end next week, if it has not already ended. Therefore, a bounce is coming, but should fail in the next months to send the Ford shares to the blue box of 7.60 - 4.14 area.