UnitedHealth Group Incorporated (UNH) is an American multinational managed healthcare and insurance company based in Minnesota. It offers health care products and insurance services. This company is a component of the Dow Jones Index with a weight of more than 10% of the total index. In this blog we are going to analyze the UNH stock to try to estimate the future movements of YM (Dow Jones future) using the Elliott Wave theory.
UNH Weekly Chart Alternative A
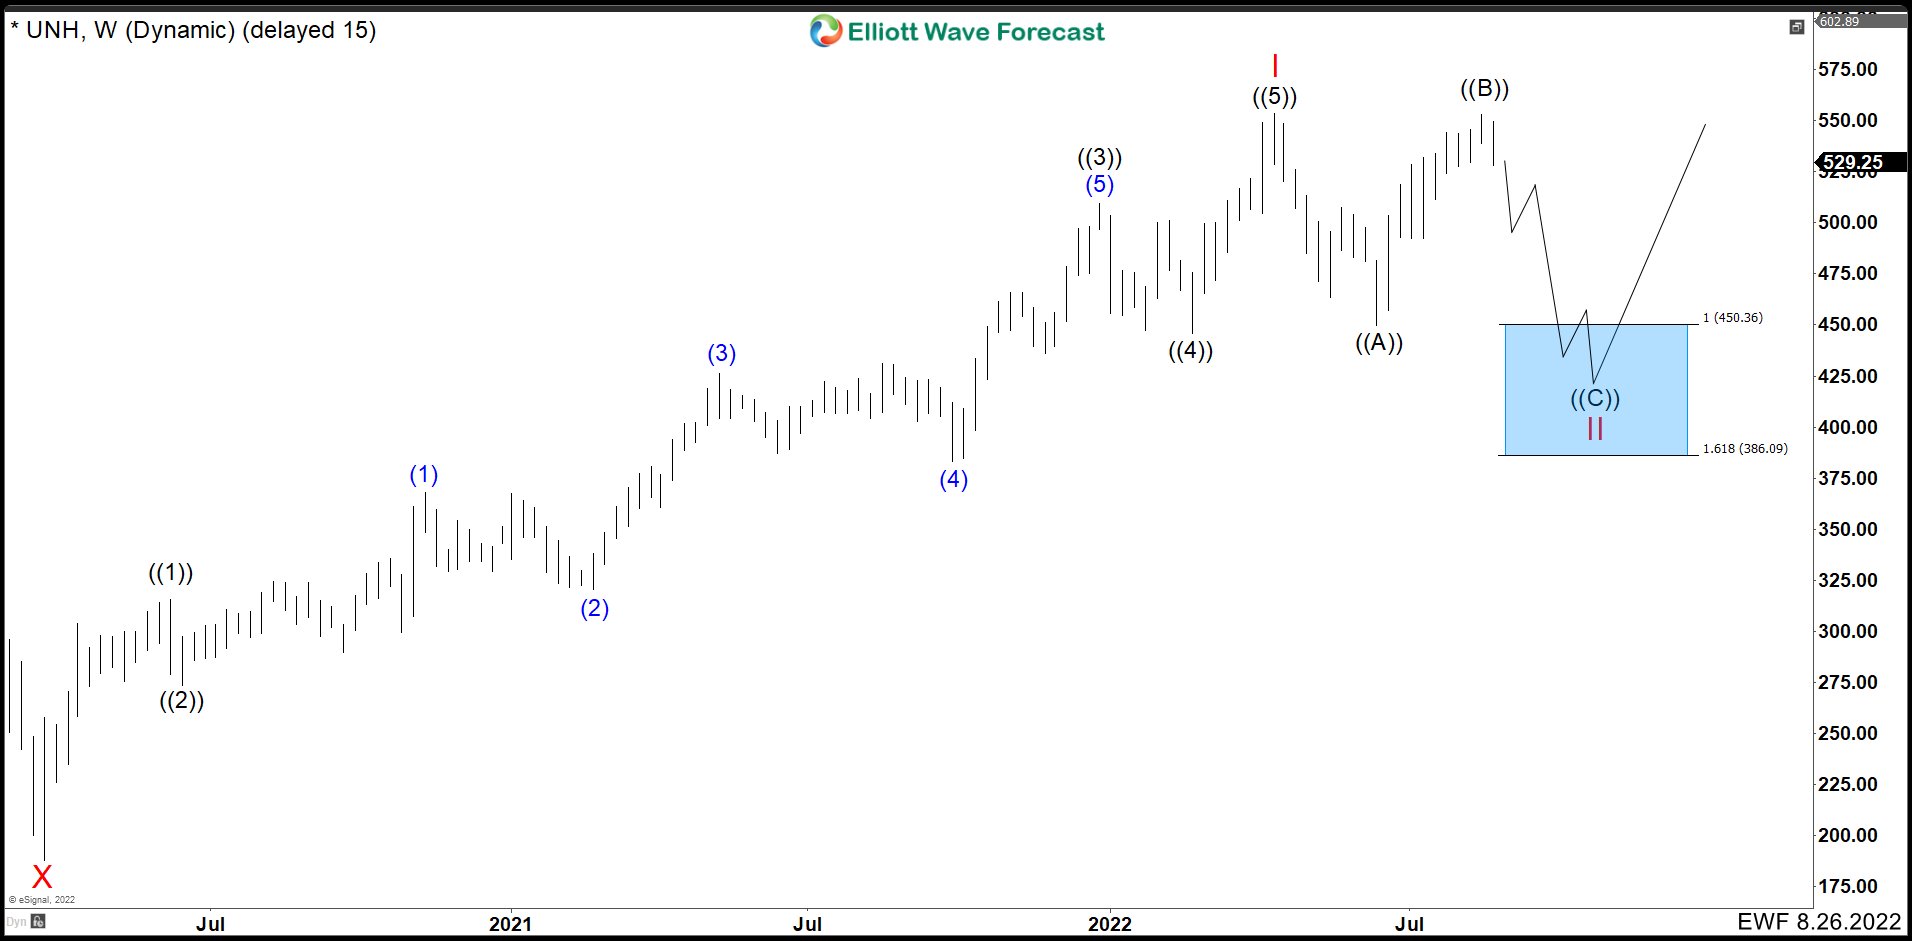
In the chart above, UNH shows that an impulse has been completed as wave I from point X which is the low of March 2020. This means that we should be building a corrective wave II. It can be seen that waves ((A)) and ((B)) could form a flat correction structure. Therefore, to complete this structure we should see 5 waves down from current levels towards the blue box and then continue to the upside.
UNH Weekly Chart Alternative B
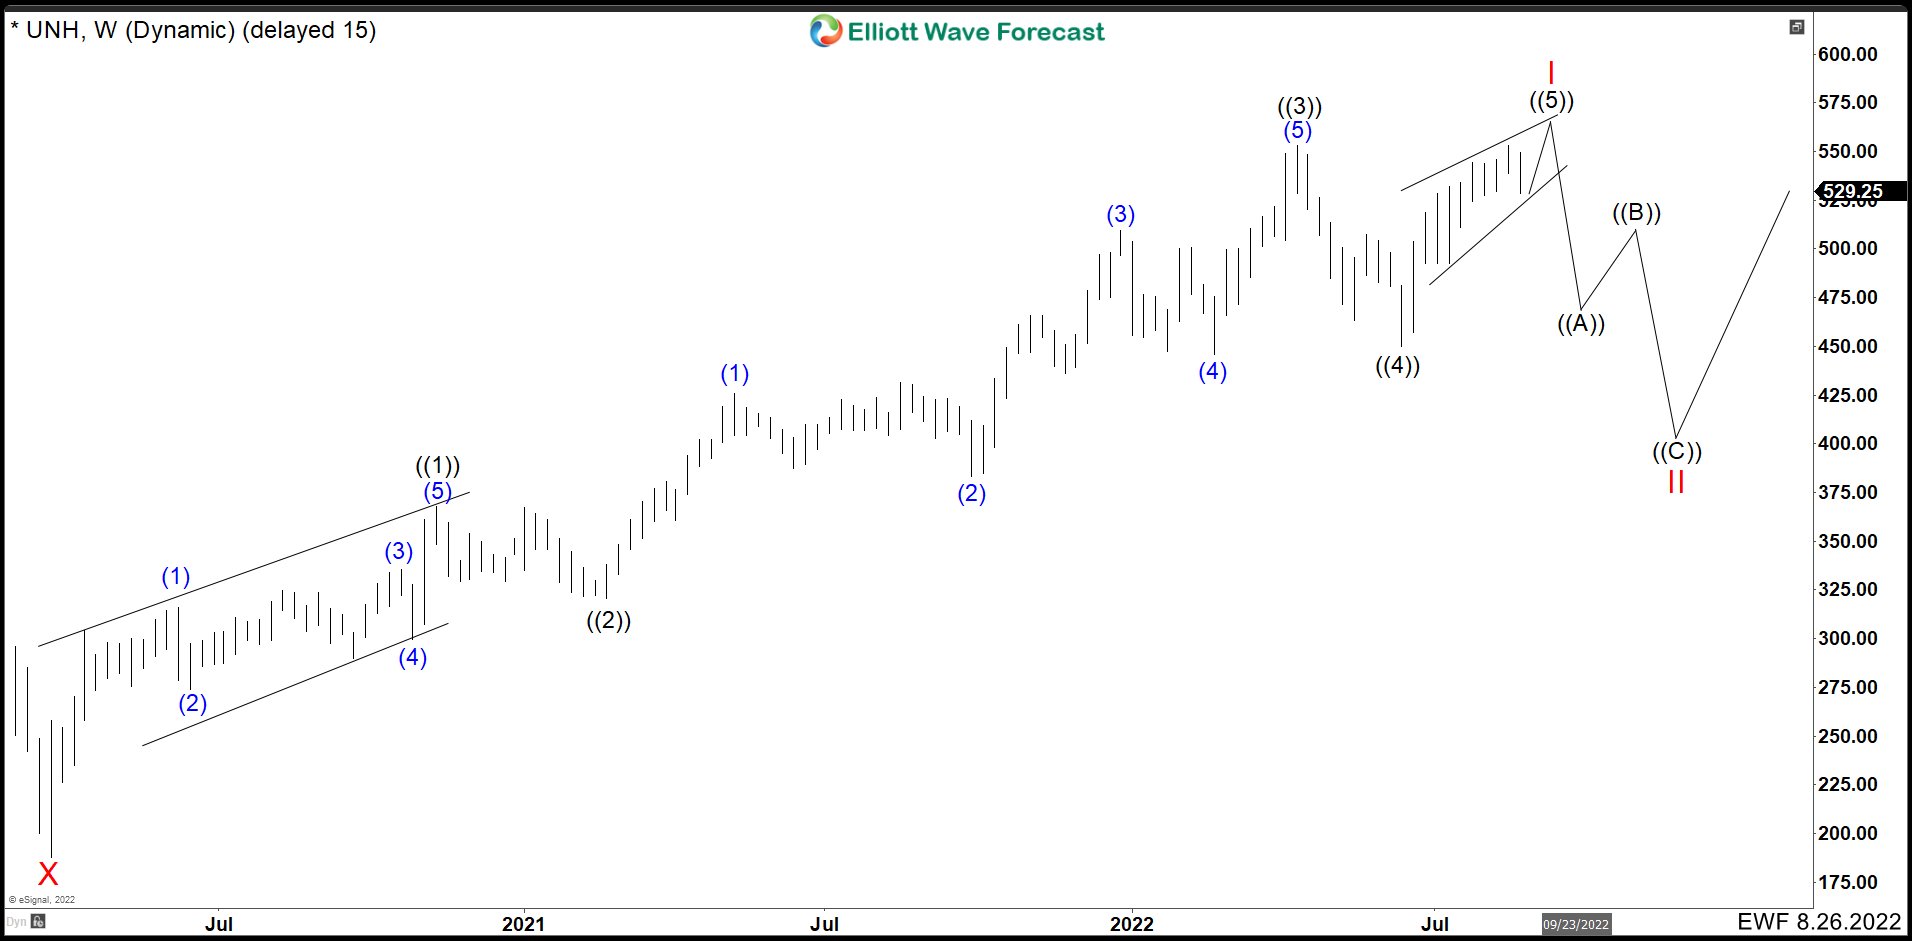
In this second alternative, we show that the impulse from the March 2020 lows is not over yet. Therefore, we need one more high to finish wave ((5)) in the form of an ending diagonal. This would complete the impulse and we would wait for at least 3 waves lower before continuing the rally.
YM_F Daily Chart Alternative A and B
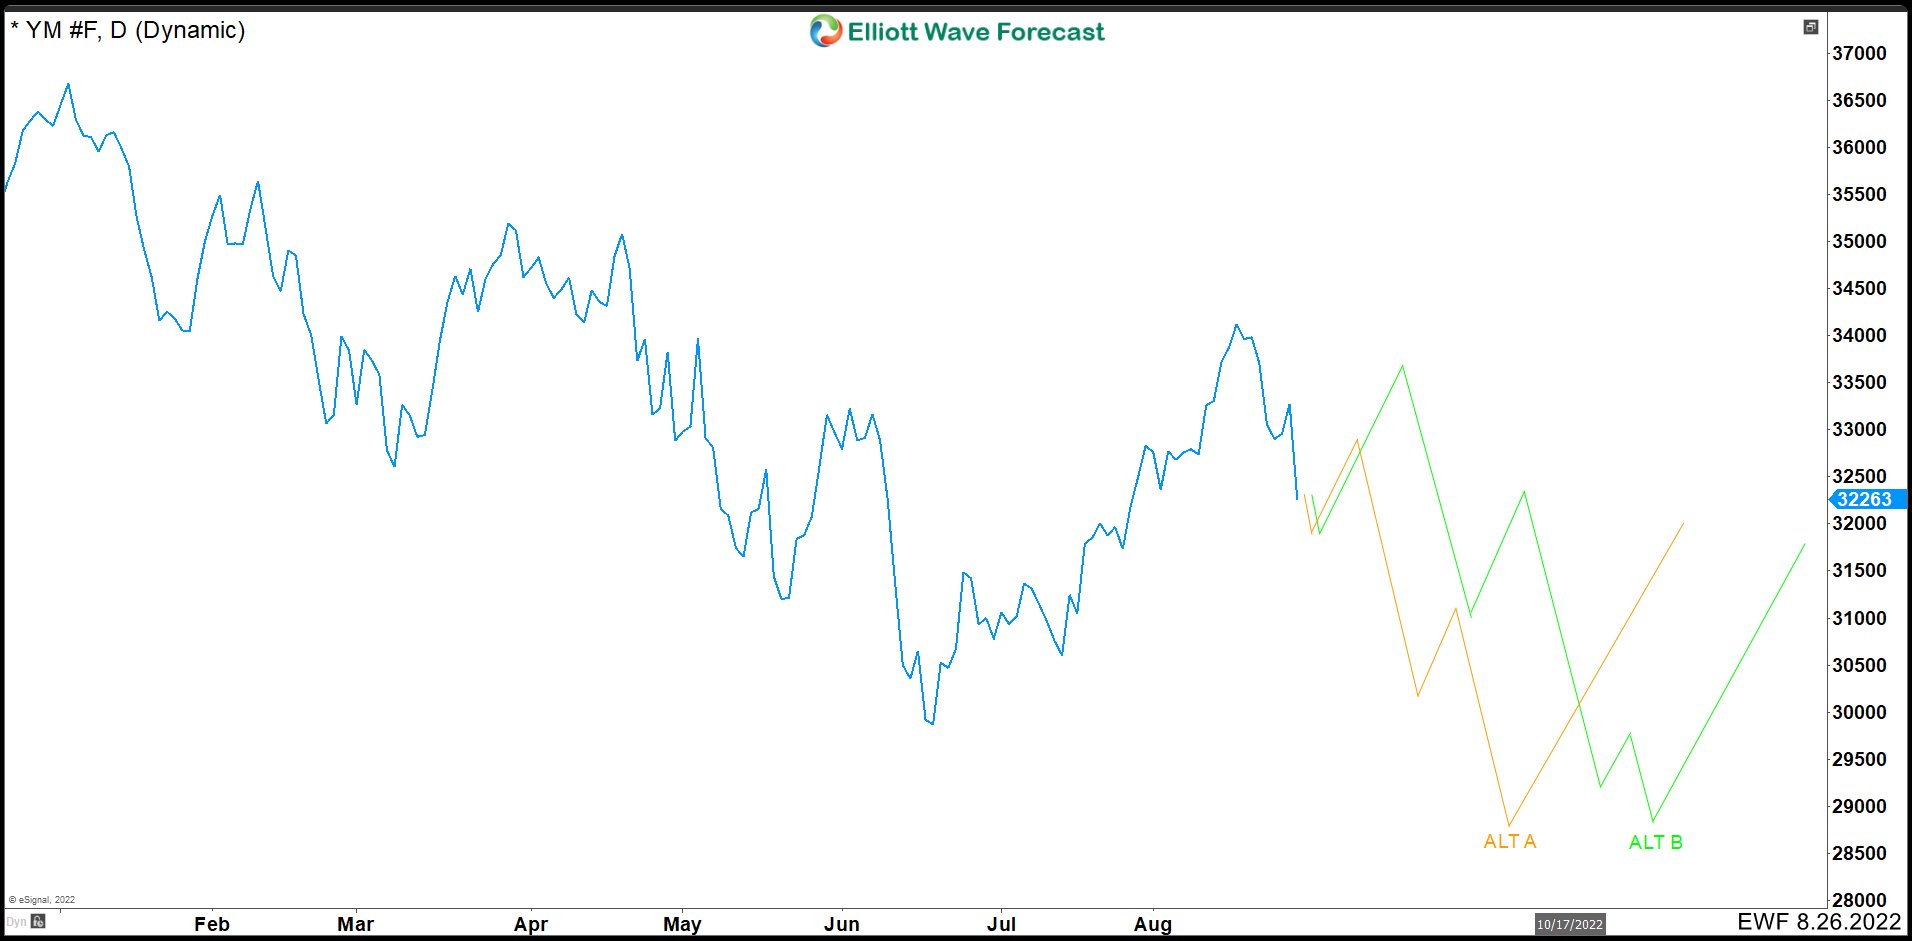
Here we have the YM chart where we show the two previously discussed alternatives of UNH stock. Alternative A (orange) would occur, if UNH is in a flat correction and YM would continue to move lower. Alternative B (green) is almost the same. The difference is in the strength of the rebound. If UNH breaks the high to complete its wave ((5)), this could make a stronger bounce in YM. This could result in a flat structure for the index, so the fall of the green alternative would be in 5 waves.
UNH Weekly Chart Alternative C
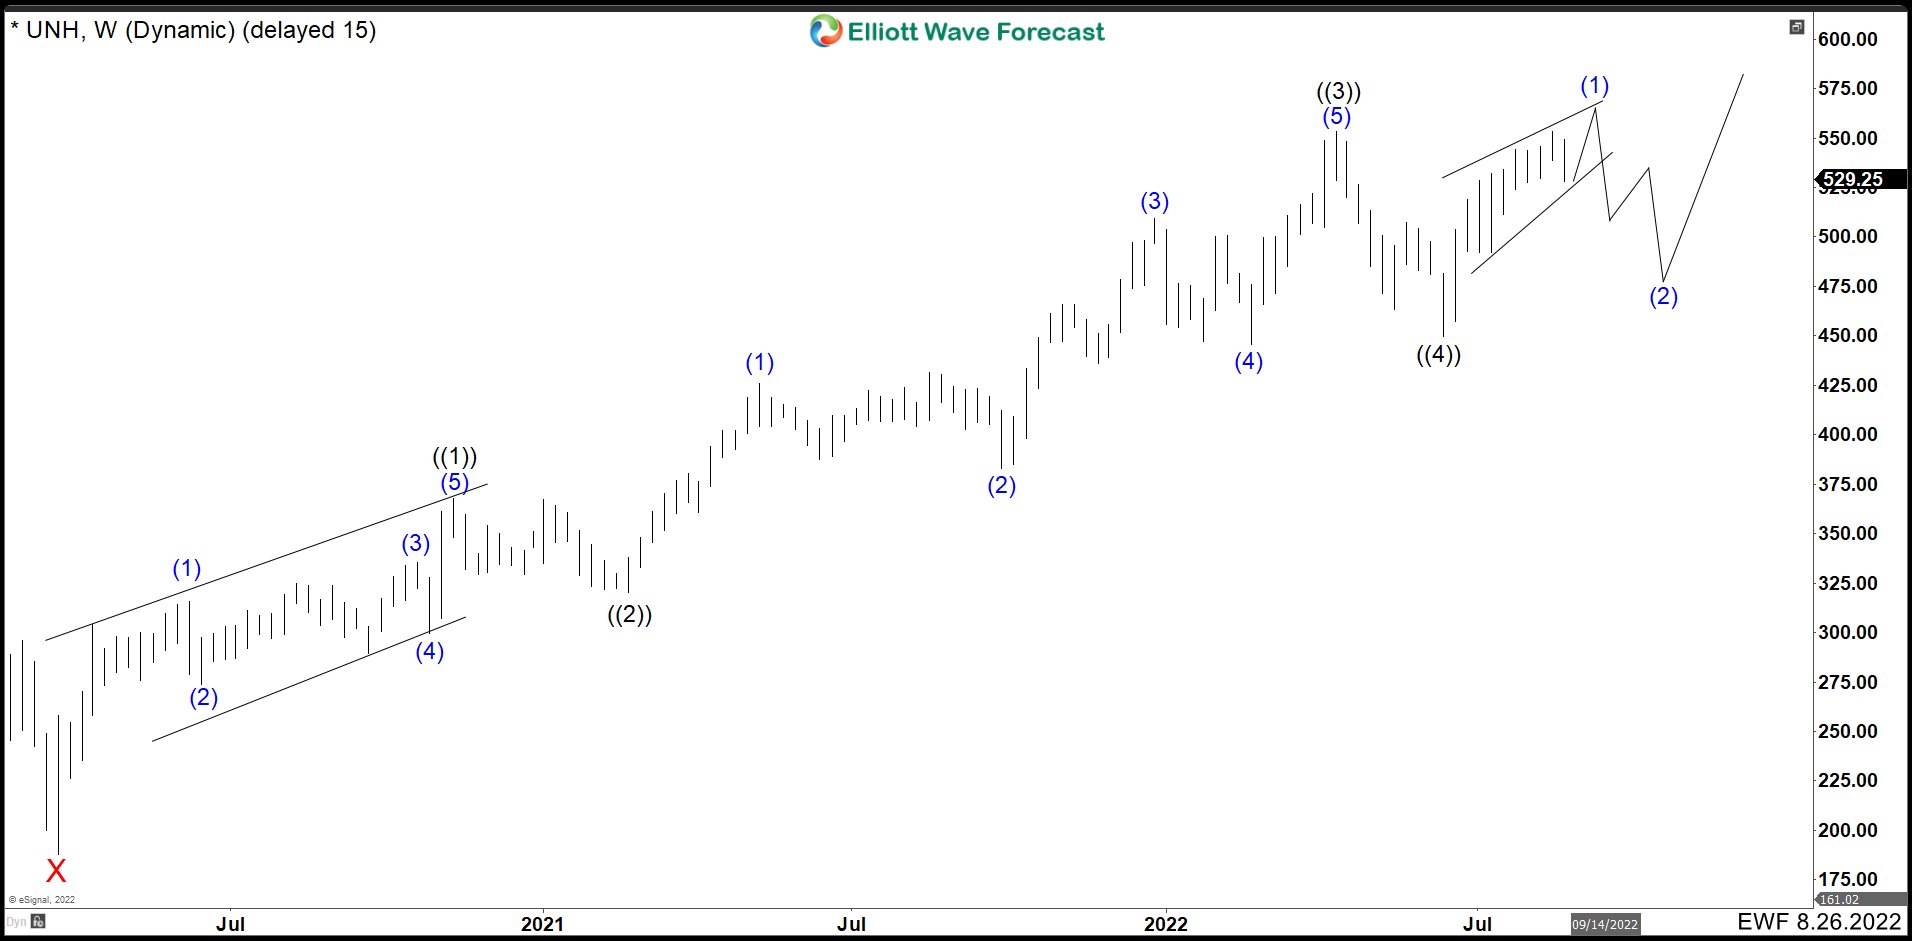
For last part of the analysis, we look for an extension to complete wave ((5)). So we need 5 waves higher in lesser degree at UNH before we see any correction. (If you want to learn more about Elliott Wave Theory, please follow these links: Elliott Wave Education and Elliott Wave Theory).
YM_F Daily Chart Alternative C and D
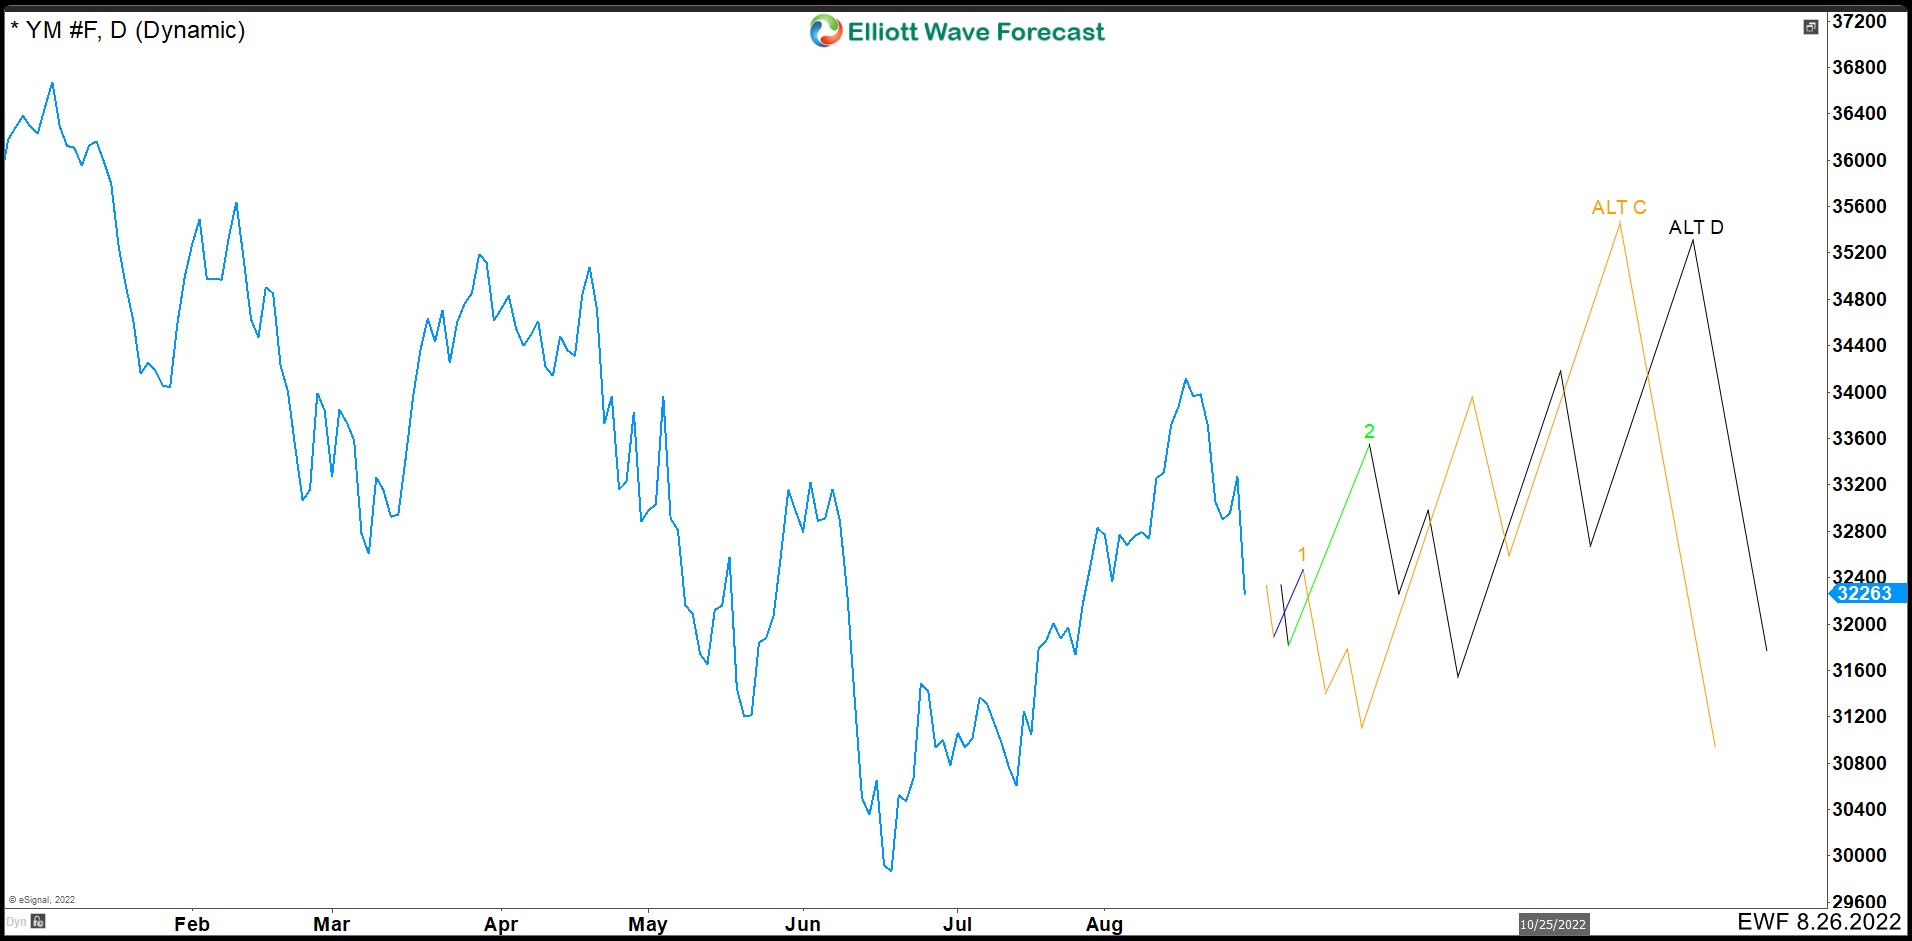
Let’s see how the UNH wave extension ((5)) affects YM. Here we propose 2 more alternatives. Everything will depend again on YM’s bullish bounce as UNH breaks higher and completes wave (1) in this case. If YM reaction is weak by the time UNH makes new highs, then we will have alternative C. YM will rise smoothly, would fall in 3 waves, and then we would see 3 waves higher before the correction. This move would reflect the 5 waves extension that could occur at UNH. Alternative D, indicates a stronger YM reaction when UNH makes wave (1). Then we would have the same structure of the previous alternative. 3 waves down and then 3 waves up before seeing a correction.
In conclusion, we can say that next week’s rebound will be very important in determining the best alternative to take. If the rebound is weak at YM, then we should follow alternatives A and C. If the rebound is strong, then we should follow alternatives B and D.
Source: Forecasting Alternative Paths in Dow Jones Using UNH Stock