Really it looks quite interesting.
But what time frame the COT tells the trend? Daily, Weekly,H4, H1?
The big players trade long-term. I use the daily timeframe, although I’m sure it will add an edge for shorter timeframes as well.
Thank you Johnathon, this is the forum I have been looking for.
1 Like
Hi Kevin,
still around. Just unfortunately don’t have the time to personally be everywhere and felt this thread had run it’s course with a ton of information for those who wanted it.
Safe trading,
Johnathon
2 Likes
Hello! My name is Filobolso, you can call me Filo.
I want to say thanks to Johnathon, Dudest, Bhops, and many more, who colaborated with this topic.
I’ve read first 1000 post, and going.
Since I start reading this thread I’ve learnt a lot.
I’m going to post set-up to discuss, please fell free to give your feedback.
Thanks in advance!
Is this a BUEB? Thanks!

Please don’t look at MA! hahaha

I don’t think it is one. The preceding candle is not a bearish candle such that it is negating its movement. The preceding is a bullish candle. The last candle is only continuing or reinforcing its movement. Engulfing patterns deal with reversals.
Thank you. I have learnt a lot from this site.
The Guide link doesn’t work anymore…any new link? I’m looking into this
Hi Ray,
Couldn’t find John’s link anymore.
Do you have an alternative source for the 50 pages he mentioned?
Desmond
The fifty pages he mentioned are on the first fifty pages of this thread. I have gone through 1000 pages and find that the only pages you need are the links on the first five pages. Just go through the guides he posted and read them then you are ready to go.
Spotted a potential short on EURJPY price is in a clear down trend on the daily time frame on its way down it seemed like it had a little correction when it to the 69.04 support level which then it smashed through only to rise back up and test this level again which got rejected with a huge move down.
Price has now come back up to test this level which looks to be holding again now as resistance.

Looking on the 4 hour time frame it does seem that price is looking to make a bounce on this one again after having 6 attempts of breaking this zone and failing.
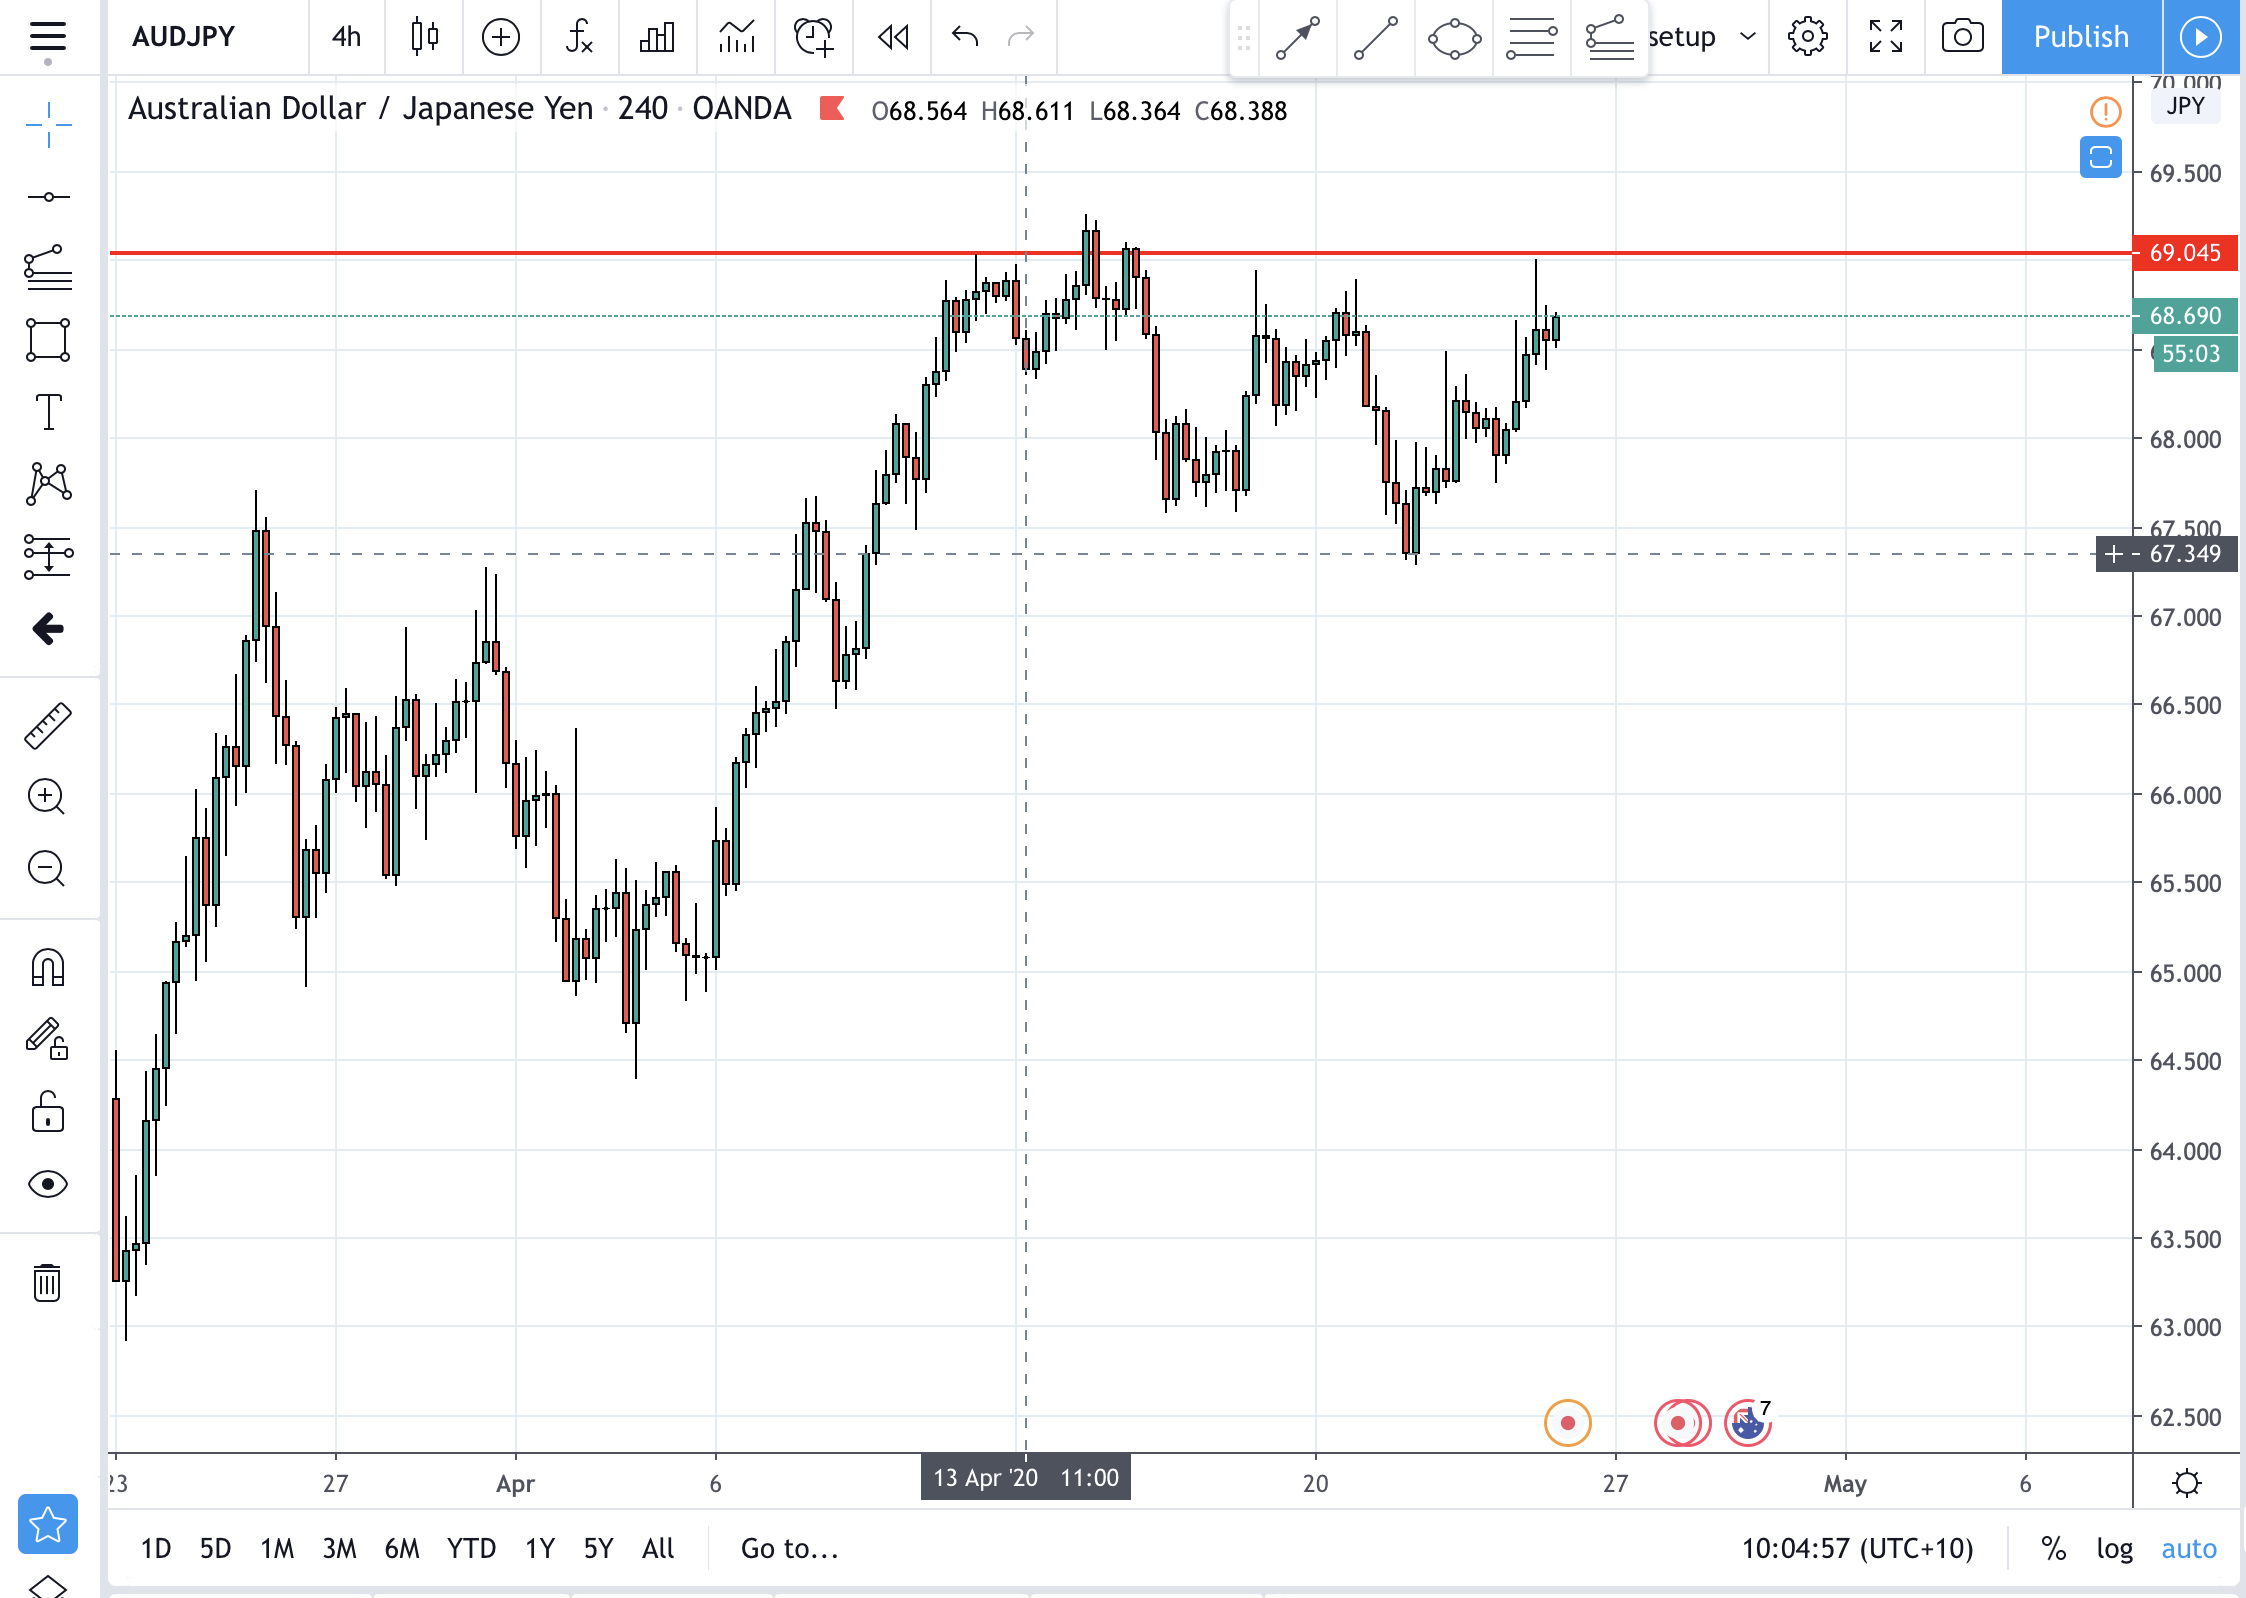
I was going to enter on the most recent pinball but after looking a little closer I felt that this candle was borderline a pinball as the wick did not seem 3x the size of the body, will be keeping a close eye on this one as price seems to be moving up again and will be entering if I see any clear signals on this resistance level.
What are peoples thoughts on this one?
Pinbar** autocorrect 
I think it is a good pin bar. But since I just saw your post price has gone below the entry point so I missed it. Thanks for bringing it up. Did nnot take it so as not to be chasing trades.
I did not enter this one I did not feel the signal was strong enough sign for me.
Hi, really appreciate your reply. However, I could not find any of the 50 pages. Mind to enlighten me?
Forget about the fifty pages. Concentrate on reading and understanding the guides - the links posted in the first five pages. That is enough for you to understand and start using the strategy. Speaking from experience because I have read the first 1000 pages.
Very interesting post
As a newbie, was interested to learn about trading and come across this thread. I tried clicking those first couple of link but seems they either have been archived or seems need permission to access those private link. Am i missing anything?