Level is OK but there is no PA signal what we waiting for. This thread is about Johnathon method and we do not trade stars, IB, hanging man etc. My proposition is to create another topic for different setups which are not related with his method and there we can discuss this potential trades. Method is method, rules are rules
I closed the position with a few pips because I wasn’t confident enough
There was a pull back on the 1H chart to the previous resistance on the daily chart. The resistance was at 66.75 on the daily. Price broke the resistance went to 67.09 and on the 1H chart pulled back to 66.80 and formed the BUEB.
It was not the greatest of pullbacks but I think price will go a bit higher before a major pullback. Not perfect setup I know so I will move the SL to BE if given the chance
Why you take a trade when you are not confident? You should know what to do before enter. Changing plan when you are in a trade it’s the worst what you can do.
Was watching…
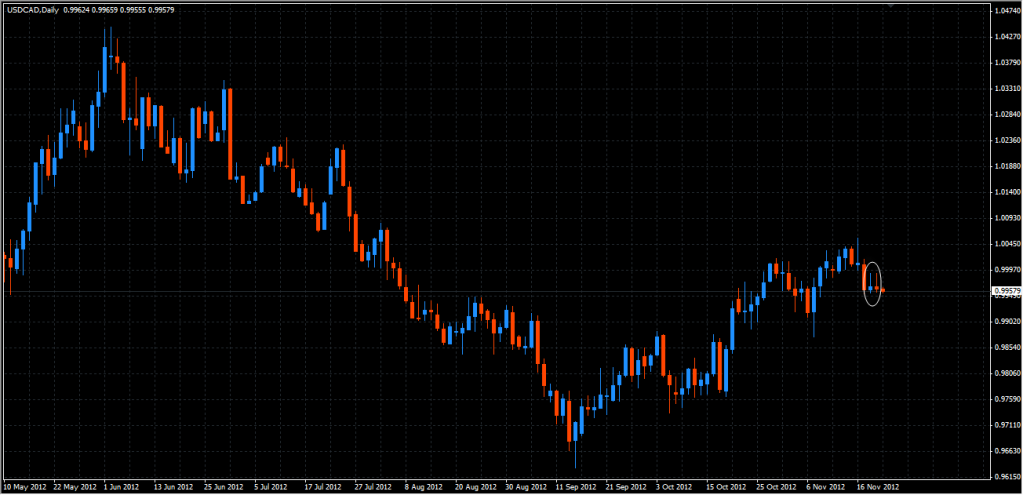
The last candle in ur pic ended up an invalid pin…if it was valid and formed at swing high, I woulda taken a position … so its a pass for me … atm anyway, until / if >> res level gets tested and valid pa forms…
Trend is still bearish IMO … cos no 1-2-3 bottom reversal patten completed as yet… thats why we was watching for pa to short at point 2 …
If price is able to close above point 2 and head higher…making (significant) higher highs and higher lows… then …yer… we would be looking at a trend change…
Thanks for your comments above.What if the two trades are not correlated ,is it advisable to take both with your full risk on each?Is int it the same as having the two trades on separate days or weeks?
We do not trade the hanging man as a PA signal (e.g, as we do a pinbar)
But we use it as a clue to tell us what price is looking to do (e.g, just as we use the IB to read the price story)
A hanging man (inverse pinbar) formed at an S/R zone (with the head/body right at the level) is usually telling us that price wants to go in the direction that the tail is pointing in.