Forex Technical Forecasts by Forex92

The US Dollar (USD) slid down against the Canadian Dollar (CAD) on Friday, for the third consecutive day, decreasing the price of USDCAD pair to less than 1.2800, ahead of the release of the US ISM Manufacturing PMI news. The technical bias remains bearish as the pair printed a lower high in the recent upside move.

Technical Analysis

As of this writing, the USDCAD pair hovers around 1.2733, with a few major support levels seen nearby. The price is likely to find some support near the given below levels:

Short-Term Support Levels

1.2686, a major horizontal support

1.2522, the lower trendline arm

1.2432, the low of October 08, 2017

On the upside, the pair might face some resistance near the levels as mentioned below;

Short-Term Resistance Levels

1.2860, a key resistance level

1.2967, the 38.2% Fib level resistance

1.3050, the high of November 10, 2020

The technical bias should remain bearish unless 1.2860, a major horizontal resistance level, is broken.

US ISM Manufacturing PMI news

The Institute for Supply Management (ISM) is scheduled to release stats for the US ISM Manufacturing PMI on Tuesday (January 05, 2021). According to the consensus of economists, the ISM Manufacturing PMI registered a reading of 56.5 points in December, as compared to a reading of 57.5 points in the month before.

The US Manufacturing PMI reflects the overall business conditions in the manufacturing sector. Being an important economic indicator, it also provides insights into the current financial health of the country. Generally speaking, a reading above 50 signals a bullish market trend for the USDCAD and vice versa.

Conclusion

Considering the overall technical outlook, selling the USDCAD pair around current levels might be a good move in short to medium term. Here is a trading plan for next week:

Sell Limit : 1.2769

Stop Loss: 1.2805

Take Profit: 1.2690

Euro (EUR) slid down against the U.S. Dollar (USD) last week, decreasing the price of the EURUSD pair to less than 1.2300 ahead of the release of the US Consumer Price Index (CPI) news. The technical bias remains bullish because the pair printed a higher high in the recent upside move.

Technical Analysis

As of this writing, the EURUSD pair hovers around 1.2221, with multiple support levels in sight. The pair is likely to find some support near the given below price levels:

Short-Term Support Levels

1.2171, a key horizontal support

1.2062, the 38.2% Fibonacci retracement

1.1885, the low of November 26, 2020

The support levels are demonstrated in the given below daily chart.

On the upside, the EURUSD pair is likely to face some resistance near the price levels mentioned below:

Short-Term Resistance Levels

1.2348 – a major horizontal resistance

1.2400 – the psychological number

1.2515 – the 38.2% fib level resistance

The technical bias should remain bullish as long as 1.2171, a major horizontal support, remains intact.

U.S. Consumer Price Index

The US Department of Labor is scheduled to release the stats for the Consumer Price Index (CPI) excluding food and energy on Wednesday (January 13, 2021). According to the average projections of economists, the consumer price index registered a reading of 0.1 percent in December, as compared to a reading of 0.2 percent in the month before.

The US Consumer Price Index Ex Food & Energy is an estimate of change in the retail prices of different products and services selected from different sizes of stores countrywide through targeted sampling. It is pertinent to mention here that the stats for the U.S. Consumer Price Index doesn’t include the prices of volatile products such as food and energy in a bid to remain unbiased.

Generally speaking, a higher reading of CPI is considered good for the U.S. economy and vice versa. A better than expected reading of CPI means bearish trend for the EURUSD pair and vice versa.

Conclusion

Considering the macroeconomic outlook of the pair, here is a short to medium term trading plan for the EURUSD:

Sell EURUSD if the price gives a daily closing below the 1.2150 handle, with a 50 pips stop loss and a target of at least 150 pips.

The U.S. Dollar (USD) rose against the Japanese Yen (JPY) last week, increasing the price of the USDJPY pair to more than 103.00, ahead of the release of Japan’s interest rate decision.

Technical Analysis

As of this writing, the USDJPY pair consolidates around 103.84. The price is likely to face hurdle near the given below price levels:

Short-Term Resistance Levels

104.25 – A major horizontal resistance

104.75 – The high of December 02, 2020

105.27 – The Fibonacci retracement (61.8%)

On the downside, the pair is likely to find some support near the given below price zone:

Short-Term Support Levels

103.46 – The low of December 29, 2020

102.58 – A major horizontal support

102.00 – The psychological level

Bank of Japan (BOJ) Interest Rate Decision

The bank of Japan (BOJ) is scheduled to decide the new interest rate for the country on Thursday (January 21, 2021). As per the average estimate of economists, Japan’s interest rate should remain unchanged at -0.1% in December, as compared to the reading of -0.1% in the month before.

The Bank of Japan’s (BOJ) interest rate decision reflects the economic conditions of the country. A hawkish approach by the BOJ towards the inflationary outlook of the country’s economy indicates economic growth. On the other hand, if BOJ remains dovish and cuts interest rates, then it signals a weakened economy. Generally speaking, a higher than expected reading suggests a bearish market for the USDJPY pair and vice versa.

Conclusion

Considering the macroeconomic and technical outlook of the pair, here is a short to medium term trading plan for USDJPY:

Sell on a breakout below 103.50 with a stop placed around 104.50 and target around 102.00

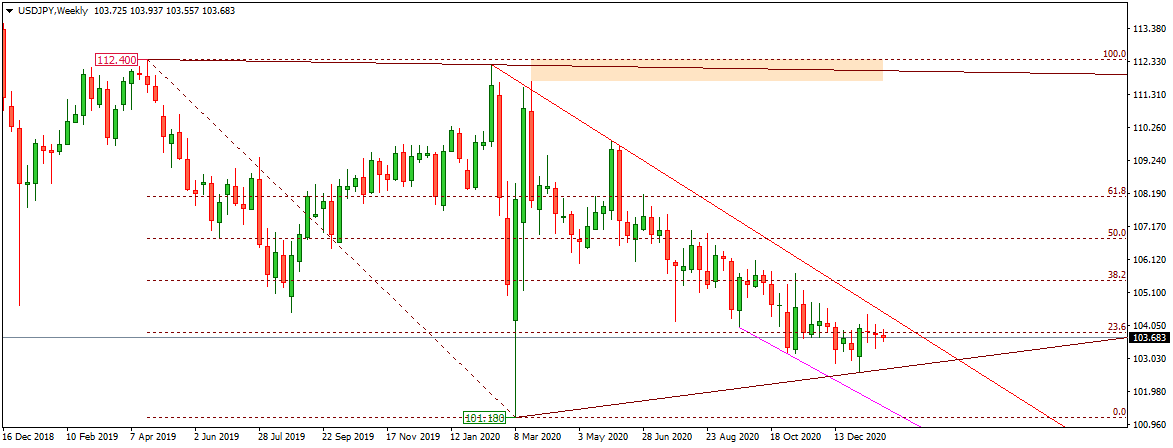
The U.S. Dollar (USD) slid down against the Japanese Yen (JPY) last week, decreasing the price of the USDJPY pair to less than 104.00, ahead of the release of the U.S. ISM Manufacturing PMI news.

Technical Analysis

As of this writing, the USDJPY pair hovers around 103.68, with some major support levels seen ahead. The price of the pair might find some consolidation near the given below price levels;

Short-Term Support Levels

102.65 - the lower trendline arm

101.15 - the major horizontal support

100.00 - the psychological number

;

On the upside, the price of the pair might face some resistance near the given below price levels;

Short-term Resistance Levels

104.39 - the high of January 10, 2021

105.45 - the Fibonacci retracement (38.2%)

106.76 - the key horizontal resistance

U.S. ISM Manufacturing PMI

The U.S. Institute for Supply Management (ISM) is scheduled to release numbers for the manufacturing sector on Monday (February 01, 2021). According to the economist’s consensus, the ISM Manufacturing registered a reading of 60.0 in January, as compared to the reading of 60.7, in the month before.

The ISM Manufacturing PMI indicates the overall business conditions of the manufacturing sector in the United States. It is considered a major indicator for the U.S. economy. Generally speaking, a reading above 50 signals a bullish trend for the USDJPY pair and vice versa.

Conclusion

Given the macro-economic outlook of the pair, here is the short-term trading plan for the USDJPY pair:

Buy USDJPY @ 103.70

Stop Loss @ 103.00

Take Profit @ 105.00

The Australian Dollar (AUD) inched higher against the U.S. Dollar (USD) last week, increasing the price of the AUDUSD pair to more than 0.7700, ahead of the release of Australian Employment Change news.

Technical Analysis

As of this writing, the AUDUSD pair consolidates around 0.7715. While moving upside, the price might face some resistance near the listed below price zones:

Short-Term Resistance Levels

0.7817 – the major horizontal resistance

0.7929 – the upper trendline arm

0.8100 – the psychological number

On the downside, the AUDUSD pair might find some support near the given below price levels.

Short-Term Support Levels

0.7563 – the low of January 31, 2021

0.7300 – the psychological level

0.7268 – the Fibonacci retracement (23.6%)

Australia Employment Change News

The Australian Bureau of Statistics is scheduled to release numbers for the employment change on Thursday (February 18, 2021). According to economists’ view, the economy added 50K new jobs in January 2020, as compared to exactly similar numbers in the month before.

The stats for the employment change reflects the change in the number of people having jobs in Australia. The employment change news is a significant indicator of consumer spending. Increased consumer spending patterns stimulate economic growth. Generally speaking, a high reading is seen as positive for the AUDUSD pair, and vice versa.

Conclusion

Given the macro-economic outlook of the pair, here is a short-term trading plan for AUDUSD:

Buy Stop @ 0.7750

Stop Loss @ 0.7650

Take Profit @ 0.7950

The U.S. Dollar (USD) inched higher against the Japanese Yen (JPY) last week, increasing the price of the USDJPY pair to more than 105.00, ahead of the release of the U.S. Retail Sales news. The technical bias remains bearish because the pair printed a lower low in the recent downside move.

Technical Analysis

As of this writing, the USDJPY pair strengthens around 105.55. The price of the pair might find some resistance near the given below price levels.

Short-Term Resistance

106.76 – the major horizontal resistance

107.54 – the high of July 19, 2020

108.09 – the Fibonacci retracement (61.8%)

On the downside, the USDJPY pair is likely to sustain near the listed price tags.

Short-Term Support

103.85 – the confluence of a major horizontal support level and a trendline support

102.76 – the lower trendline arm

102.00 – the psychological number

U.S. Retail Sales News

The U.S. Census Bureau anticipates releasing Retail Sales data on Wednesday (February 17, 2021). According to economists’ view, the U.S Retail Sales news registered a reading of 0.7% in January 2021, as compared to the reading of -0.7%, in the month before.

The U.S. Retail Sales figure reflects net sales made by the retail sector of the United States. The net receipts of sales are presented in percentage. Changes in the percentage of such sales show the performance of retails stores over the given time.

The U.S. Retail Sales data is considered an important economic indicator of consumer spending because it estimates whether or not people are willing to spend more money in the coming days. Generally speaking, a higher reading suggests a bullish market for USDJPY, and vice versa.

Conclusion

Given the macro-economic outlook of the pair, here is the short-term trading plan for USDJPY:

Buy USDJPY @ 105.50

Stop Loss @ 104.50

Take Profit @ 107.00

Euro (EUR) inched higher against the U.S. Dollar (USD) this week, increasing the price of the EURUSD pair to more than 1.2100, after the release of the U.S. Michigan Consumer Sentiment Index.

Technical Analysis

As of this writing, the EURUSD pair consolidates around 1.2175. While moving upside, the pair might find some resistance near the given below price levels.

Short-Term Resistance

1.2257 – the high of December 20, 2020

1.2300 – the psychological level

1.2348 – the major horizontal resistance

EURUSD Weekly Chart – Source MetaTrader4

On the downside, the pair might find some support near the given below price levels.

Short-Term Support

1.2035 – the lower trendline arm

1.1944 – the 23.6% Fib level support

1.1900 – the psychological number

U.S. Michigan Consumer Sentiment Index News

The University of Michigan released numbers for the Consumer Sentiment Index on Friday (February 12, 2021). Economists anticipated an increase in the Consumer Sentiment Index data for February 2021 by 1.8, as compared to the reading of 79, in the month before. However, the actual data remained 76.2, way lower than the economist’s expectation.

The Michigan Consumer Sentiment Index data reflect consumer confidence in the economic activity of the country. The data also indicates consumer spending patterns in the coming days. Generally speaking, a lower reading weakens the U.S. Dollar and suggests a bullish trend for the EURUSD pair and vice versa.

Conclusion

Given the macro-economic outlook of the pair over the past few days, here is a short-term trading plan for EURUSD. Try buying the EURUSD pair around 1.2000 or alternatively look for selling opportunities near the 1.2400 handle.

The Great Britain Pound (GBP) inched higher against the U.S. Dollar (USD) last week, increasing the price of the GBPUSD pair to more than 1.3900 ahead of the release of U.S. ISM Manufacturing PMI news.

Technical Analysis

As of this writing, the GBPUSD pair strengthens around 1.3954 with a few resistance levels in sight. The pair might face some hurdle near the given below price levels.

Short-Term Resistance

1.4029 – the upper trendline arm

1.4100 – the psychological number

1.4237 – the major horizontal resistance

GBPUSD Weekly Chart/ Source: MetaTrader4

On the downside, the GBPUSD might find some support near the listed price levels.

Short-Term Support

1.3766 – the low of March 04, 2018

1.3700 – the psychological level

1.3597 – the lower trendline arm

U.S. ISM Services PMI News

The Institute for Supply Management (ISM) is scheduled to release ISM Services PMI news today (March 03, 2021). Economists anticipate the reading for ISM Services PMI might remain the same in February, as it was 58.7, the month before.

Stats for ISM Services PMI reflects business conditions of the non-manufacturing sector within the United States over the given time. It is worth mentioning here that Services PMI doesn’t affect the U.S. Gross Domestic Product rate significantly, as compared to the Manufacturing PMI. Generally speaking, reading below 50 weakens the U.S. Dollar against the British Pound and suggests a bullish market for the GBPUSD pair and vice versa.

Conclusion

Considering the price movement of the precious metal over the past few days, it may be a better option in the short term if the pair was bought at around 1.3600. Due to the volatile nature of the market however, prices may change and lead to different outcomes.

The U.S. Dollar (USD) skyrocketed against the Japanese Yen (JPY) the last week, increasing the price of the USDJPY pair to more than 109.00 ahead of the release of U.S. Consumer Price Index news.

Technical Analysis

As of this writing, the USDJPY pair strengthens around 109.10. The pair might face some resistance near the listed below price levels:

Short-Term Resistance

109.53 – the major horizontal resistance

110.95 – the high of May 05, 2019

112.00 – the psychological level

USDJPY Weekly Chart – Source MetaTrader4

On the downside, the pair might find some sustainability near the listed below support levels:

Short-Term Support

107.92 – the key horizontal support

107.00 – the psychological number

106.32 – the 38.2% fib level support

U.S. Consumer Price Index News

The U.S. Department of Labor Statistics is all set to release numbers for the consumer price index tomorrow (March 10, 2021). According to economists, the consumer price index might improve and register a reading of 0.2% in February, as compared to a reading of 0.0% in the month before.

The Consumer Price Index (CPI) estimates the change in the prices of retail products. It compares the prices of different products, including goods and services after selecting them from a representative shopping basket on a sampling basis. It is worth mentioning here that the index doesn’t include prices of volatile items, such as food and energy to avoid a biased reading. Generally speaking, a high reading strengthens the U.S. Dollar and suggests a bullish trend for the USD/JPY and vice versa.

Conclusion

Considering the price movement of the precious metal over the past few days, it may be a better option in the short term if the pair was bought at around 108.00. Due to the volatile nature of the market, however, prices may change and lead to different outcomes.

The Australian Dollar (AUD) rose against the U.S. Dollar (USD) last week, increasing the price of the AUDUSD pair to more than 0.7700 ahead of the release of Australia’s employment news.

Technical Analysis

As of this writing, the AUDUSD pair consolidates around 0.7766. While moving upside, the pair might face some hurdles near the listed price levels;

Short-Term Resistance

0.8002 – the upper trendline arm

0.8100- the psychological level

0.8135 – the major horizontal resistance

AUDUSD Weekly Chart – Source MetaTrader4

On the downside, the pair might find some support near the given below price levels;

Short-Term Support

0.7621- the low of March 07, 2021

0.7500 – the psychological number

0.7412 – the Fibonacci retracement (23.6%)

Australian Unemployment News

The Australian Bureau of Statistics anticipates releasing unemployment data on Thursday (March 18, 2020). Economists expect some improvement in the figures. According to them, the Australian unemployment news might register a reading of 6.3% in February, as compared to a reading of 6.4%, the month before.

The unemployment stats reflect the number of people having no jobs over the given period. Increasing figures indicate a lack of expansion within the labor market of Australia. Generally speaking, rising unemployment numbers weaken the Aussie dollar and suggests a bearish trend for the AUD/USD pair and vice versa.

Conclusion

Considering the price movement of the pair over the past few days, it may be a better option in the short term if the pair was bought at around 0.7700. Due to the volatile nature of the market, however, prices may change and lead to different outcomes.

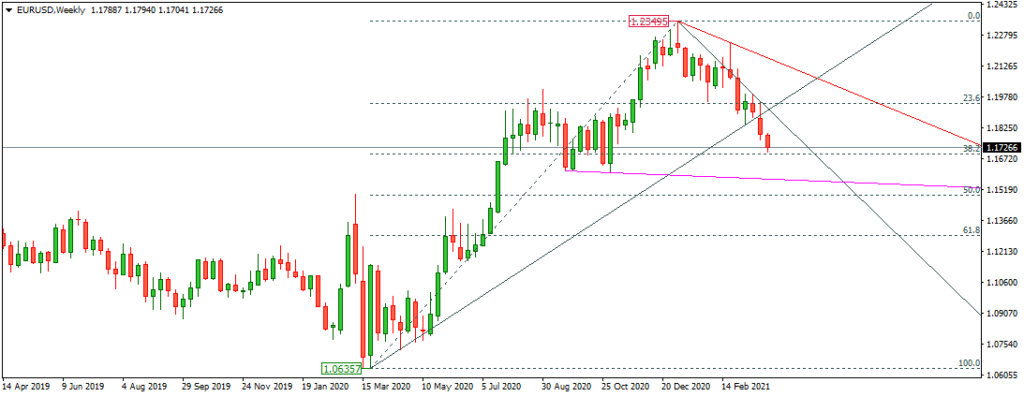
Continuing a bearish momentum, the Euro (EUR) slid down against the U.S. Dollar (USD) last week, decreasing the price of the EURUSD pair to less than 1.1800, ahead of the release of U.S. Nonfarm Payroll news.

Technical Analysis

As of this writing, the EURUSD pair hovers around 1.1726, with multiple support levels in sight. If the price keeps falling, the EURUSD pair might find some support near the given below price levels.

Short-Term Support

1.1567 – the lower trendline arm

1.1488 – the major horizontal support

1.1300 – the psychological number

On the upside, the pair might face some hurdles near the listed price levels.

Short-Term Resistance

1.1909 – the confluence of trendlines

1.2011 – the high of August 30, 2021

1.2100 – the psychological level

U.S. Nonfarm Payroll News

The US Bureau of Labor Statistics is scheduled to release numbers for the Nonfarm payroll news on April 02, 2021. According to economist estimates, the Nonfarm payroll data might register a reading of 639K in March, as compared to the reading of 379K, in the month before.

The Nonfarm payroll data reflects the number of non-agricultural job vacancies created in the United States the last month. The payroll data changes every month and carries high volatility exposure due to direct relation with the Central Banks’ economic policy decisions. It is worth mentioning here that the payroll data is subject to multiple subsequent reviews that may create additional volatility in the forex market. Generally speaking, a high reading indicates a strengthening U.S. economy and suggests a bearish trend for the EURUSD pair and vice versa.

Conclusion

Keeping in view the price behaviour of the EURUSD pair over the past few days, selling the pair around 1.1909 might yield some short to medium-term profits.

Thanks for sharing the info bud. Was planning on investing in USDCAD and your strategy can definitely help.

How to trade NZDUSD Ahead of RBNZ Interest Rate Decision News

The New Zealand Dollar (NZD) inched higher against the U.S. Dollar (USD) on Tuesday (February 22, 2022), increasing the price of the NZDUSD pair to more than 0.6700 ahead of the release of the Reserve Bank of New Zealand (RBNZ) Interest Rate Decision News.

Technical Analysis

As of this writing, the NZDUSD consolidates around 0.6706. Should the price continue rising, the pair might face some hurdles near the given price levels:

Short-Term Resistance

0.6732 – the high of February 10, 2022

0.6790 – the 38.2% Fibonacci retracement

0.6873 – the major horizontal resistance

On the downside, the NZDUSD pair might find some support near the given price levels:

Short-Term Support

0.6624 – the lower trendline arm

0.6592 – the low of February 14, 2022

0.6527- the major horizontal support

RBNZ Interest Rate Decision News

The Reserve Bank of New Zealand (RBNZ) is set to release numbers for the interest rate decision on Wednesday (February 23, 2022). According to economists, the Interest rate decision news registered a reading of 1% in January compared to the reading of 0.75% in the month before.

An interest rate is the fee creditors charge for lending money. To maintain economic stability and liquidity, central banks adjust short-term interest rates. Not to mention, increased long-term loan demand leads to higher interest rates and vice versa.

Generally speaking, an increase in interest rates by the RBNZ indicates a hawkish view for inflation which strengthens the New Zealand Dollar, suggesting a bullish outlook for the NZDUSD.

Conclusion

Considering the NZDUSD price movement over the past few days, it may be a better option in the short term if the pair was bought at around 0.6624. Due to the volatile nature of the market, however, prices may change and lead to different outcomes.

USD/CAD Price Analysis: For bears to be convinced, a clean break of 1.2765 is required.

  • USD/CAD sellers hit early January resistance.
  • Failure to cross 78.6% Fibonacci retracement and low RSI favour bears.
  • USD/CAD is trading near an intraday low of 1.2771, battling resistance-turned-support.

The Loonie pair hit a two-month high the day before but couldn’t break the 78.6% Fibonacci retracement of December-decline. January’s

It faces resistance from the prior resistance line and the 61.8 percent Fibo level near 1.2770-65.

USD/CAD is anticipated to fall further given the quote’s failure to break the major Fibonacci retracement level and the downward sloping RSI line.

Before the bears to target the 50% Fibo level near 1.2700, they must first clear 1.2765. The 200-SMA, at 1.2660, will then be a tough sell for USD/CAD sellers.

Determination from the recent swing high around 1.2880 is required to lead USD/CAD bulls towards the December 2021 high above 1.2965.

The 1.2900 round figure may act as a stop, while the 1.3000 psychological magnet may entice purchasers past 1.2965.

Ukrainian Government Adviser: Today will be the most difficult day of the year
President Zelenskiy told President Poroshenko that Kyiv had stopped Russian soldiers from most directions, thus today will be the hardest.

Russian tanks will break into Kyiv, says the ambassador.

A Deputy Ukrainian Defense Minister said Russian troops may reach Kiev today.

Reaction of the market

The S&P 500 Futures swung around 0.50 percent, while the US Dollar Index gave up the previous day’s gains.

GBP/USD recovers from daily low, but remains in the negative below the 1.3400 level amid Ukraine crisis

This pair was last seen trading near 1.3375 during the early European session, down around 0.20 percent for the day.

The pair opened with a negative gap on Monday, boosted by the weekend events surrounding the Ukraine situation. Following Russia’s invasion of Ukraine, Western governments implemented fresh sanctions, including banning some institutions from the SWIFT global payments system

On Sunday, President Vladimir Putin increased nuclear alert levels, raising worries of a new escalation in the East-West war. This generated a new wave of global risk aversion, forcing investors into traditional safe-haven assets, benefiting the buck.

Optimism over the Ukraine-Russia talks, which are expected to begin Monday near the Belarusian-Ukrainian border, helped stabilise the financial markets. This, together with dwindling likelihood of a 50 bps Fed rate hike in March, curbed USD gains and bolstered GBP/USD.

Now it appears that the Fed’s forceful policy response to persistently high inflation has been dashed. Aside from that, the worldwide flight to safety lowered US Treasury bond yields, temporarily hurting the dollar.

Aside from the Russia-Ukraine saga, there are no major economic releases expected from the UK or US. A combination of these factors will affect the USD price and create short-term trading opportunities around the GBP/USD pair.

EUR/USD: Failure to maintain 1.1150 opens the door to more losses toward 1.1100.

It began the week with a huge bearish gap. Meanwhile, the euro may hit new 20-month lows, according to FXStreet’s Eren Sengezer.

In a risk-averse market, the USD will outperform

“Russian and Ukrainian border delegates are set to meet for negotiations. It’s hard to tell if both parties will be willing to terminate the fight diplomatically. In that situation, EUR/USD might rally sharply. Conversely, stagnation and worsening of the crisis may increase selling pressure on the euro.”

EUR/USD faces psychological resistance around 1.1200, then 1.1260 (previous support, static level) and 1.1300 (psychological level).

On the downside, 1.1150 appears to be short-term support. If a four-hour candle closes below that level, EUR/USD may slip toward 1.1100, a new 20-month low.”

Gold Price Forecast: XAU/USD maintains a comfortable level near $1,900, with an eye on Ukraine

Going into Tuesday’s European session, gold (XAU/USD) is down $190. The previous day, gold closed around $1,910, the highest monthly gain since May 2021.

While the Russia-Ukraine situation supports gold’s safe-haven demand, the recent dollar rally appears to have tested the XAU/USD bulls.

Nevertheless, the US Dollar Index (DXY) rose 0.13 percent intraday to 96.84. The US Treasury yields rose two basis points (bps) to 1.856 percent, helping the greenback measure. Anxiety over Russia’s next action, which has already bombarded civilian structures, also helps the greenback bulls.

Meanwhile, strong US inflation forecasts face off against recent Fedspeak softening. The 10-year breakeven inflation rate (FRED) rose to 2.62 percent by the close of Monday’s North American session, the highest since November 23. The CME’s FedWatch Tool now predicts a 0.50 percent Fed rate hike in March, down from above 50% a few days ago. “Today I am in favour of a 25 bps move at the March meeting,” Atlanta Fed President Raphael Bostic said on Monday.

In the midst of these moves, equity futures are flat, while Asia-Pacific markets are mixed.

Given the market’s apathy, every new headline will be scrutinised for new ideas. Geopolitical and inflation-related news will be more vital. The US ISM Manufacturing PMI for February and US President Joe Biden’s State Of The Union speech will also be key.

Analyses

The week started well, but gold prices are still hovering around June 2021 top.

However, the bullish RSI divergence is shown by recent rising gold prices and higher RSI line bottoms. The MACD line’s bearish bias is also fading.

In any case, the metal is currently nearing the 23.6 percent Fibonacci retracement of late January-gains. February’s On a strong breakout, gold investors can push prices above February’s high around $1,975.

The 61.8 percent Fibonacci Expansion (FE) of the indicated rise, around $1,997, as well as the $2,000 mark will be difficult for the XAU/USD bulls to overcome.

Pullbacks are unlikely until the 100-SMA and an upward sloping trend line from January 28 are broken.

If gold breaks $1,869, it’ll likely head for a mid-February swing bottom near $1,845 before emphasising the $1,800 level for the bears.

Asian markets are bullish in response to Russia-Ukraine peace negotiations.

After last week’s turbulence, the fragile Asian markets have turned positive this week. The intensification of the Russia-Ukraine conflict led market investors to sell risky assets and invest in safe-haven assets. Asian stocks take the hit and plummet.

The ceasefire talks between Russia and Ukraine on Monday re-energized the market. Despite the lack of a result, the market appreciated the idea of a truce.

Also, China’s positive Caixin Manufacturing PMI boosted Asian markets. The Caixin Manufacturing PMI rose to 50.4 from 49.1 previously and market expectations of 49.3. With industries shuttered for the Lunar New Year, Jinping’s economy has outperformed.

The recent spike in Asian markets is unpleasant buying, not a turnaround. The world is now aware of Russian President Vladimir Putin’s caprice, and he is not going to give up lightly despite Western sanctions. Russia’s exclusion from the SWIFT international banking system has hampered its oil and energy exports.

If a favourable development regarding a Russian-Ukrainian truce flares, the Asian markets will move north like crazy. Until then, sellers are likely to return to the terminals soon.

USD/CHF ignores the SNB’s Zurbruegg, being moderately bid near 0.9200 as Ukraine-related anxieties recede

The USD/CHF is moderately bid around 0.9200 heading into Wednesday’s European session.

In doing so, the Swiss franc (CHF) pair pays heed to remarks made by SNB Vice Chairman Fritz Zurbruegg. “It is vital to keep lower interest rates than others to avoid excessive appreciation of the Swiss franc,” said the policymaker. “SNB will hike interest rates as soon as the situation requires,” he added.

Rising US Treasury yields and modestly bid stock futures may be linked to the risk barometer pair’s recent rise.

With US President Joe Biden mentioning “self-reliance” and the power to battle inflation during his first State of the Union speech, global markets consolidated recent losses. In his SOTU, Biden announced a restriction on Russian flights from US airspace.

Aside from Biden’s SOTU, the ongoing Ukraine-Russia peace talks provide traders hope for a resolution. Despite Monday’s failure, discussions between Kiev and Moscow are still on the table.

The USD/CHF will be influenced by news from Russia and Ukraine. The Fed Chair’s bi-annual testimony and the February ADP Employment Change will also be crucial.