Forex Trading for the 9 to 5er

This is a compilation of thin gs I have learned from many different full time traders. I traded this method for three months on demo and was profitable every month. LAter I saw this method being sold by someone for $197 USD. I had posted up my results on another board and am pretty certain he got the method form me. SO I decided to give it away to anyone who will listen.

Just to let you know I am NOT a full time trader yet. But I know I am on the right path. I made this ridiculously easy. A complete noob can follow this once he has a basic understanding of a few things. No need to watch the news and I got rid of all the confusing oscillators. This will keep your eyes on the right side of the chart.

Just want to thank all those full timers I learned from. Now its a matter of building enough equity to quit my job.

Support and resistance is a better friend than the trend

Support and resistance are like walls and ceilings that capture bouncing price and send it scurrying in the opposite direction. They hold more often than not. Need proof? Take a look at any chart of any instrument and 60 to 80% of the time price is ranging between some kind of support or resistance. So only 20 to 30% of the time the market is trending strongly in one direction. So the odds are much better that we are going to capture a bounce more than a break out. The odds are in favor of bounces over breakouts so I conclude that the above statement in bold is true.

Many things can cause price to bounce off of support or resistance. A bank defending its option, Market believes more strongly that it will bounce than not, Some d****bag billionaire cashes out, Profit taking (often occurs on friday afternoons) The point is the barrier is more likely to hold than it is to fail.

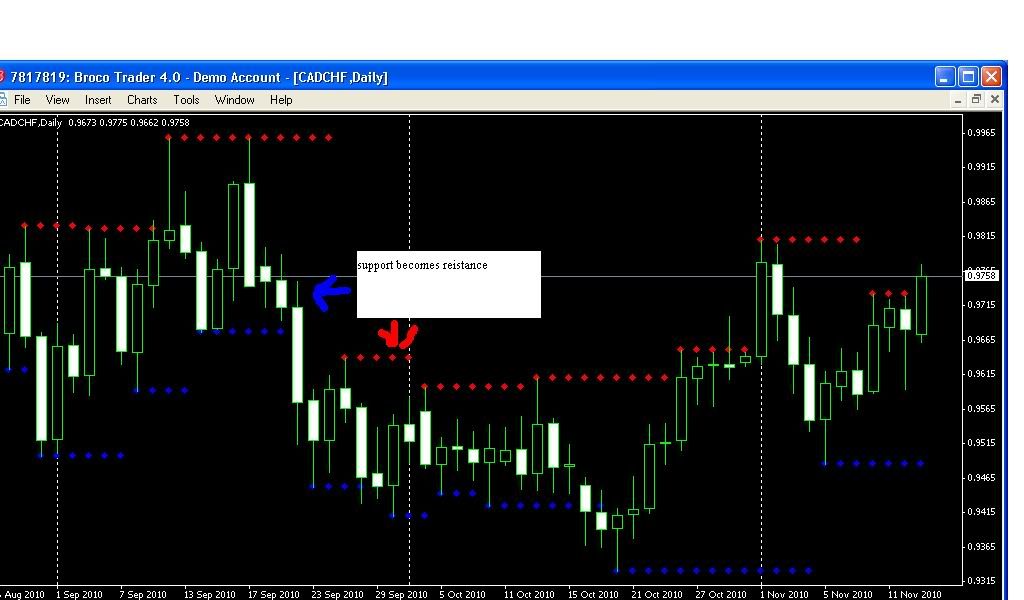
If it does fail and breaks through that’s great too. because if that area was an area of support it will now become a new resistance level if and when price reaches it again. And vice versa.

[/QUOTE]

The trend is your friend (sort of)

Because of the chaotic nature of the markets the direction always has degrees of uncertainty. Like weather prediction we go by what is statistically most likely going to happen given the current circumstances. Chaos is a special math used to do this and I will not go into a lengthy discussion about it. I want to point out the fundamental element of chaos. The Fractal. Think of the fractal as a decision A decision to go to work today or not, to start a business or not, to call a loved one or not. to buy or sell a currency. these are the building blocks of chaos. Used in conjunction we can determine trends in the near future.

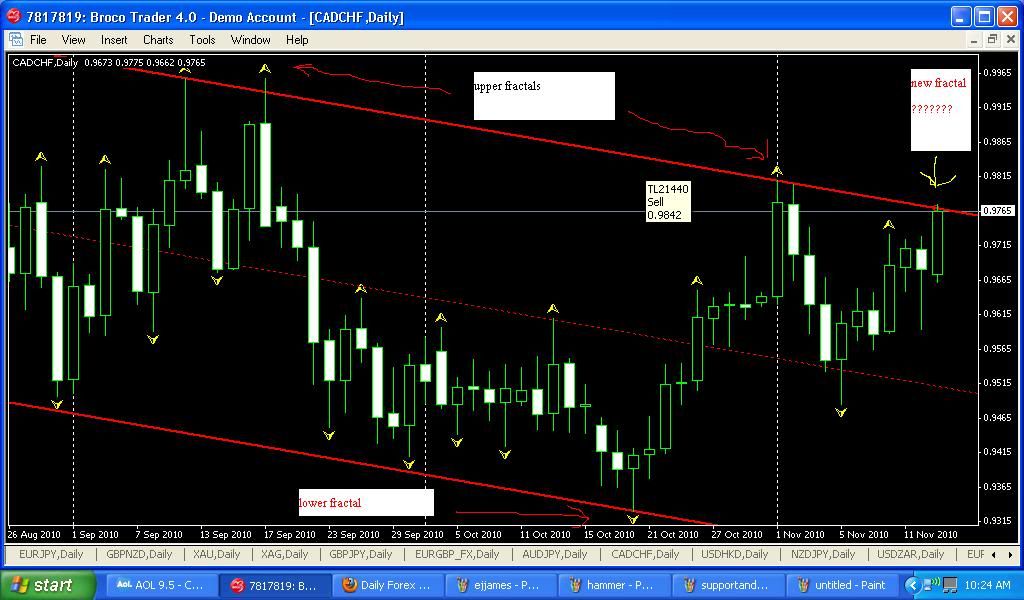
Even though the market is gyrating wildly we can see that the general concensus is down based on the placement of the major fractals. So we would look for opportunities in a down market to increase our odds although a goo counter trend opportunity may present itself but that is beyond the scope of this thread.

I will assume knowledge of basic trading principles. If you do not posses the basics I suggest you go to Forex Training Online: Learn Foreign Exchange (FX) Currency Trading And get a free education of the basics of trading currencies. (babypips school) Those concepts can be translated into trading any instrument but I stick to what I know and makes sense.

The whole premise of this method is based on the hammer candlestick. Also known as the hanging man or inverted it is know as the shooting star. The candlestick looks like this:

The color of body of the candle is of little concern. Only that it has a long tail a small or no body and a much shorter tail or (none at all) on the opposite side. The longer the tail and the more it protrudes the better

Why does this pattern occur and why is it so important?

First of all let me state this is on the daily Timeframe. Lower Timeframes will give you more fakeouts due to the chaotic nature of the market. This pattern goes by many names. Fakeout, Headfake, Shooting star, hammer, pinbar and hanging man are a few but on the daily Timeframe they are very significant. What has happened is that some news event has caused a dramatic shift in the market. The news is not really all that important. only the fact that the market was headed in one direction(the direction in which the long shadow or tail is pointed) and then turned tail and ran in the opposite direction. This signals a major shift in market sentiment (what most traders believe price should be doing)and which way traders will trade in the near future. Knowing this we can capitalize on it.

Attached is a zip file of indicators, expert advisors (EAs or robots) and a template. Unzip and extract the files before attemting to install them in your metatrader.

Once your metatrader account is set up right click on the broker icon on your desk top—properties----find target

Once there proceed as follows for the file installation:

For fakeout.tpl file----click templates—COPY AND PASTE FILE THERE.

For Support and resistance.ex4, !MTF Shi Channel.ex4, Pinbar.ex4, patternrecognition masterv3.ex4 ----click experts----indicators----copy and paste there

For trailingstopfrcndl.ex4 and James16.ex4----click experts—copy and paste there.

Close up all windows and double click broker icon on desktop. Pull up a chart, Right click the chart—templates—fakeout—ok

Then you are all set up. Do this for any instruments you wish to trade by clicking file—new chart ----and then selecting your trading instrument. This is how you pull up a chart. then just right click the chart—templates—fakeout—ok

I’ll let all that are interested get set up. and resume tomorrow around 5pm est to look for fakeouts Play around with the metatrader4 platform and have a little fun with it

Edit: forgot to add Barry’s support and resistance It’s based on fractals

fakeout.zip (63.4 KB)

support and resistance.zip (626 Bytes)

very rarely you hear about ALL the aspects of money management in one post

they are in no particular order…

Risk to reward (how much you give vs. how much you take)
win percentage rate (how many times you win out of 100 times at bat)
lot size (how much money you trade per pip)
leverage (how much money you have available vs. how much the broker allows you to borrow to trade )
type of account --nano, micro, mini or standard (each account type has minimum lot requirements)
spreads and commissions (money paid to the broker or bank for their service of “borrowing” their money to trade)

Now things can get even more complicated if you have multiple trades on the board

But for now we will keep it simple and stick to one trade.

An average method or system has a win rate of 70% Thats 70 wins out of 100 tries
If we set up our risk to reward ratio a standard would be 1:2 or
we risk 50 pips to gain 100.

Now we look at our account size to determine our lots and leverage

suppose we have $1000 to trade. The broker allows us to trade $100 dollars for every $1 we have in our account. Therefore we can trade in theory trade $1000X 100=$100,000. The brokers allows us to “borrow” $100 FOR EVERY $1 WE PUT DOWN. When we open the trade we are placing 100X the money we have. When we CLOSE the trade we give the “borrowed” money we used back to the broker. Then depending on whether the trade was profitable or not we either get back the PROFIT made on the trade or we pay back the LOSS incurred on the trade.

Now brokers and banks charge a SPREAD and possibly a commission to use their money to trade. The spread is a difference between the price you buy THE TRADE at called the ASking price and the price the bank gives you called the Bid or offer price.

Example: the price the bank feed shows the euro/usd is 1.4000. When you place a trade you get the ASK price. If the bank has a two pip spread you would obtaIN THE TRADE AT 1.3998. (on a long or buy trade) THERE FORE YOU HAVE TO MAKE UP 2 PIPS JUST TO BREAK EVEN WHEN YOU TRADE IT BACK. THEN THEY MAY CHARGE A COMMISSION ON TOP OF THAT. You want to find brokers with the best spreads and commissions.

So now that we have our win rate, our risk to reward, and our leverage, we can calculate our lot size.

The standard Risk to put on the table is 2% This means if we keep our amount at 2% of our starting equity we could lose 50 times in a row before we would totally be wiped out. (2% X 50=100%)
A highly Improbable scenario considering our win rate is 70%

so 2% of $1000 is 20 bucks
In our example our System or method risks 50 pips to gain 100 making our risk to reward ratio 1:2 so if we can risk $20 we could profit $40. and if we are trying for 100 pips we could lose 50 pips so $20/50pips= 40 cents a pip.
The Pip value for this trade 40 cents.

if we were only going for 20 pips and risking 10 pips (still 1:2 Risk to reward) then
$20/10=$2 pip

But I digress…

Back to our example:If we can trade 40 cents per pip then the TYPE of account comes into play. There are four types nano, micro, mini, and standard,

The smallest amount you can trade on a nano is a penny a pip. Your lots are worth $100 so at 4 cents a pip you would trade 40 lots. This can get confusing because a broker may give you a cents account instaed of a dolar account.

The smallest amount you can trade on a micro is ten cents a pip. your lots are worth $1000 so at 40 cents per pip you would trade 4 lots

A mini account trades in $10,000 lots $1 per pip so you would trade 4/10ths of a lot

And a standard account trades in $100,000 lots $10 per pip so you would trade 4/100ths of a lot.

Are you beginning to see why Money management is so important?

Oh I forgot to mention the difference between a four digit broker and a five digit broker or using a different currency to calcualte all this instead of the USD.

This is just for ONE TRADE! Compound that with multiple trades at various stages of profit and loss and taking on more risk and look at how complicated it gets.

IT IS MORE IMPORTANT TO FIGURE OUT HOW MUCH YOU COULD LOSE THAN HOW MUCH YOU ARE GOING TO WIN. TRADERS CALCULATE A TRADE BY HOW MUCH THEY COULD LOSE. GAMBLERS CALCULATE A TRADE BY HOW MUCH THEY CAN WIN.

And that is what separates the 70% losers from the 30% winners.
LWLLLWLLLL

L=losing trade W= winning trade

Out of ten trades we had 2 winners and 8 losers. is this a winning system?

LWLLLWLLLLWWWWLWWWLLLWWLWWWLLLLLLWWWWWWLLLWLWLLLWWWWWLLLWWWLLWWWWLWWWLWLWLWLWLLLWLLLLWWWWWWWWWWWWWWLLLWLWWWWLLLLLLWWWLWWWLWLLWLLWLLWLLWLLLWWWWLWLLLLLWLLLWWWWWWWLLWWWWLWWWLWLW

How about now?

You need a large sample of trades to provide you enough data to correctly identfy a winning systems. Random is exactly that. A random edge to a coin flip.

If you flip a coin 200 times you are going to get streaks of heads and tails in a row. the placement of those streaks is random. But if the coin is rigged to land on heads 70% of the time you will get a pattern similar to the one above. Losing streaks are just as common as winning streaks when the ratio is balanced but if we tip the scales to 70% in our favor we will still see losing streaks but we must remember the big picture.

I have been guilty of this because I wanted a winning system but If I encountered three losses in a row I would discard a method. Or I wouldnt take into account that some systems are TIME based meaning they only work at specified times because the behavior of traders is predictable at certain Times.

Sometime between the New York Close and the Japan open:(most brokers switch over to the next days candle somewhere between these two times. The alarms will go off to tell you when)
Entry rules:
A bull colored hammer: place a market buy order
A bear colored hammer: Place a buy stop just above the Hammer head (candle body)

A bear colored shooting star: Place a market sell order
A bull colored shooting star: Place a sell stop just below the stars head (candle body)

You should be able to place a big enough trade such that you will be able to take 80% of your trade off the board at your first exit. That means you should be able to trade at least .05 lots and still only risk 2% (or less).

Your stop is placed at the top of the wick of the candle for a sell and at the bottom of the wick for a buy.

Exit rules:
Your take your first take profit at 1/2 the ATR with a lookback of 6. If you place the ATR on your chart with a value of six you then take the crosshairs and find the very end of that squiggly line. What ever that value is on the right side of the indicator window, divide by two. then move the decimal 2 to the right for yen pairs and 4 to the right for other pairs. that is the pip value of your first take profit. You will remove 80% of your trade off the board.

The stop is moved to Break even and you let the rest ride by trailing the stop to each candle on the daily or tighter with the four hour.

Pictures will explain this much better than words and I hope to have some good examples up Sunday night.

#3 and #4 hammers and stars are the best. If you get one of these with a pinbar indicator. its pretty much a slam dunk (but you can even lose with that so don’t bet the farm!) The less the barrys support and resistance lines are in the way of a profitable trade the better your chances are of making a good trade. In other words you don’t want to be trading into a lot of traffic. The more clear space ahead of your Take profit the better.

Also if the candle is the result of an exauhstion spike (just plain run out of sellers/buyers) the better the trade. These occur often at the end of a nice rally or sell off. (often on Friday Afternoons)The candles shadow will be sticking WAY out from the rest of the crowd of candles around it. A star/hammer in traffic has less of a chance of gaining momentum regardless of its number.

Ideally you want to be trading in the same direction as the slope of the channel. a good countertrend may occur if the conditions are ripe and the slope of the channel is not very steep. Just be prepared to bale early in these cases.

Once your first take profit is reached move your stop to Break even and and let the remaining 20% ride as a free trade. 9 times out of ten it will be stopped out so get used to it. Remember what I said about support and resistance? Its MORE likely to bounce than to breakout. About 1 in 10 will go for a nice run. but you took 80% off the board for a nice quick profit. Don’t get greedy with this. Take your money and run. Keep your risk low. Controlling risk is more important than how much you win.

Clear as mud Right? When we get some pictures up you will see it better.

NO grade A set ups tonight as I scan through Friday closes. But I will point out some of the lower grade B set ups. Mostly stop orders with one market order but it is against the trend.

1.ChfJpy Buy stop
2.Euraud buystop
3.gbpaud buy stop
4.nzdchf sell stop
5.nzdjpy market buy

Im not really happy with any of the setups because they do not meet grade A criteria. When it doesnt meet my criteria I look for any common themes and I see the aud possibly being over bought due to number 2 and 3 order. also I look at other aud pairs to see if it indeed seems overbought. The yen also seems to be bought.

I can’t open any of these until the market opens and with Superbowl tonight I suspect light volume. More than likely I will open the nzdjpy. It will react fairly quickly and I will know Whether to stand my ground or start immediately trailing the stop on the four hour candles. The others I can open the pending orders and see also but I have to be careful and not overload the board with too much risk.

Of all the charts I like the eur aud the best. the eurcad has a similar structure but the hammer isnt as strong. The euryen is also showing an elongated bull hammer. So I think the euraud will be my main focus for the night.

IOW I like long on euros.

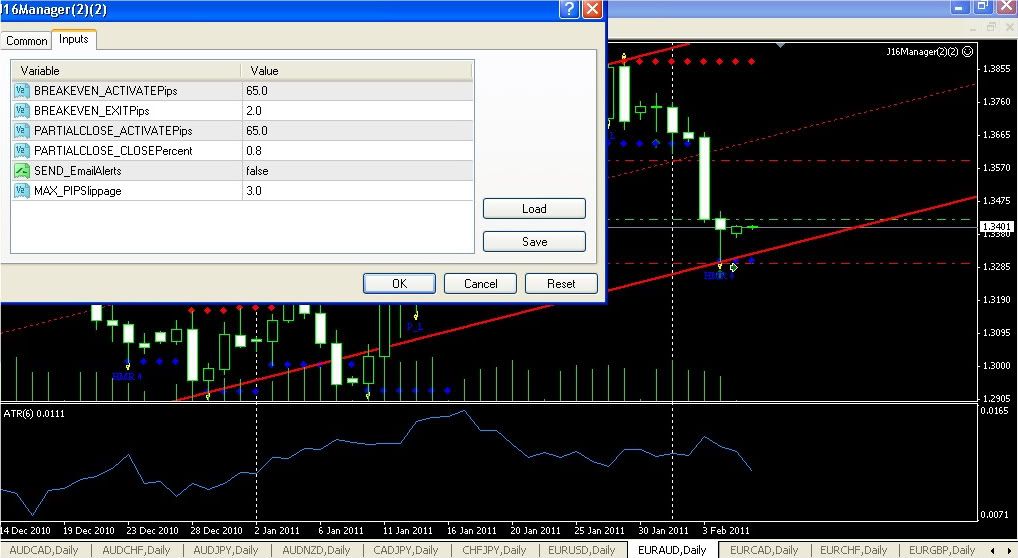
I am sticking with euraud only. The rest just didnt look right. I set up the trade manager as shown in the screen and now I just wait and watch the game!

You did a good job with those posts. Nice and clear.
I will check this out some later looks like a good strat. Probably best on longer TFs I bet if you have the patience its real good on a daily chart. I am thinking keep the template on a bunch of pairs and check it once a day, that may give enough trading opportunity.

Yes I built this with the busy persons life in mind. I don’t have time to watch the screens for hours on end. It usually takes about ten to twenty minutes out of my day and maybe a minute or two out of my morning. I spent more time writing and posting than I did actually trading. I was hoping to be in profit right now but it looks as though everyone has a hangover from Superbowl. The euro is just flopping around so I’m holding my ground. Got a couple of euro speakers up this AM. Hope they jawbone it back up.

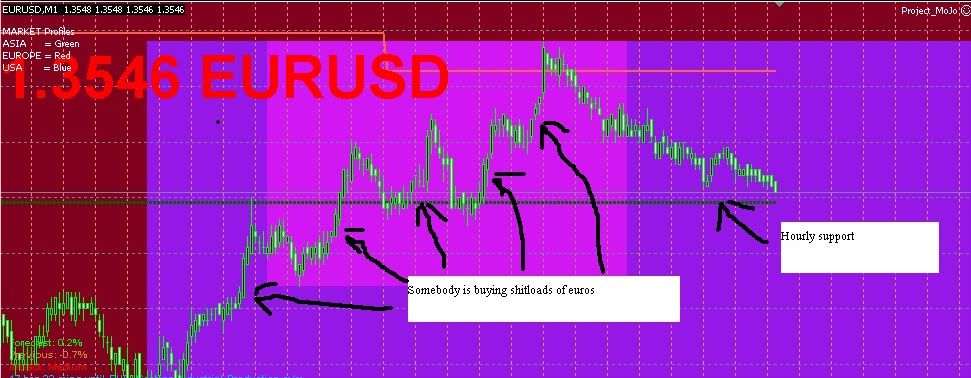
Somebody is buying ****loads…

Don’t tell me this game is not rigged. Hey Goldman Sachs! Hows it goin!??? 1 trillion in profits last year:cool:

I’m still in my eur/aud trade so I cant open another until it hits its first take profit (which it will because some big bank just bought a crapload of euros this morning) I moved my stop just outside support which kept me in the trade. I don’t normally do that But I was sure someone would come along after all the stops were run and buy which is exactly what happened after Trichet spoke. In too deep to add to the position though. now hovering at BE and waiting. You gotta be patient on this Time frame. the nzdjpy call last night went well. shoulda took it.

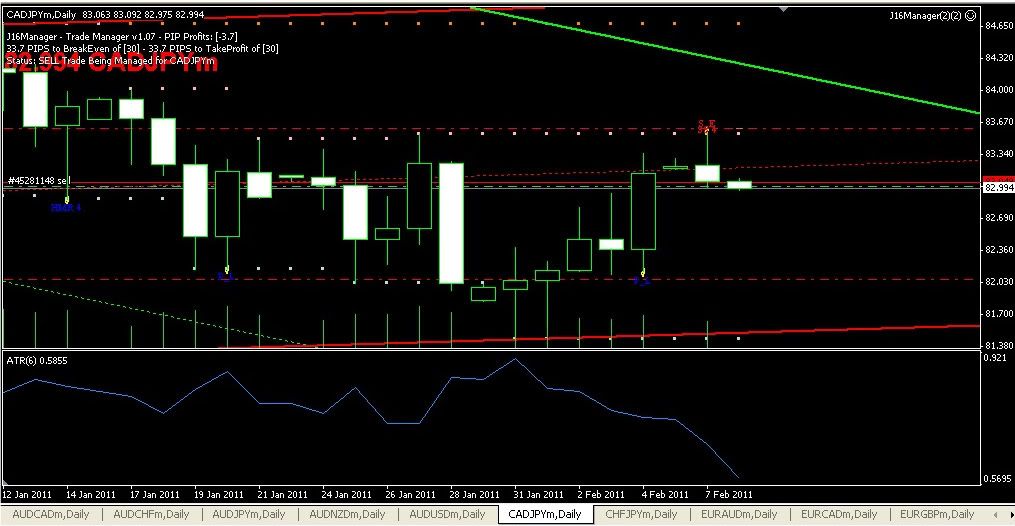
Nice set up on the cad jpy. looks similar to the nzdjpy of last night cept this ones a sell. took it on my other account The aud is showing signs of weakening which is good for me and my euraud trade.

I would short the aud if I had the equity.

This game is not rigged. :smiley:

Great Job of putting it all together,a nice conservative way of trading Pin bars and an excellent template. Thanks for taking the time.
I’m Subscribed!!:o

Thank you. I hope you find this profitable. I was running an EA on the account that had the euraud trade and was closed out for a loss. I forgot about the stop on the EA covers all trades so I was stopped out. I will let that one alone and keep the accounts segregated. Euro is in distribution and flopping around like a fish out of water.

The cad jpy hit its first take profit so I replaced the james 16 trade manager with the fractal candle manager. Stop is still at break even but have it set to trail at the new fractals on the 4h.

Edit: switched to h1 to keep it tighter

Scanning thorugh I didnt see any set ups tonight but I will look again at the candle change and see if anything pops up. SOmetimes the channels will rotate if a new fractal appears.

We’ve got a couple more hours to go but I really don’t see any setups tonight. The closest one in my opinion would be the EURCHF, but it’s not a very good hammer/pin so I won’t be taking it.
What do you thing PIB?

Its good to wait until at least 6 PM EST because you have to get through the yawns of NZ and Australian open. Then it heats up. PIB? Something Inside bar? What I found is that the hammer and star are the most predictable of the patterns which is why I use them. Others such as Inside bar, dark cloud cover, Piercing line etc. DO not hold a candle to the reliability of a hammer or star out of traffic. I will hold a star or hammer order if it turns into another pattern of a similar structure but Hammers and stars have the highest probability of at least hitting your first take profit in a very short amount of time.

The eur aud buy had I not had my little EA problem would have hit its take profit now and be soaring. Sometimes it takes a day or four and you have to really scrutinize your stop but it will work. I lost more pips to mistakes than bad trades. LOL

Yeah the eurchf looks bad, bull star and has to head back into support. Remember that resistance often becomes support so this would not be high probability trade.