Fortinet Inc (NASDAQ: FTNT) the global leader in cybersecurity is facing some turbulence as it will likely miss Wall Street’s estimate of $5.4 billion for the year.
Despite the good start of year with a +68% rally making new all time highs, the stock erased all those gains in the second half of this year. Let’s dive into the technical chart and understand the current Elliott Wave structure taking place.
FTNT Monthly Elliott Wave Chart 11.9.2023
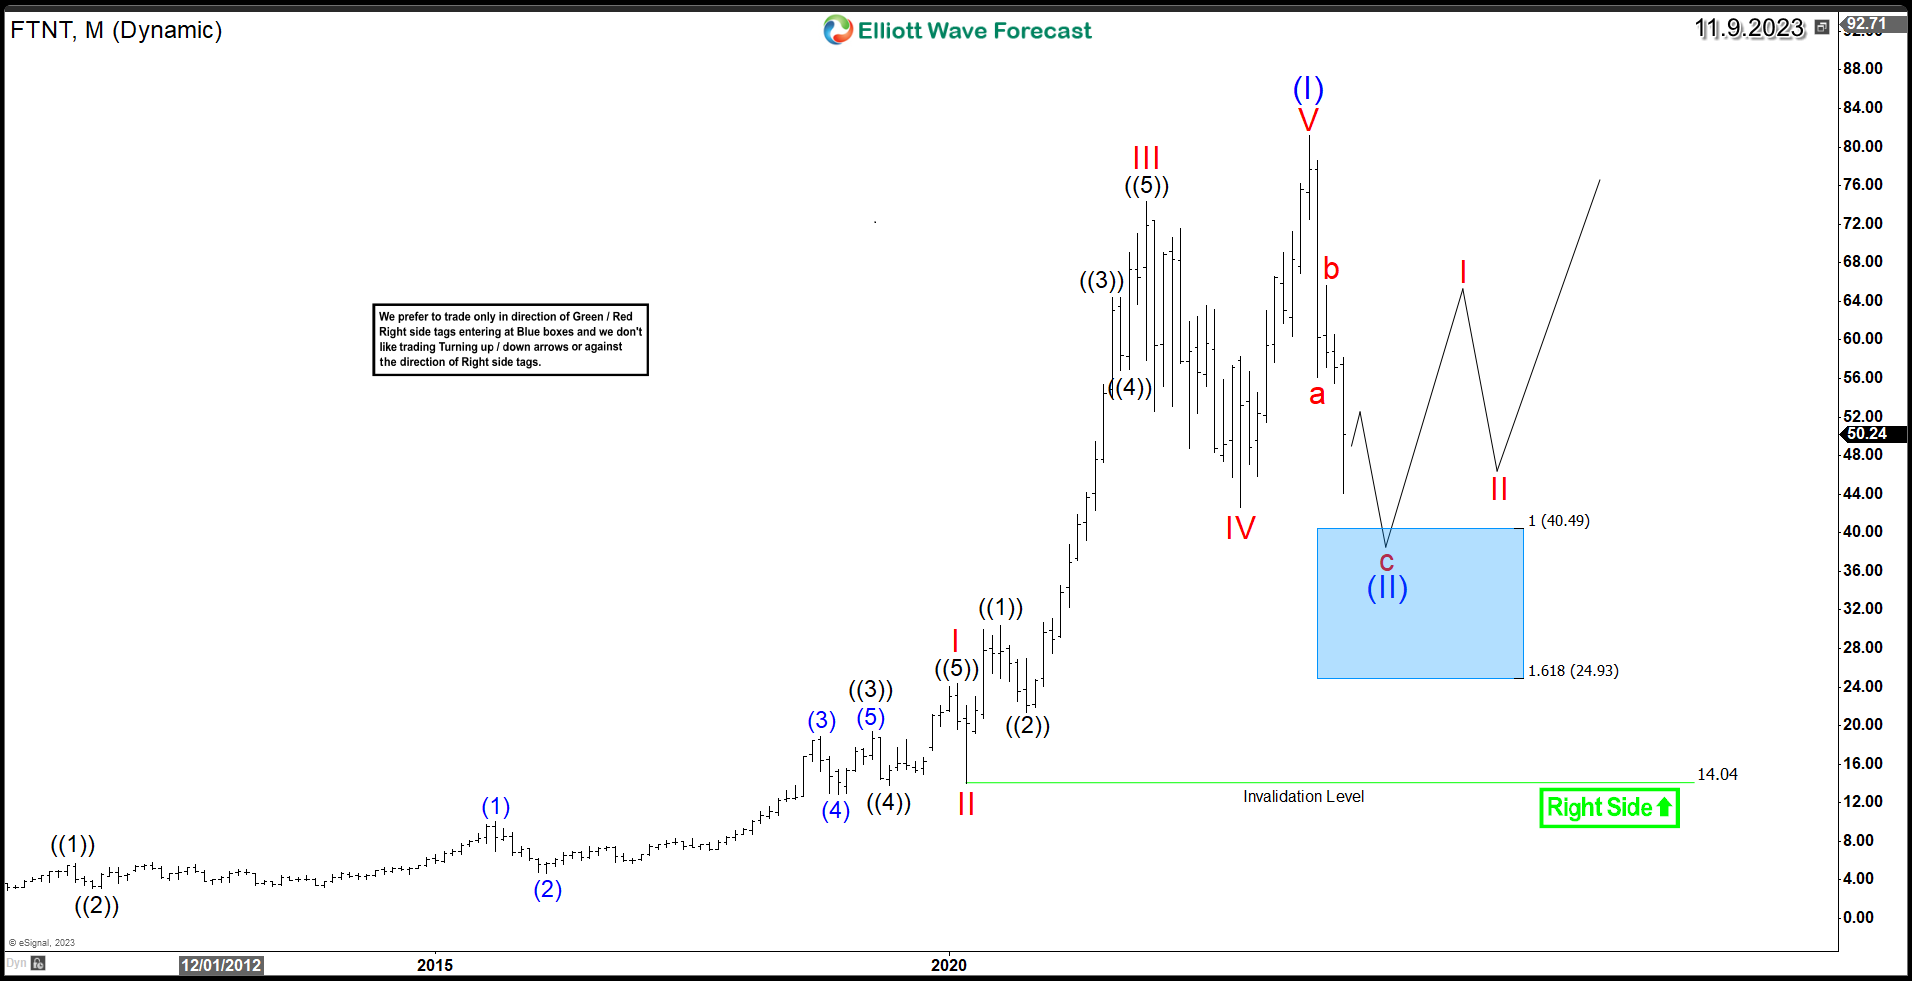
The above chart is a representation for the entire Monthly cycle for FTNT. We can see how an impulsive 5 waves rally off the lows ended wave (I). Since the July 2023 peak, the stock started a larger degree correction of the entire cycle and it’s looking to unfold as an (abc) Zigzag structure within wave (II). The pullback is still in progress in wave “c” and it’s looking for the equal legs area $40.49 - $24.93. Once it reaches that area, the stock will be looking to turn higher from there to resume the bullish trend.
Here is the basic Elliott Wave Theory Pattern
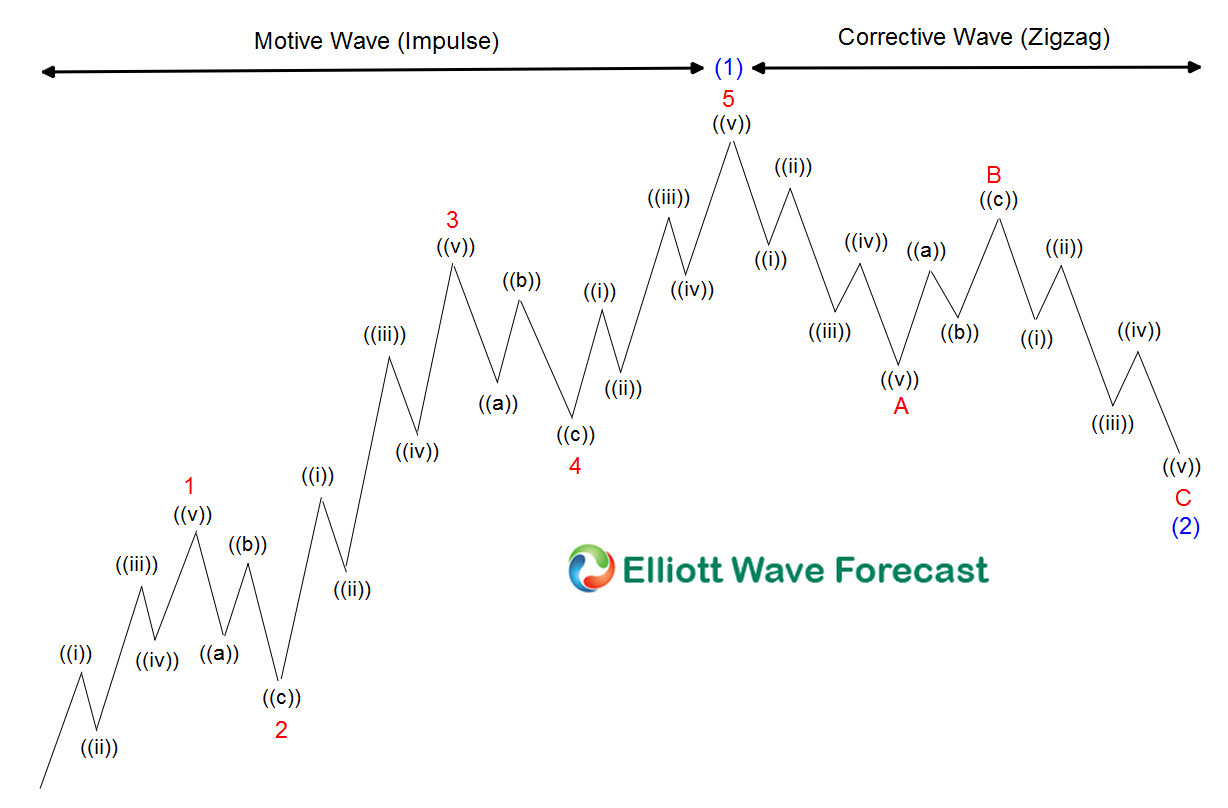
The graph above shows the five waves advance, and each leg subdivides into a lower degree five waves. It is a fractal pattern which repeats in each degree from the Grand Supercycle until the lower degree of the subminute. The chart is clear; each cycle is in five waves, and each pullback in three, but always in the direction of the trend.
In conclusion, the long term technical picture for FTNT remains bullish and investors should be on the lookout for the blue box area as a monthly buying opportunity.