Total SA is traded under tickers $FP @ Euronext and $TOT @ NYSE. It is of particular interest today as the world indices are dropping in a straight down mode. Hereby, Total may provide clues to identify the turning point in indices as it shows a pattern with the textbook quality. Since stocks are always bullish in their nature, correct determination of a corrective pattern may be used by investors as a key to enter the market at a reasonable price.
Total Weekly Elliott Wave Analysis 03.31.2020
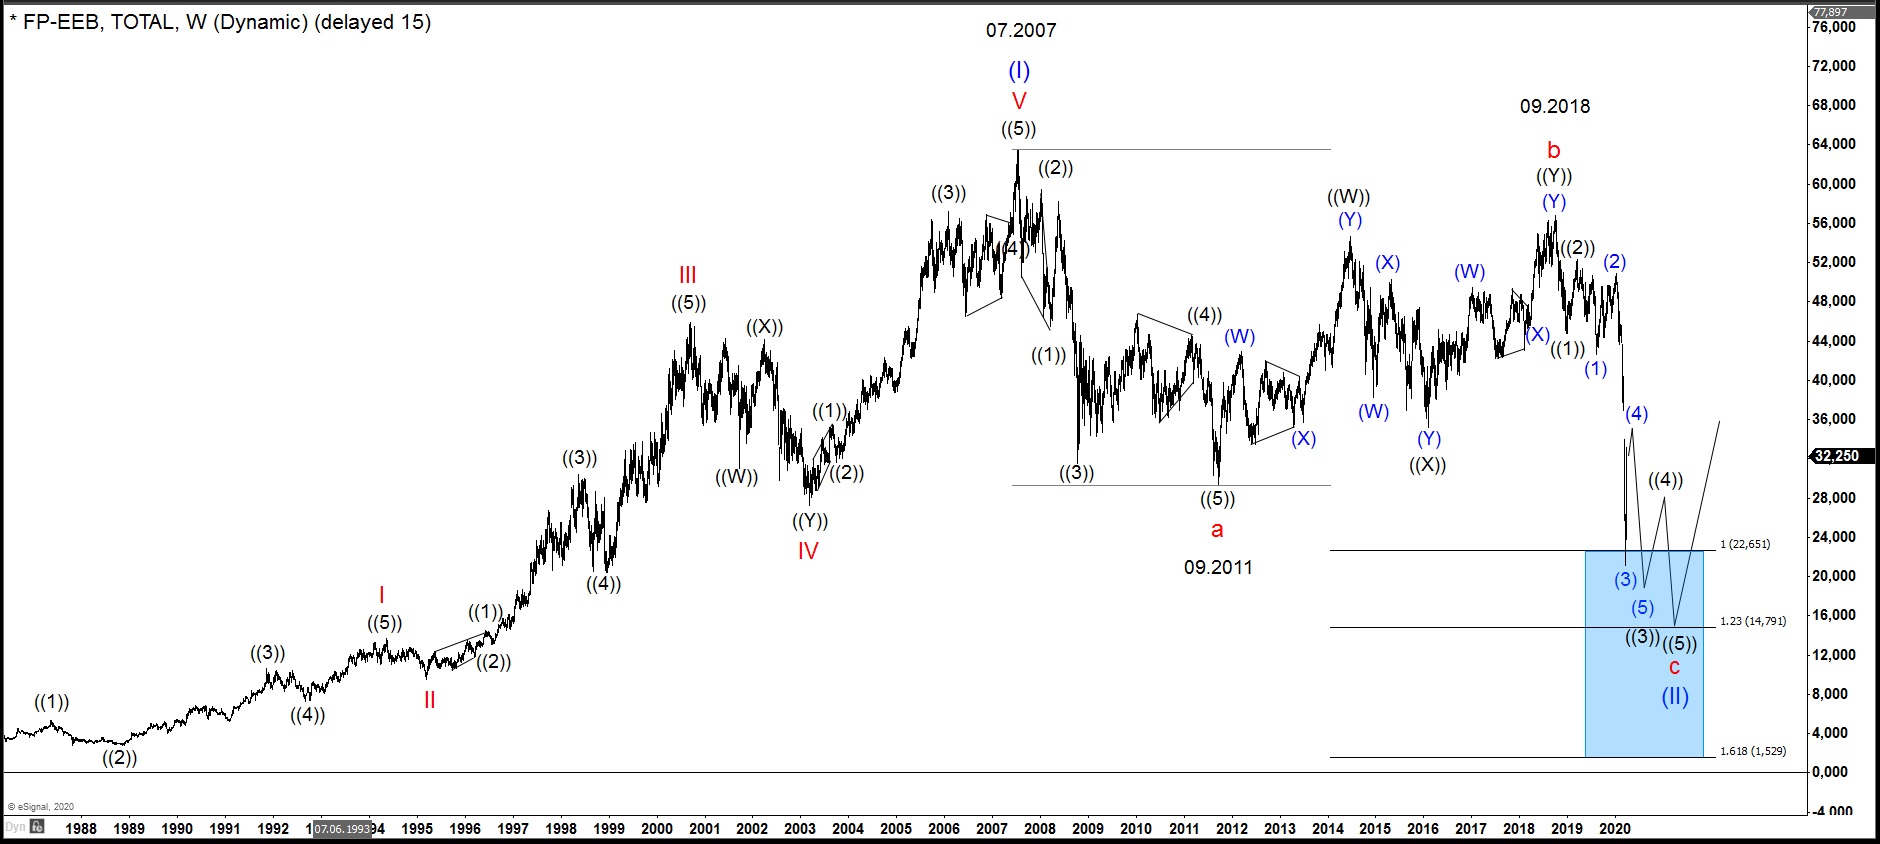
Weekly chart below shows the Total stock $FP at Euronext. From the all time lows, first, it has developped an impulsive rally to the important top on 07.2007. The motive wave in blue wave (I) is of grand super cycle degree. It consists of 5 red subwaves of cycle degree. The waves I, III and V in their turn contain 5 subwaves of primary degree. From Elliott Wave theory, we know that after 5 waves advance a correction in 3 waves should follow.
The decline from 07.2007 highs to the 09.2011 lows is sharp and shows a 5 wave form. This is a sign that the correction lower is unfolding as an Elliott Wave Zigzag pattern. Consequently, we denote the first leg down as a red wave a. From 09.2011 lows, the rise towards the 09.2018 highs is overlapping and can be a double three pattern of wave b. Choppy patterns form frequently a connector wave, the middle part, within a zigzag.
Finally, the market was ready to extend lower in another leg down to end correction of the grand super cycle. From 09.2018 highs, the stock price has demonstrated two nests lower in waves ((1))-((2)) of primary degree and (1)-(2) of intermediary degree. As a consequence, a sharp fall in (3) of ((3)) has brought the prices to the equal legs extension area towards 22.65-14.79. From there, immediate reaction higher has been observed. As a matter of fact, blue boxes are high frequency areas where prices should resume the rally or to provide a 3 waves bounce at least.
Total Outlook
While below 36-38, Total may extend lower in series of waves (4)-(5) of intermediary degree and ((4))-((5)) of primary degree. In fact, these are required to resolve the two nests below the peak on 09.2018. Therefore, the stock should see two new lows towards 20-15. Until all necessary swings are in place, the stock should find pressure from sellers. Investors should consider buying from the blue box area at 22.65-14.79. As a prerequisite for more upside, however, observation of two swings lower is mandatory. Only then, investors may enter the market. Once the important bottom is in place, Total may extend towards 65 and higher along with oil prices and world indices.