Hi,
Anyone working with fractals?
When will they appear exactly? At the candle’s close where the arrow is or later?
Thanks.
Hi,
Anyone working with fractals?
When will they appear exactly? At the candle’s close where the arrow is or later?
Thanks.
If a fractal is formed, usually, you’ll know after 2 candles has formed after it.
the MT4 default fractal paints a fractal on a swing high when there is a high with 2 lower highs preceding it, and 2 lower highs following it. Vice versa for a swing low fractal. As long as those rules are obeyed, EVEN IF THE CANDLE HAS NOT CLOSED, then the fractal will be drawn. Because of that, the fractal can “repaint” until the 2nd candle following it has closed.
Not “usually”.
Always, every time, no exceptions.
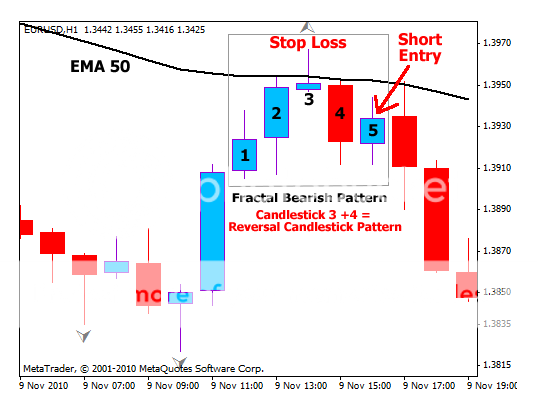
The definition of a fractal high is a candle whose HIGH is higher than the HIGHS of the two previous candles, and higher than the HIGHS of the two subsequent candles. In other words, it is a 5-candle pattern.
For fractal lows, the pattern described above is simply inverted.
While the 5th candle is still live (i.e., has not yet closed), the 3rd candle is [B]potentially[/B] a fractal high.
[B]As soon as the 5th candle closes[/B], the 3rd candle becomes a fractal high, and this will not change regardless of subsequent price action.

In the image above, ignore the “Stop Loss” and “Short Entry” labels. Just focus on the 5 numbered candles.
[B]Candle #3 did not become a fractal high until Candle #5 had closed.[/B]
Thanks guys, I think I get it now. 
Also, thank you Clint for the picture.
And what if the 5th candle closes above the third candle?
Then there is no fractal high within that 5-candle cluster.
Edit:
I dashed off that answer too quickly.
[B]Where the 5th candle CLOSES[/B] is not the issue.
[B]Rather, it’s whether the 5th candle makes a HIGH that is higher than the HIGH of the 3rd candle [/B](regardless of where the 5th candle goes on to close). If the 5th candle does that, it rules out Candle #3 as a fractal high.
If the 5th candle makes a HIGH that is higher than the HIGH of the 3rd candle, the 5th candle [B]may[/B] go on to become a fractal high, [B]if[/B] Candle #6 and Candle #7 (which have not formed yet) both close having made lower HIGHS than the HIGH of Candle #5.
To add to Clint’s wise words, you should really study the concepts of fractals in general.
While I don’t base my trading on using a fractal indicator, I [I]do[/I] use the fractal nature of price movement in general.
If you understand what makes price fractal, it will help infinitely in the way you approach trading.
It’s the reason there can be downtrends in uptrends, and vice versa. The fact that opposing trends occur on different time frames is all due to price’s fractal nature.
It can help you in the timing of trades, and will assist on getting great entries, and exits.
Cheers!
Thanks Clint.  That’s why I had said usually. I guess I should have been more clear by saying the opening of the fifth candle.
Regards,
Clark.
Hello,
One of my favorite subjects so I’m ‘butting in’ here (not to mention being bored i.e. I HATE holidays. I think I’m turning into a ‘Scrooge McDuck’ to be honest)!!! LOL!!!
And of course you know how I love to complicate things!!!
The Fractals that you’re all talking about are known as ‘Pristine Fractals’ (The Fractal Indicator is Bill Williams ‘invention’ but NOT Fractal Geometry on which his theory is based). But there are ‘other’ types of Fractals too. I’ve scanned two pages of one of his books to demonstrate (see below). (By the way: how ANYBODY could go take the time and effort scan a complete book, convert it to a .PDF, and make it freely available on the Internet is beyond me i.e. it must take AGES to do)!!! LOL!!!
One thing to bear in mind though: Bill Williams trades ‘Fractal Breakouts’ which is different from the method described by Clint.
These were taken from his last ‘version’ of his ‘Trading Chaos’ system. The book is called ‘Trading Chaos Second Edition’ (you’re BOUND to find it on the Internet)!!!
An earlier ‘version’ of the system is found in ‘rough detail’ here too: Alpari Academy - Market Analysis Guide - Bill William’s Chaos Theory - Alpari (UK).
Have fun!!!
Regards,
Dale.
Hi Clint. In your description of a fractal you said it’s a candle whose high is higher than the 2 previous candles and the 2 following candles. Does candle 1’s high have to be lower than candle 2’s high or does it just have to be lower than 3? Can you recommend any further reading on this? They seem to be quite a good reversal signal. Thanks
No. It doesn’t matter whether the Candle #1 High is higher or lower than the Candle #2 High.
As Dale Paterson pointed out (here on this thread), Bill Williams invented the indicator we call “fractals” — so, Willams’ book is the basic source-document on the subject.
On another thread, Master Tang cited this article from Investopedia — A Trader’s Guide To Using Fractals
If you are more of a “visual” learner, here is a YouTube video from Vic Noble on using Swing Highs and Swing Lows (fractals) to determine Market Flow — Forex Trading using Market Flow - YouTube
The last third (or so) of this video is advertising for Vic’s forex courses — so watch it, or ignore it, as you feel inclined.
Sorry, I thought I’d replied here but doesn’t look like I did. Anyway, thanks Clint!