Fibonacci analysis will help you to be top tier trader from Forex dummy trader. Fibonacci analysis is the study of identifying possible support and resistance levels in the future based on previous price trends and reversals.
Fibonacci analysis is established on mathematical pattern discovered by Leonardo Pisano—also known as Fibonacci. Fibonacci is credited with finding a sequence of number pattern, which is named after him: The Fibonacci sequence.
The Fibonacci sequence is a series of numbers that progresses as 0,1,1,2,3,5,8,13,21,34,55…. The sum of the two preceding numbers becomes each subsequent number in the sequence. For example, you add 21 +34 (the two preceding numbers) to arrive at the number that follows 34 in the sequence. The sum of 21 +34 is 55, which is the next number in the sequence.
The groundbreaking part of Fibonacci sequence is that there is a specific ratio between the numbers. Each sequence in Fibonacci sequence is 1.618 times larger than the previous number. For example, 34 is 1.618 times larger than 21 (34 ÷ 21 = 1.618).
Fibonacci ratios are commonly used in the forex market with the following analysis tools:
Fibonacci Retracements
Fibonacci Projections
Fibonacci Fans
Fibonacci Retracements
When a currency pair reverses trend, it is natural to wonder how far the pair is likely to move towards new direction. That’s when Fibonacci retracement levels become handy tool. Specific Fibonacci ratios are useful to determine the new behavior against previous trend.
The ratios are helpful for you to find the following retracement levels:
23.6 %?
Calculated by dividing a number in the Fibonacci sequence by the third number following it in the sequence (21 ÷ 89 = 23.6%).
38.2 %?
Calculated by dividing a number in the Fibonacci sequence by the second number following it in the sequence (34 ÷ 89 = 38.2%).
50 %?
Calculated by finding the middle between 61.8 % and 38.2 %
((61.8% + 38.2%) ÷ 2 = 50%).
61.8 %?
Calculated by dividing a number in the Fibonacci sequence by next number (55 ÷ 89 = 61.8%).
76.4 %?
Calculated by finding the distance from 38.2 % and 23.6 % (38.2% – 23.6% = 14.6%)
and adding it to 61.8 percent (61.8% + 14.6% = 76.4%).
100 %?
Calculated by finding where the previous trend began.
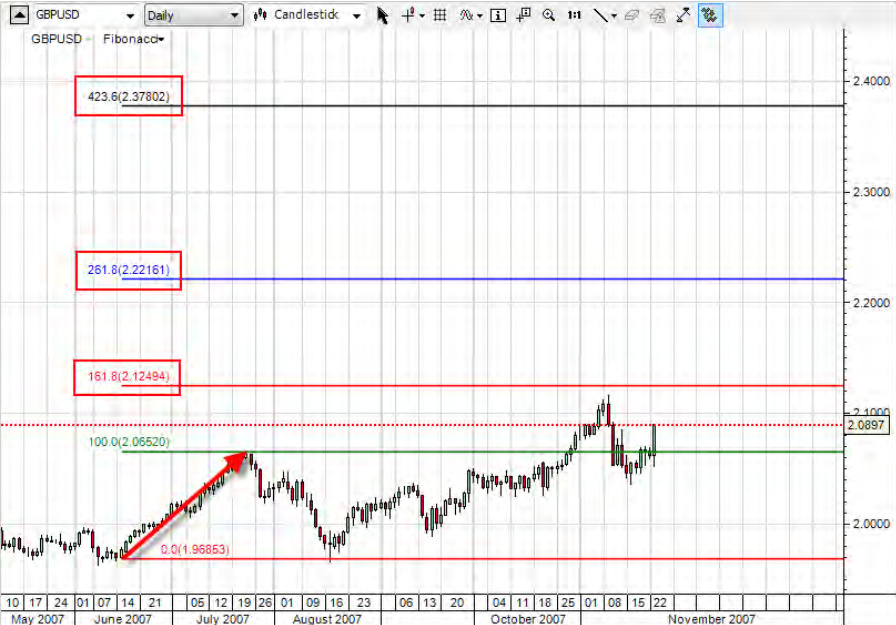
Determining all six Fibonacci retracement levels gives potential support and resistance levels that you can utilize in your forex trading. See how Fibonacci levels can be used on the daily GBP/USD chart below. The levels were illustrated along with the trend highlighted by the red arrow. You can use each level to help you determine the entry and exit point as the currency pair began to turn around and move lower.
Starting from Mid-June, see how the price of the currency pair moved up and down, bouncing off of these support and resistance levels for months, until finally going back up above the high established in late July by the previous trend (also known as the zero percent level) in late October.


