We’re eagerly awaiting the results of the EU finance ministers meeting where Greece is expected to get approval for the next tranche of loans. Approval is expected to be a positive result for the Euro.
In the meantime, we have the Bank of England Minutes scheduled as the next major news item on the economic calendar set for release at 9:30 GMT (4:30am ET). Here’s why the minutes are important:
[I]Although the Bank of England (BoE) held a cautious outlook for growth, heightening price pressures in the U.K. will limit the scope for additional monetary support as the economy emerges from the double-dip recession. Indeed, we’ve seen a growing number of central bank officials highlight the stickiness in consumer price growth, and the meeting minutes may reveal a growing rift within the Monetary Policy Committee as the central back no longer sees a risk of undershooting the 2% target for inflation.
Full Article: Forex: GBP/USD- Trading the Bank of England Minutes | DailyFX[/I]
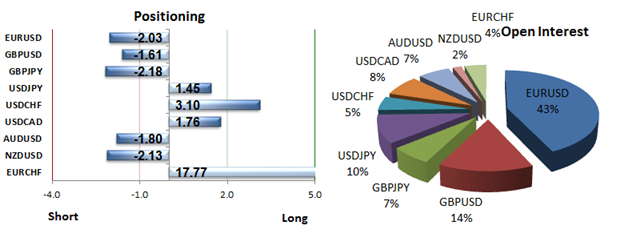
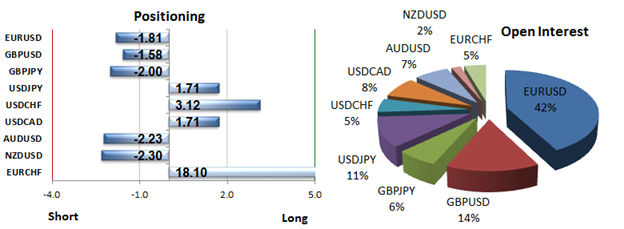
Trader positioning in GBP/USD is almost perfectly neutral with 51% long and 49% short, marking uncertainty about market direction. Watch out for volatility at the release! Here’s a look at the most recent SSI positioning release:
The measure of 1.03 indicates there are 1.03 long positions for every 1 position short. So it’s almost matched perfectly 1 for 1. In a more extreme example, you will see there are 16.52 long EUR/CHF positions for every 1 short position or put another way, 94% of EUR/CHF positions are long.
[B]“Trading breakouts is especially difficult because it feels as though one is buying the top or selling the bottom.”[/B] - Jamie Saettele
Can you relate?
Jamie wrote this in regards to the USD/JPY which has risen 300 pips over the past 7 days. Here is his outlook for USD/JPY and how you could potentially trade it from here:
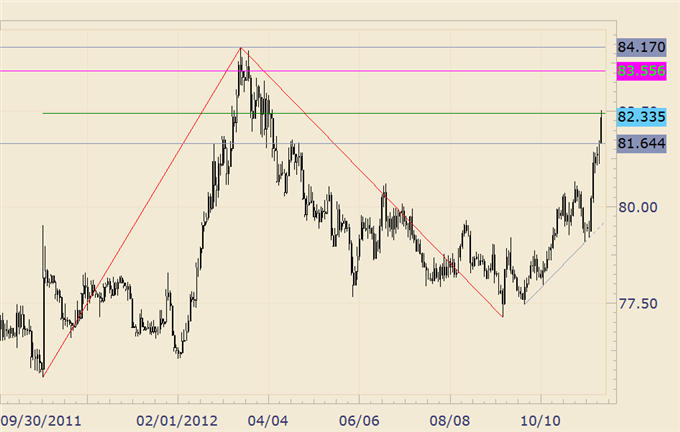
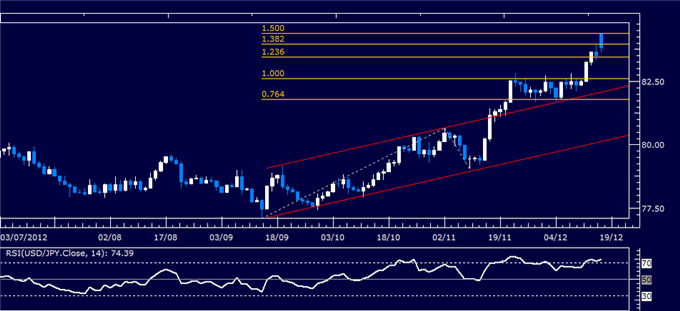
[I]Price has now reached the next cluster of technical resistance surrounding 8250 and a reaction here would present the next opportunity to align with the move for a test of 8345 and potentially a break of the March high at 8417. 8215 is now estimated support and the level to trade against is moved up to 8164. Always ask yourself if you can handle the risk…another way to put this…It’s better to wish you were in a trade than wish you were out of a trade. Source: FOREX Trading: USD/JPY Break Reaches 82.50 Confluence | DailyFX[/I]
[B]USD/JPY[/B]
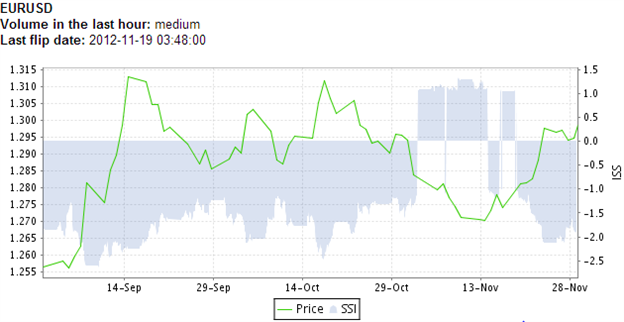
A second important event for USD/JPY has been the flip in SSI positioning from net long to net short, serving as a contrarian signal that the pair may continue moving higher. If you look at SSI over a longer period, traders have been short for a LONG time so this is quite significant. Here’s the longer term SSI chart with green indicating long positions and larger the bar the greater percentage of longs to shorts.
SSI can be found updated twice per day in DailyFX PLUS.
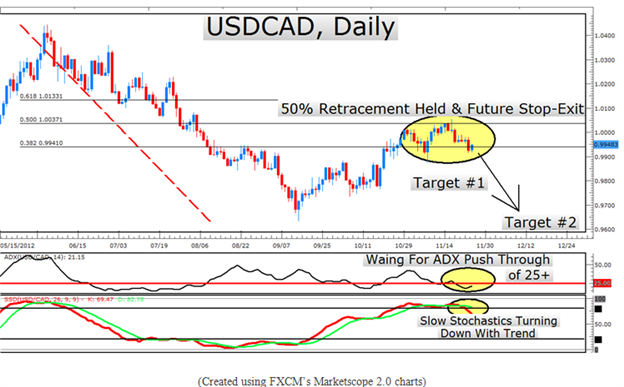
For the past couple of months, the US dollar has risen steadily against the Canadian dollar. Now there are signs that this trend could be reversing. Below is a daily chart of USD/CAD from an article on DailyFX.com by Tyler Yell. In it you can see that the USD/CAD is currently trading at the 50% retracement level of a long term downtrend that began in June.
“This current USDCAD set up shows us the beginnings of another potential strong down move. When the ADX breaks through 25, we have the indicator’s invitation to enter in the direction of the overall trend. Because the ADX isn’t there yet, we’ll wait for the set up to develop.”
The latest SSI readings for USD/CAD on DailyFXplus.com lend further support to shorting USD/CAD. Not only are traders net long the pair (SSI @1.76) but long positions have increased 17.2% while short positions have decreased 20.5%
Just yesterday the OECD slashed its global growth forecasts for 2013. [I]“The Paris-based think-tank forecast in its twice-yearly Economic Outlook that the global economy would grow 2.9 percent this year before expanding 3.4 percent in 2013.”[/I]
Since stock and bond yields are expected to be low in this environment, I have renewed interest in the carry trade. Currently the Swiss Franc/Swedish Krona pair (CHF/SEK) is trading near a key level. A short position here could target the August lows below 6.9000.
What makes this interesting is the carry trade potential. With a 100k short position earning about $2 in rollover interest per day, on 10:1 leverage that’s about 7.3% per year, not including what could be made or lost on the price move of the trade itself.
You can find the rollover rates for all the currency pairs in the Dealing Rates window of the FXCM Trading Station as shown above.
Here is the latest trading signal from the Tidal Shift Strategy on DailyFX PLUS. Tidal Shift is a trend trading strategy that aims to catch shifts in trend using trader sentiment as an indicator.
[B]Entry: 81.736 - 82.006
Trailing Stop Loss: 82.410
Limit: None (to be closed by trailing stop)[/B]
[B]USD/JPY Daily Chart[/B]
The signal was issued today because our Speculative Sentiment Index (SSI) has hit its most extreme positive level for the past 145 trading hours at 1.714, which suggests that the USDJPY could be trending downwards.
The Euro takes the title of top performer this morning, with the EUR/USD rallying back towards 1.3000, as investors are exhibiting behavior that would suggest uneasiness about the sovereign debt crisis is fading. According to the latest readings on DailyFX PLUS from today’s Speculative Sentiment Index (SSI), the Euro could rally further still as retail traders attempt to fade these gains.
The ratio of long to short positions in the EURUSD stands at -2.17 as approximately 32% of traders are long. Yesterday the ratio was -1.68; 37% of open positions were long.
Long positions are 13.9% lower than yesterday and 12.5% below levels seen last week. Short positions are 11.4% higher than yesterday and 13.6% above levels seen last week. Open interest is 2.0% higher than yesterday and 6.5% above its monthly average.
Since SSI is a contrarian indicator to price action, the fact that the majority of traders are short gives a signal that the EUR/USD may continue higher. Current SSI is lower than yesterday and lower from last week. The combination of current sentiment and recent changes gives a further bullish trading bias.
Here is a look at next week’s Economic Calendar. There are 5 central bank decisions and also the always important Non-Farm Payrolls number from the US. That should translate to some good price action.
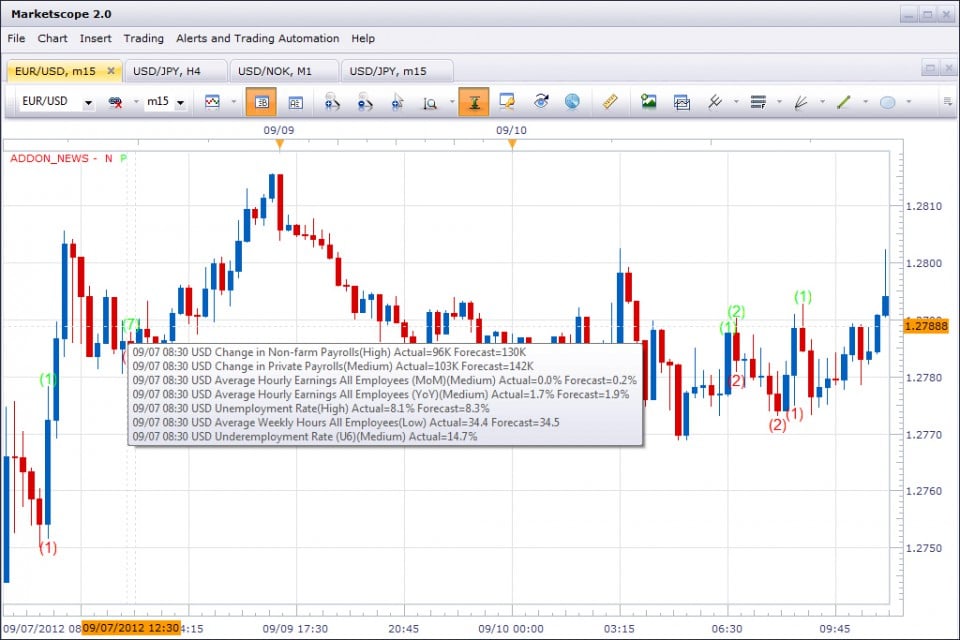
There’s a free DailyFX News Add-on for the Trading Station that lets you track these key economic events right on the charts. It plots information from the Economic Calendar directly onto charts.
You can hover the mouse pointer over each candlestick for information on the previous, forecasted and actual data from each economic news release. News items will show as Green if the news is positive and Red if the news is negative.
Jim O’Neill, Chairman of Goldman Sachs Asset Management made the following comment on CNBC’s Squawk Box this morning.
[I][B]“More and more longer-term investors are being influenced by [the fiscal cliff impasse] and are starting to think Europe has dealt with some of its long-term issues, even though the economies are weak. I detect the first signs of people shifting more towards Europe from the U.S.”[/B][/I]
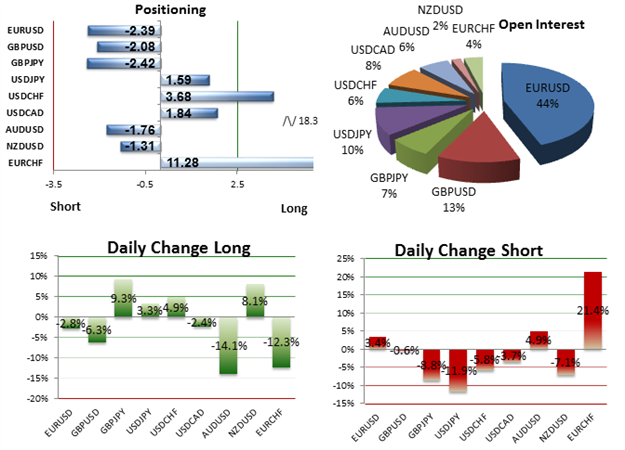
The latest Speculative Sentiment Index (SSI) readings from DailyFX PLUS support this bullish view on the Euro. The ratio of long to short positions in the EURUSD stands at -2.39 as approximately 29% of traders are long.
We use our SSI as a contrarian indicator to price action, and the fact that the majority of traders are short gives signal that the EURUSD may continue higher. Current SSI is lower than yesterday and lower from last week. The combination of current sentiment and recent changes gives a further bullish trading bias.
Tyler Yell, DailyFX Trading Instructor shared the chart above which shows the Ichimoku Cloud. The EUR/USD price is currently trading above the Kumo (cloud) which is a buy signal for that indicator.
Welcome to BabyPips. Glad you are visiting this thread. Let me know if there are any currency pairs or trading signals that are of particular interest to you.
UKOil (Brent) has been moving lower in a pricing channel on the daily chart since it created a high at 117.92 on September 14th. Resistance has been formed by connecting a series of highs from the 14th including yesterday’s move to a lower high at 112.30.
As price turns from this resistance point, channel traders will look for a longer term move back to its daily line of support shown above. We can get an indication for a possible entry point to go short by looking at the 2-hour chart below. It shows that UKOIL beginning to test a short term support line.
Price has been steadily increasing along this point since the creation of the standing low at 104.74. Now that price has moved off of daily resistance line mentioned in our previous chart, channel traders can look for a break of this short term level of support for new trade entries.
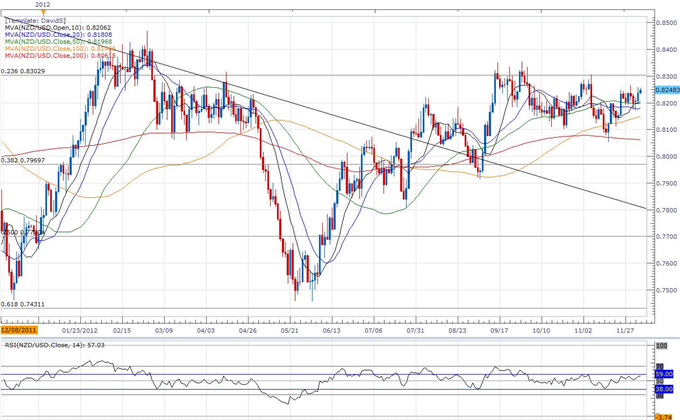
The Reserve Bank of New Zealand is widely expected to keep the benchmark interest rate at 2.50% in December, but the statement accompanying the rate decision may increase the appeal of the high-yielding currency should the central bank drop its dovish tone for monetary policy.
[B]Time of release[/B]:12/05/2012 20:00 GMT, 15:00 EST
[B]Primary Pair Impact[/B]: NZDUSD
[B]Expected[/B]: 2.50%
[B]Previous[/B]: 2.50%
[B]DailyFX Forecast[/B]: 2.50%
Currency Analyst David Song highlighted his approach for trading this announcement in an article today on DailyFX.com:
[I]"…the policy statement may instill a bullish outlook for the New Zealand dollar should the central bank drop its dovish tone for monetary policy. Therefore, if Governor Wheeler talks down expectations for a rate cut, we will need to see a green, five-minute candle following the announcement to establish a buy entry on two-lots of NZDUSD.[/I]
[I]“Once these conditions are fulfilled, we will set the initial stop at the nearby swing low or a reasonable distance from the entry, and this risk will generate our first objective. The second target will be based on discretion, and we will move the stop on the second lot to breakeven once the first trade hits its mark in order to preserve our profits.”[/I]
The Tidal Shift Strategy on DailyFXplus.com has just sold EURAUD at 1.23632. Tidal Shift is a trend trading strategy that aims to catch shifts in trend using trader sentiment as an indicator.
Time Issued: Thursday, 06 December 2012 16:01:16 GMT Status: open Entry: 1.2342 - 1.23844 Limit: N/A Trailing Stop: 1.24479
The system recommends entering this trade at any price between 1.2342 and 1.23844. The signal was issued because our Speculative Sentiment Index has hit its most extreme positive level for the past 145 trading hours at 1.94496, which suggests that the EURAUD could be trending downwards.
The 14-period Average True Range on a daily chart is 0.00169, so the stop loss has been set at 1.24479. This stop loss order is a trailing stop that will move down as the market moves down. There is no profit target for this strategy, since the idea is for it to be closed by the trailing stop.
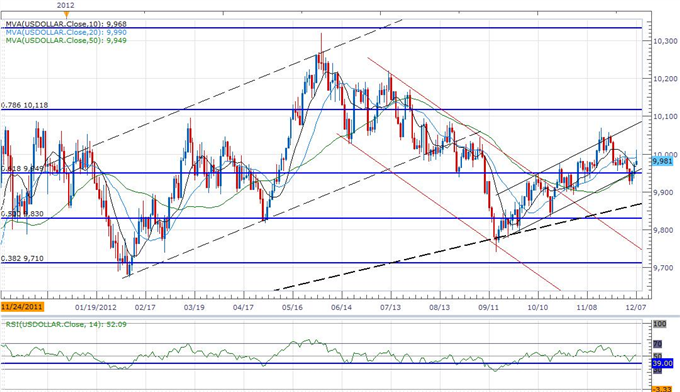
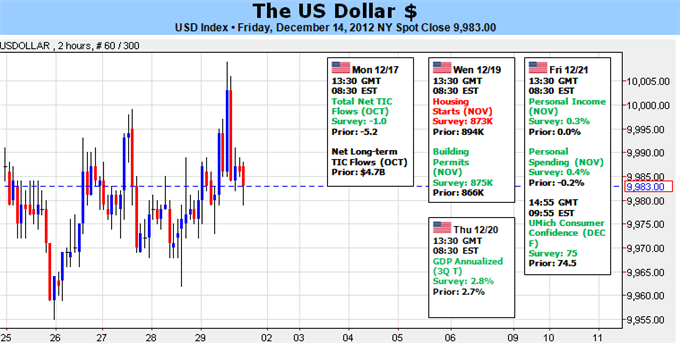
The 146K rise in U.S. Non-Farm Payrolls increased the appeal of the US Dollar ahead of the Federal Open Market Committee (FOMC) interest rate decision, and the meeting may prop up the reserve currency in the week ahead should the central bank carry its wait-and-see approach into the following year.
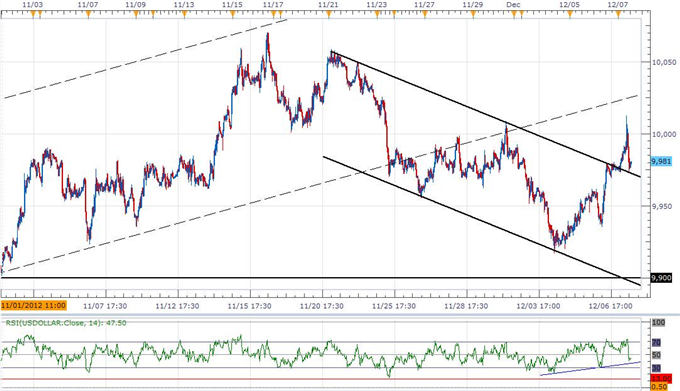
The Dow Jones-FXCM US Dollar Index (Ticker: USDOLLAR) remains 0.08 percent higher from the open after moving 104 percent of its average true range, and the rebound from 9,917 may get carried into the following week as the fundamental outlook for the world’s largest economy improves.
As the 30-minute relative strength index appears to be carving an upward trend, we may see former trendline resistance act as new support, and the dollar may continue to retrace the decline from the previous month amid the more broad-based recovery in the world’s largest economy.
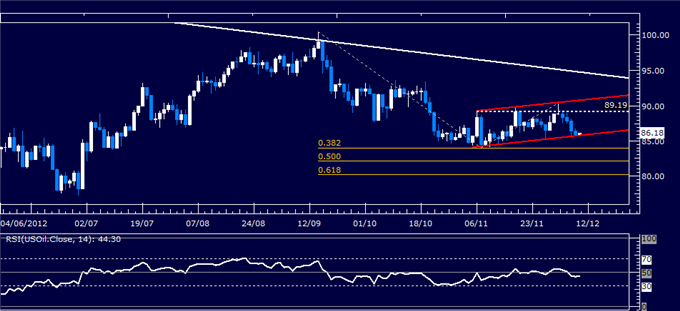
Republicans and Democrats have been at loggerheads on a compromise plan to avoid the “fiscal cliff” and more of the same is likely to weigh on risk appetite. Such an outcome is likely to produce losses for risk-linked crude oil while gold sees de-facto pressure amid returning haven demand for the US Dollar.
[B]WTI Crude Oil (NY Close): $85.93 // -0.33 // -0.38%[/B]
Daily Chart - Created Using FXCM Marketscope 2.0
Oil prices moved lower as expected after putting in a Shooting Star candlestick. A bearish continuation Flag chart pattern now appears to be in the works, with a break of support at 85.76 confirming the setup and initially exposing the 38.2% Fibonacci expansion at 84.04. Near-term, resistance is at 89.19. A push above that aims for the Flag top at 90.76.
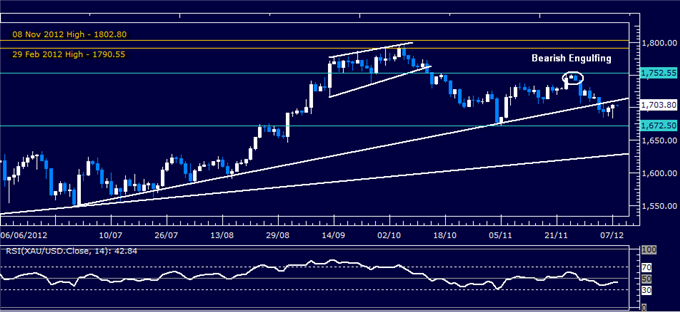
[B]Spot Gold (NY Close): $1704.05 // +4.15 // +0.24%[/B]
Daily Chart - Created Using FXCM Marketscope 2.0
Gold prices broke lower after putting in a Bearish Engulfing candlestick pattern, taking out support at a rising trend line set from late June. Sellers now aim to challenge the November 5 low at 1672.50. The trend line (now at 1711.06) has been recast as resistance, with a push back above that aiming to challenge 1752.55.
Strategists are looking to invest in Europe instead of the US as the better investment at least in the early part of 2013. The number one reason: the US Fiscal Cliff. Below is a quote from Garry Evans, Global Head of Equity Strategy at HSBC from an article today on CNBC.
“The ‘fiscal cliff’ in the U.S. is a worry, and that’s one of the reasons that I’m underweight the U.S. and I prefer Europe - it’s a bit of an unusual place to be.”
The ratio of long to short positions in the EURUSD stands at -1.89 as approximately 35% of traders are long. Yesterday the ratio was -1.34; 43% of open positions were long. In detail, long positions are 14.2% lower than yesterday and 23.5% above levels seen last week.
Short positions are 21.4% higher than yesterday and 21.3% below levels seen last week. Open interest is 6.2% higher than yesterday and 2.4% below its monthly average. We use our SSI as a contrarian indicator to price action, and the fact that the majority of traders are short gives signal that the EURUSD may continue higher.
With the Fed meeting in focus, the shift away from the US Dollar has begun. The EURUSD has cleared 1.3010/30 resistance and has retraced nearly all of its losses since Thursday. The latest readings from the Speculative Sentiment Index (SSI) on DailyFXplus.com suggest that this rally has the potential to take the single currency to 1.3100 and beyond.
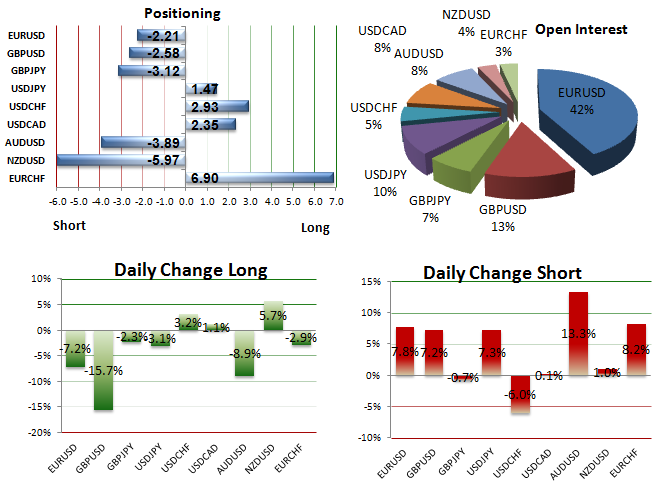
The ratio of long to short positions in the EURUSD stands at -2.21 as approximately 31% of traders are long. Yesterday the ratio was -1.90; 35% of open positions were long. In detail, long positions are 7.2% lower than yesterday and 12.8% above levels seen last week.
Short positions are 7.8% higher than yesterday and 5.7% below levels seen last week. Open interest is 2.6% higher than yesterday and 1.6% above its monthly average. We use our SSI as a contrarian indicator to price action, and the fact that the majority of traders are short gives signal that the EURUSD may continue higher.
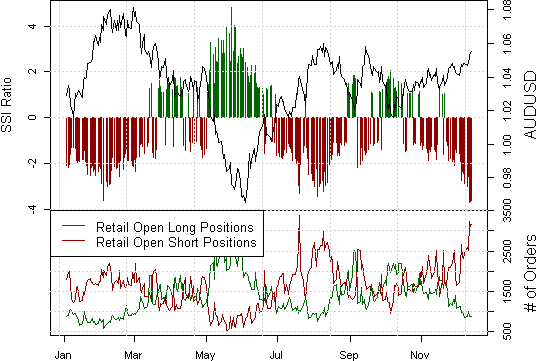
According to the latest SSI readings, retail trading crowds are their most aggressively short the Australian Dollar against the US Dollar (ticker: USDOLLAR) since it traded above $1.08 in February, and a contrarian view calls for continued strength.
A fresh wave of Quantitative Easing from the US Federal Reserve was enough to push the US Dollar (ticker: USDOLLAR) lower cross the board, and current price momentum leaves short-term trading outlook in favor of Greenback losses.
The final revision to Third Quarter US GDP growth could force some sharp short-term swings in the US currency, while late-week Personal Income and Spending as well as PCE Deflator results may affect inflation and employment expectations.
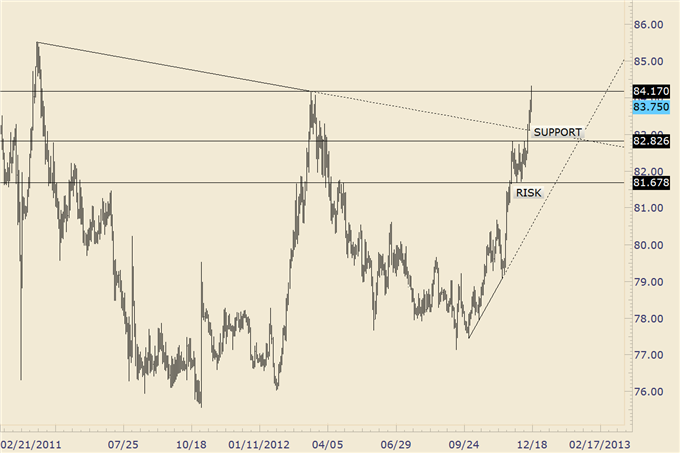
The USD/JPY gapped sharply higher at the open of the trading week after Shinzo Abe reclaimed the position of prime minister as his LDP party put in a commanding at the weekend’s general election. Some pullback to former resistance levels is now expected.
DailyFX Senior Technical Strategist Jamie Saettele says [I]“Nimble short term traders may wish to trade from the short side towards 8283 USDJPY (resistance is now 8391). I’ll be looking for USDJPY longs below 8283.”[/I]
The ratio of long to short positions in the USDJPY stands at 1.43 as approximately 59% of traders are long. Yesterday the ratio was 1.30; 57% of open positions were long.
We use our SSI as a contrarian indicator to price action, and the fact that the majority of traders are long gives signal that the USDJPY may continue lower.
[B]Time of release:[/B] 12/19/2012 9:30 GMT, 4:30 EST
[B]Primary Pair Impact:[/B] GBP/USD
[I]The Bank of England (BoE) Minutes to be released Wednesday morning may reinforce a bullish outlook for the British Pound as the central bank softens its dovish tone for monetary policy, and the fresh batch of central bank rhetoric may trigger a short-term rally in the GBPUSD as market participants scale back bet for more quantitative easing.[/I]
[U][B]Potential Price Targets For The Policy Statement[/B][/U]
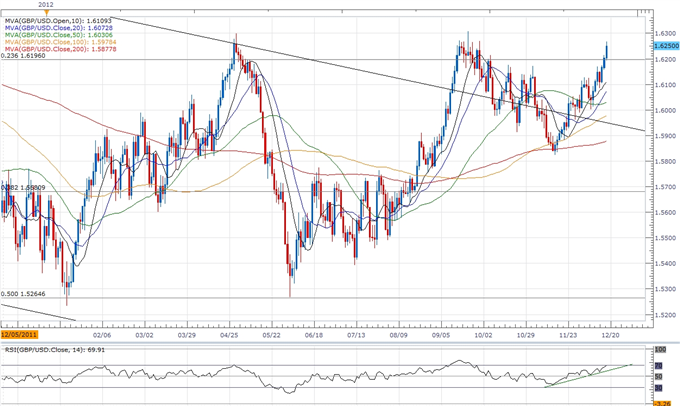
The BoE Minutes may spark a run at the September high (1.6308) should the central bank talk down speculation for more QE, and we may see the GBPUSD trade a fresh yearly highs ahead of the New Year as interest rate expectations pick up.
However, the pound-dollar may struggle to hold above the 23.6% Fibonacci retracement from the 2009 low to high around 1.6200 if we see the central bank show a greater willingness to expand its balance sheet further, and the GBPUSD may face a sharp reversal as it remains capped around the 1.6300 figure.