The Bank of Japan’s last monetary policy announcement of the year coming out tonight (Thursday in Japan) takes on greater importance because of the recent election of Shinzo Abe as Prime Minister. The new premier is expected to pressure the BoJ to implement an unlimited asset purchase program to stimulate the economy.
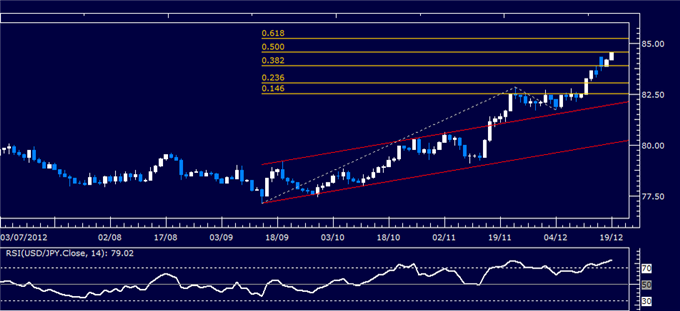
Daily Chart - Created Using FXCM Marketscope 2.0
The would have the effect of decreasing the value of the yen relative to other currencies including the US Dollar. Currently, USD/JPY prices are testing resistance at 84.54, the 50% Fibonacci expansion, with a confirmed break higher exposing the 61.8% level at 85.14. Near-term support is at 83.83, the 38.2% expansion. A drop below that targets the 23.6% Fib at 83.01.
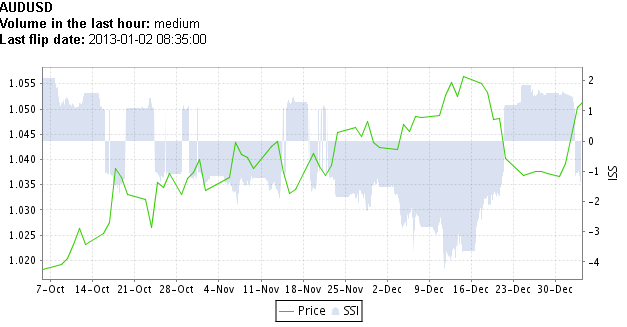
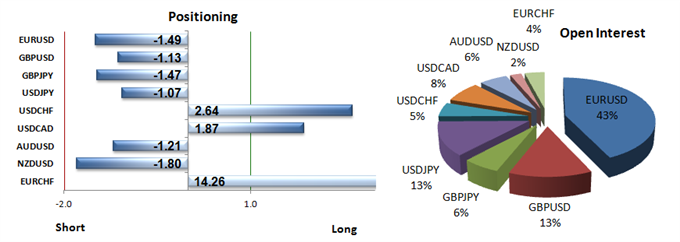
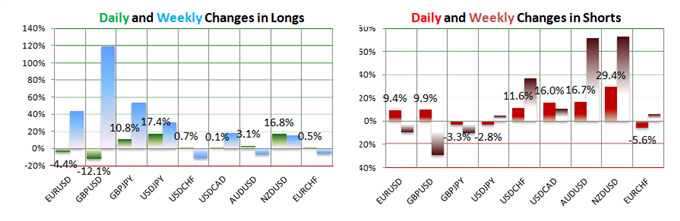
There’s more to the Speculative Sentiment Index (SSI) than simply the bullish or bearish signal it gives based on whether traders are net short or net long. You can also get a signal from the relative change in the positioning of traders. Short term traders can use this info to take positions fading the long term trend. Long term traders can also look to these inflection points to take some profits or potentially add to their position on a retracement.
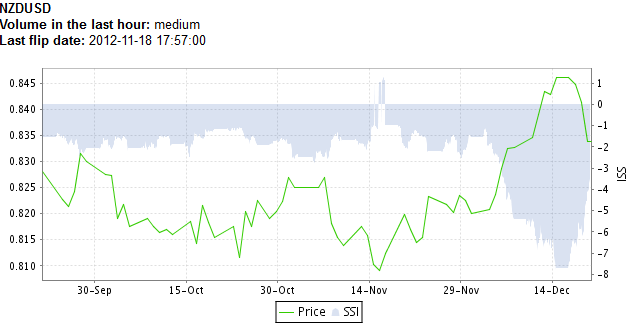
For example, traders have been net short NZD/USD since November 18th. You can see from the chart above that this has coincided with the gains in the pair over the past 30 days confirming SSI’s usefulness as a contrarian indicator. However as you can see from the information below, there has been a significant change in the percentage of short positions over the last 24 hours.
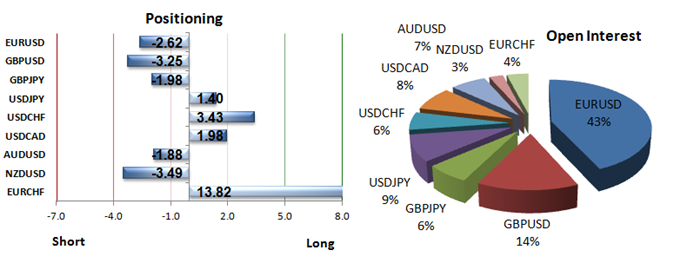
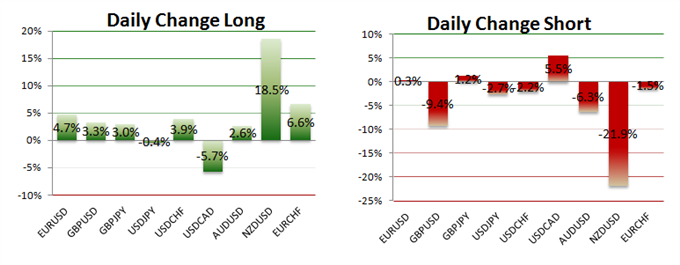
The ratio of long to short positions in the NZDUSD stands at -3.49 as approximately 22% of traders are long. Yesterday the ratio was -5.29; 16% of open positions were long. In detail, long positions are 18.5% higher than yesterday and 20.0% above levels seen last week. Short positions are 21.9% lower than yesterday and 34.4% below levels seen last week. Open interest is 15.5% lower than yesterday and 0.0% above its monthly average.
We use our SSI as a contrarian indicator to price action, and the fact that the majority of traders are short gives signal that the NZDUSD may continue higher, however, since SSI is not as negative as it used to be, this could indicate that in the short term there may be some consolidation or retracement before the long term trend resumes.
Great stuff here. Is there a link for finding out more about the SSI like more trade examples or step by step instructions on how to implement this into a strategy. Just trying to get a better understanding of how to take advantage of this awesome tool.
Thanks
Hi DT,
DailyFX analyst David Rodriguez explains how to use SSI in more detail in the video below.

In terms of implementing SSI, several of the SSI-based strategies from DailyFXplus.com are available as Expert Advisors at the FXCM App Store.
Happy New Year!
Jason
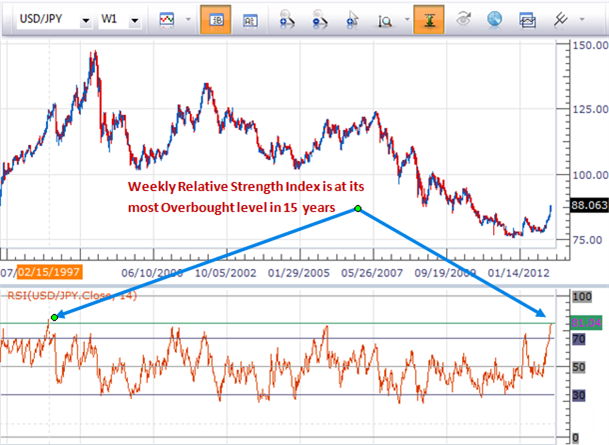
As we begin the new year, there are some signs that USD/JPY could sell off.
[B]USD/JPY Weekly[/B]
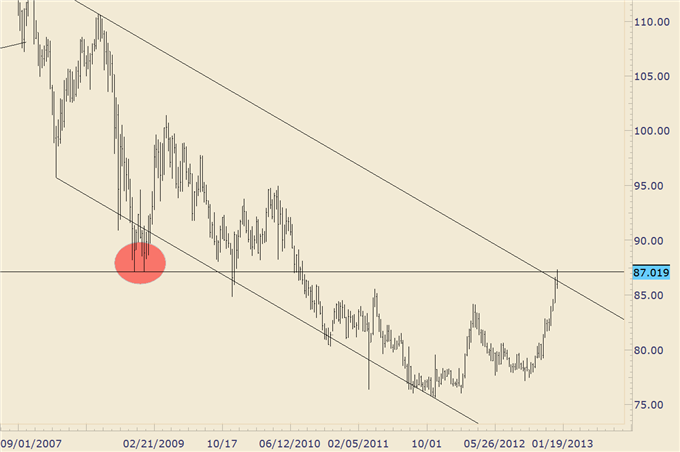
The pair is currently testing resistance from late 2008 / early 2009 lows.
[B]USD/JPY Daily[/B]
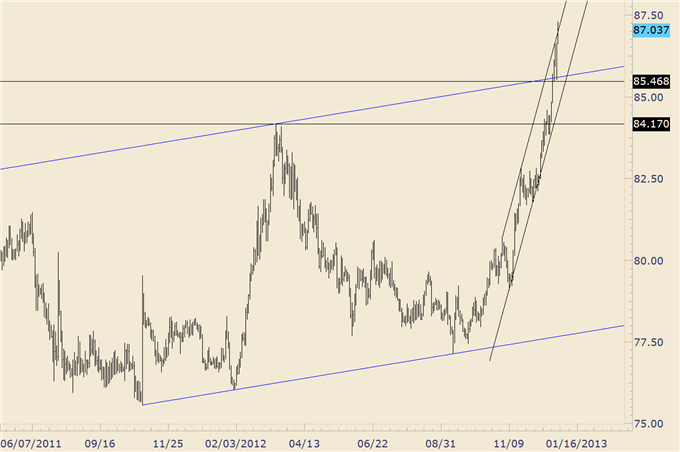
There is also a sharp channel resistance on the daily chart.
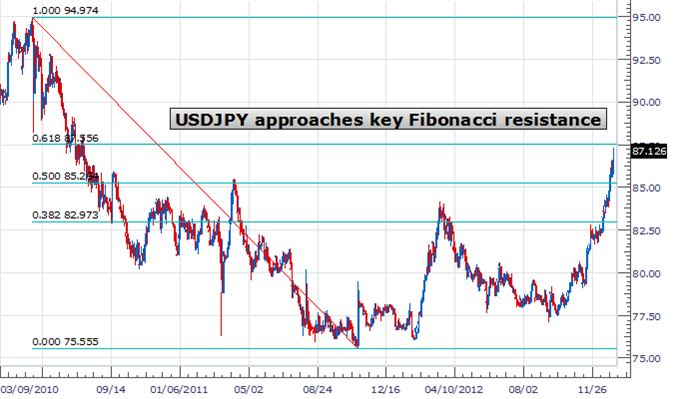
USD/JPY is also approaching 87.56, which is the 61.8% retracement level of a multi-year decline.
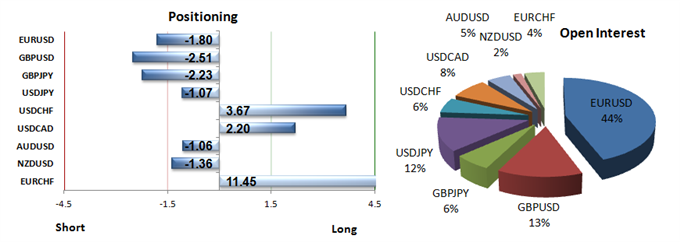
It is worth noting that SSI is bullish at -1.07 if only slightly.
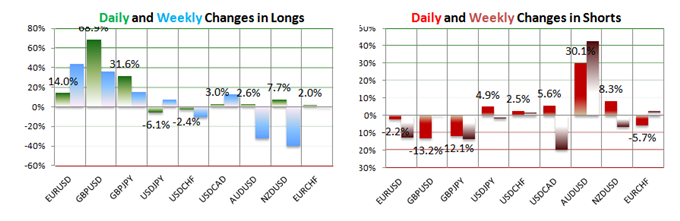
The latest readings from the Speculative Sentiment Index (SSI) show that traders have flipped from being long AUD/USD to being short the pair. Since SSI is a contrarian indicator, this change is a bullish signal for the Australian Dollar going into tomorrow’s key Non-Farm Payrolls report.
The ratio of long to short positions in the AUDUSD stands at -1.34 as 43% of traders are long. Yesterday the ratio was -1.06; 49% of open positions were long.
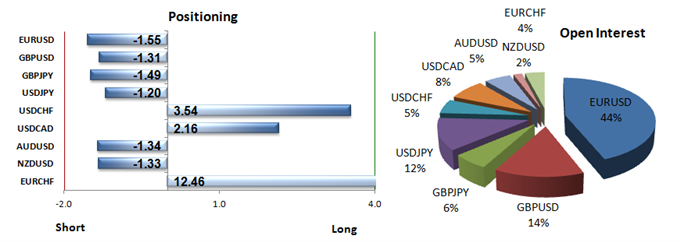
Short positions are 30.1% higher than yesterday and 42.7% above levels seen last week. Open interest is 16.8% higher than yesterday and 24.7% below its monthly average.
SSI’s usefulness as a contrarian indicator has been confirmed once again by the recent gains in USD/JPY. This has coincided with the recent period in which traders have been net short the pair. However, a key divergence in the latest SSI readings warns that an important turning point is could be near.
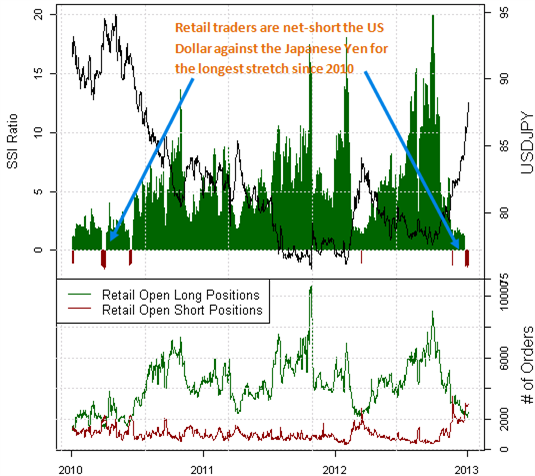
The pair has hit fresh highs but total retail short positions have actually fallen.
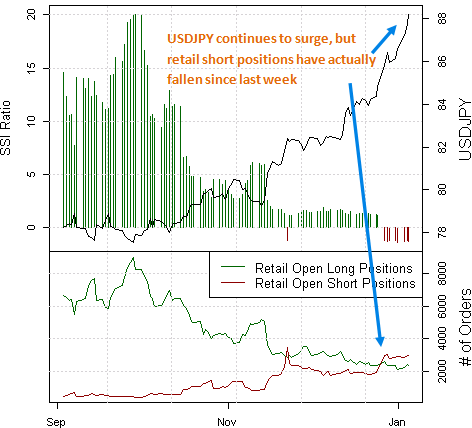
When the price rises and traders cut back on short positions, this can often mean the price is near an important reversal.
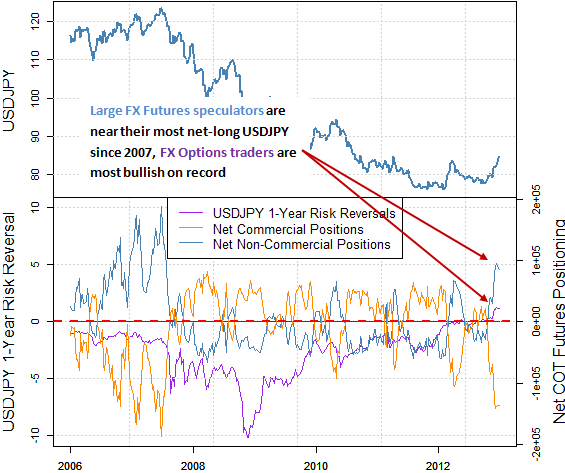
Combined with potential sentiment extremes seen through Forex Futures and Options markets, the risk of market turnaround is quite high.
According to the CFTC Commitment of Traders report, large speculative futures traders are now their most net-short the Japanese Yen (long USDJPY) since the pair traded near key long-term peaks in 2007.

The latest readings from the Speculative Sentiment Index (SSI) on DailyFXplus.com indicate that traders are once again net short GBP/USD. Since SSI is a contrarian indicator, this change could indicate that the pair could continue higher.
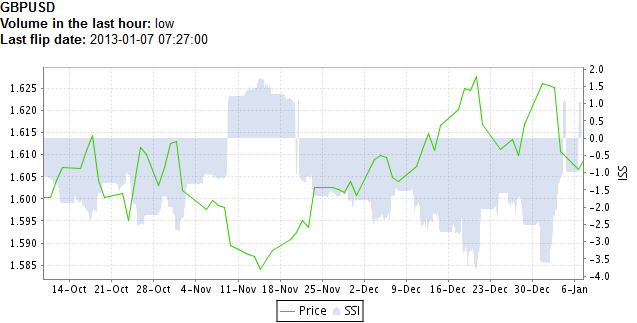
The ratio of long to short positions in the GBPUSD stands at -1.13 as 47% of traders are long. Yesterday the ratio was 1.10; 52% of open positions were long. Long positions are 12.1% lower than yesterday and 119.1% above levels seen last week.
Short positions are 9.9% higher than yesterday and 29.3% below levels seen last week. Open interest is 1.6% lower than yesterday and 7.9% below its monthly average.
[B]On Thursday at 12:00 GMT, the Bank of England rate decision will be announced.[/B]
While the central bank is expected to maintain its current policy of low rates for the time being, we may see the committee start to discuss a tentative exit strategy as the fundamental outlook for the UK improves. This could present a potential buying opportunity.
[B][U]Potential Price Targets For The Rate Decision[/U][/B]
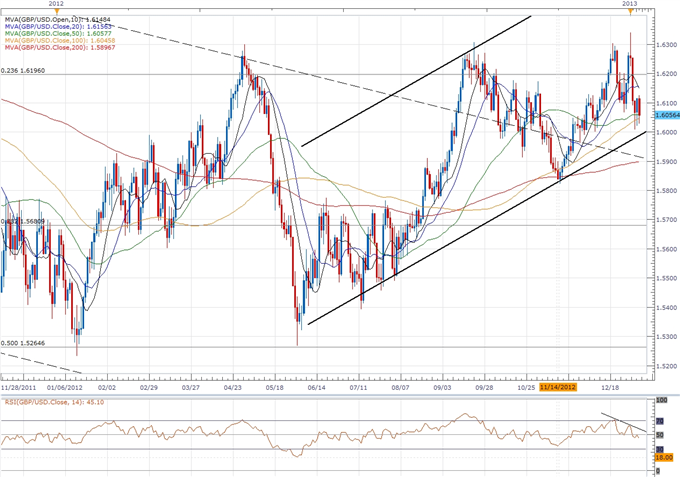
[I][B]“We would need to hear a more hawkish tone from the BoE to pave the way for a long British Pound trade,” according to currency analyst David Song.[/B][/I]
He provides details on how to trade this event in his article on DailyFX.com.
An amusing rumor that has been making the internet rounds over the past few days is the idea that the US Treasury might issue a trillion-dollar platinum commemorative coin and then “sell” it to the Federal Reserve as a way to raise money and avoid hitting the debt ceiling.

Photograph by Tomohiro Ohsumi/Bloomberg
Here’s a link to the article on Bloomberg in case you haven’t already heard the story. While the platinum dollar coin may be the stuff of fantasy, the US government’s budget problems are very real.
David Rodriguez of DailyFX.com had this to say:
[B][I]It was during debt ceiling negotiations in August, 2011 that Standard and Poor’s downgraded the sovereign rating of the US Government. Stock markets sold off sharply as a result and the US Dollar actually rallied against all major counterparts except the Japanese Yen.
Similar acrimony in negotiations could cause similar uncertainty through February, and it will be critical to watch the next developments in debt negotiations.[/I][/B]
For more information regarding the outlook for the US Dollar, you can check out DailyFX.com section on the Dow Jones FXCM US Dollar Index (Ticker: USDOLLAR).
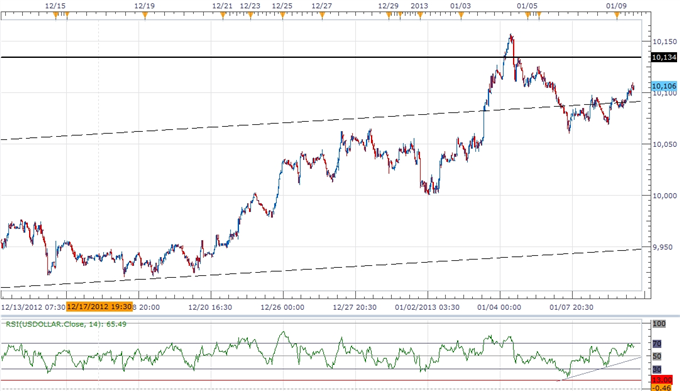
The Dow Jones FXCM US Dollar Index (Ticker: USDOLLAR) closed firm on the day and right at mentioned resistance. Like the EURUSD, price is in limbo at these levels. The first day of the month (and year) low at 9990 is the pivot for swing traders (above is bullish).
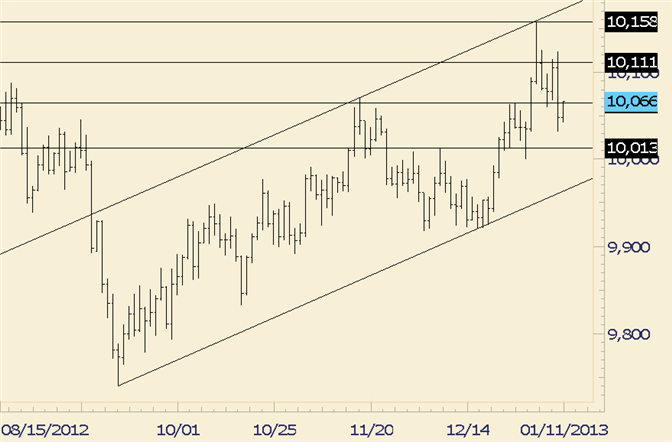
Chart Prepared by Jamie Saettele at DailyFX.com
The drop into former congestion presents an opportunity to get long against 9990.
[B]Key Levels:[/B] 9960, 9990, 10013, 10124, 10157 and 10236.
[B]‘Has the bond market topped?’ isn’t as important a question however as ‘at what level would the market inflict the most pain on the most participants?’ In other words, when do increasing yields (declining bond and note values) become a story and what would the implications be for the FX market?[/B]
Technical Strategist Jamie Saettele addressed this question in an article on DailyFX.com today about the correlation between interest rates (specifically yields on 10-year Treasuries) and currencies (specifically USD/JPY).
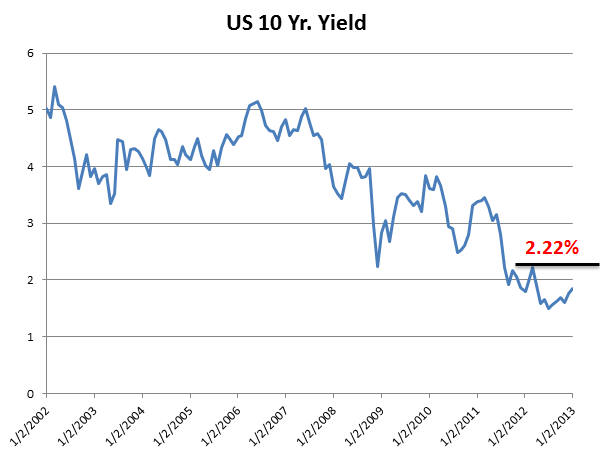
It is well documented that currency markets ebb and flow with the change in yield differentials (the cost of money). Decreasing yield differentials in recent years, especially in 2012, can be cited for the lack of trends in USD based pairs.
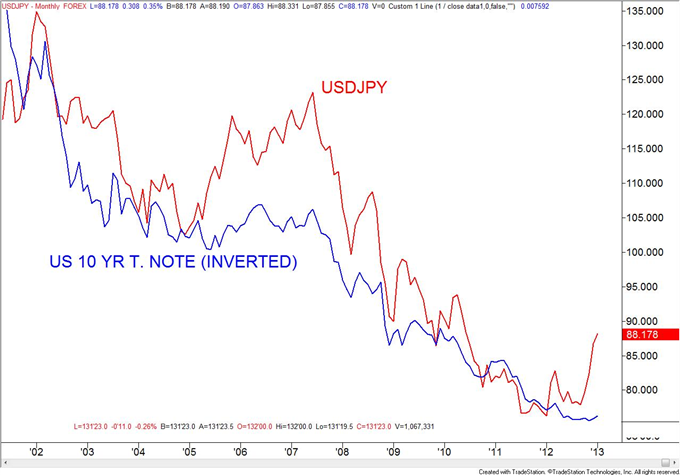
If yields continue to tick higher, then expect trends to reappear. The USDJPY has already broken out but increasing US yields would intensify the move and shift focus to the 2010 and 2009 highs at 95.00 and 101.44.
Fed Chairman Ben Bernanke is due to speak at 4pm ET at the University of Michigan on the outlook for monetary policy, the global recovery, and the long-term challenges facing the US. He is likely to remind traders of the impact of US austerity on global growth as debates over the “debt ceiling” and the “sequester” loom which could cause commodity prices to fall.
[B]WTI Crude Oil (NY Close): $93.56 // -0.26 // -0.28%[/B]
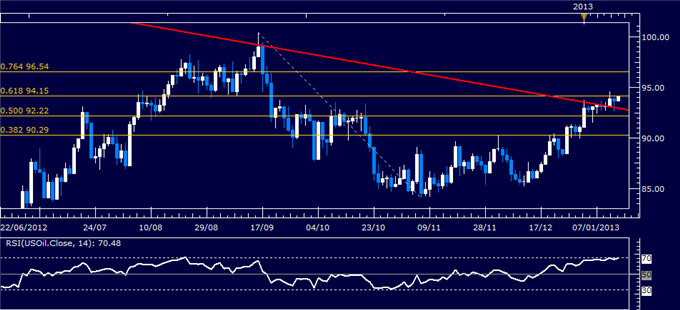
US Oil prices took out trend line resistance set from late February, initially exposing the 61.8% Fibonacci retracement at 94.15. A break above that targets the 76.4% level at 96.54. The trend line (now at 92.93) has been recast as support, with a drop back below that aiming for the 50% level at 92.22.
[B]Spot Gold (NY Close): $1662.80 // -12.65 // -0.76%[/B]
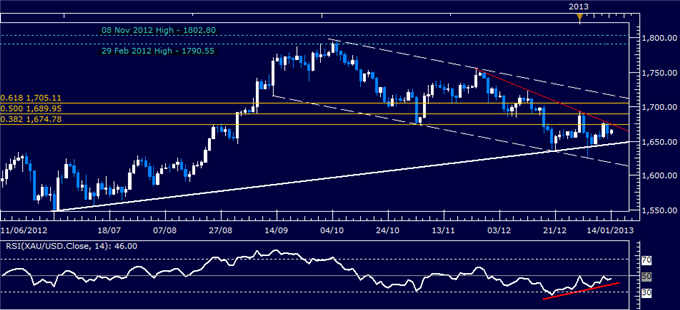
Prices are wedged between a major rising trend line set from mid-May 2012 and the 38.2% Fibonacci retracement at 1674.78. Resistance is reinforced by a falling trend line established from the November 23 2012 high. A break higher exposes the 50% Fib at 1689.95. Alternatively, a push below the trend line (now at 1645.35) targets the channel bottom at 1617.73.
You can see the complete outlook for commodities including silver and copper on DailyFX.com.
The latest data from the Commitments of Traders reports for the Euro show that noncommercial traders, i.e., speculators, have flipped from net long to net short, while commercial traders, i.e., hedgers, are net long. This is a bullish signal indicating that the Euro could continue higher.

That is because noncommercials tend to be wrong and commercials tend to be right when it comes to picking tops and bottoms. The COT Index data below show the difference between net speculative positioning and net commercial positioning for the Euro.
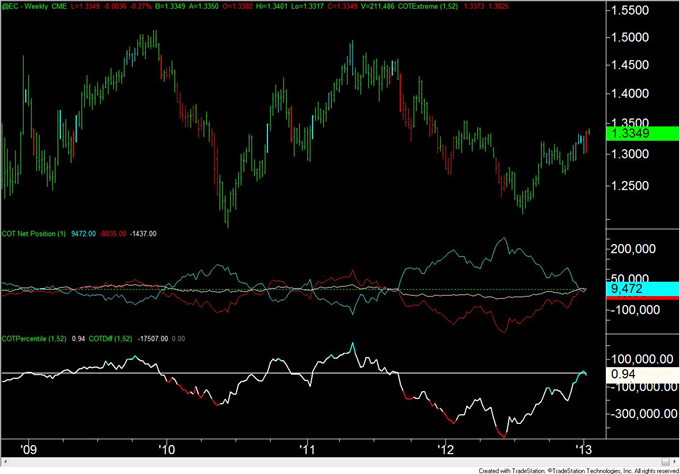
Chart from article by Jamie Saettele on DailyFX.com
A light blue colored bar indicates that the difference in positioning is the greatest it has been in 52 weeks (bullish) with speculators selling and commercials buying. A light red colored bar indicates that the difference in positioning is the greatest it has been in 52 weeks (bearish) with speculators buying and commercials selling. Crosses above and below 0 are in bold.
Hi guys, I have got this B4theStreet market intelligence as a bonus package from Beaned trading platform…did anyone use that ? I got it for Xmas days, don’t know if that actions is still on …
The Australian economy is expected to add another 4.5K jobs in December and the ongoing improvement in the labor market may spark a bullish reaction in the AUDSD as it dampens speculation for additional monetary support.
[B]What’s Expected:[/B]
Time of release: [B]01/16/2013 0:30 GMT, 19:30 EST[/B]
Primary Pair Impact: [B]AUD/USD[/B]
Expected: 4.5K
Previous: 13.9KK
DailyFX Forecast: 0.0K to 10.0K
[B][U]Potential Price Targets For The Release[/U][/B]
Although the AUDUSD continues to trade within the upward trending channel dating back to October, the relative strength index remains capped by the 67 figure, and the pair could be carving out a lower top just below the 1.0600 figure as the oscillator comes off of overbought territory.
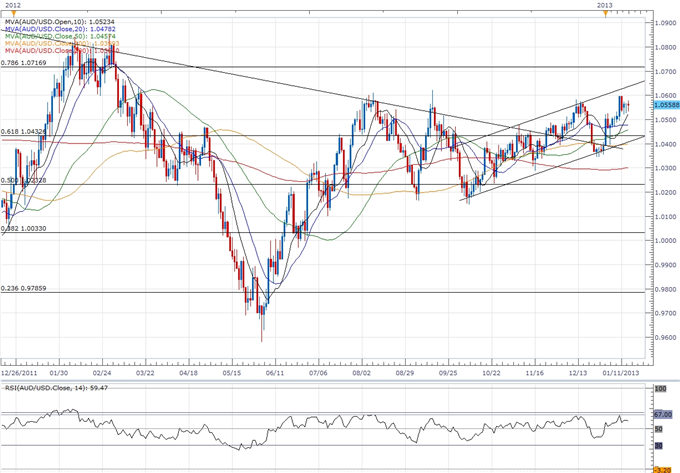
In turn, we may see the aussie-dollar fall back towards the 61.8% Fibonacci retracement from the 2011 high to low around 1.0430, but we may see the high-yielding currency threaten the bullish trend carried over from the previous year should the employment report fuel bets for more monetary support.
Currency Analyst David Song provides insight on how to trade this event risk in his article on DailyFX.com.
The Australian dollar shed 0.49 percent as employment in the $1T economy unexpectedly weakened 5.5K in December. The recent pullback in the AUDUSD may turn into a larger move to the downside as the fundamental outlook for Australia remains titled to the downside.

A critical point noted in a recent article on DailyFX.com is that the Australian Dollar’s yield advantage is falling fast, and in fact it may soon relinquish its title of highest in the G10 to the New Zealand Dollar. According to Credit Suisse overnight index swaps, market participants still see the RBA lowering the cash rate by nearly 50bp over the next 12-months.
According to our DailyFX PLUS System Trading Signals, an important jump in forex market volatility warns that major currency pairs may see big moves in the week ahead.
DailyFX 1-Month Volatility Index versus S&P 500 Volatility Index (VIX) 2011 - Present
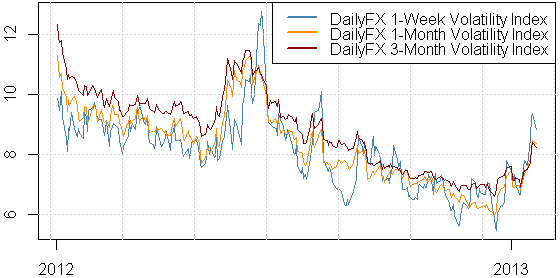
Such market conditions tend to favor volatility-friendly Breakout strategies across most pairs. The table below indicates which currencies seem more or less likely to see major volatility.
DailyFX Individual Currency Pair Conditions and Trading Strategy Bias

It’s possible to automate trades from the Breakout strategies on DailyFX PLUS using the Breakout 2 EA at FXCMapps.com.
DailyFX Strategist Jamie Saettele believes the Australian dollar is poised to break out.
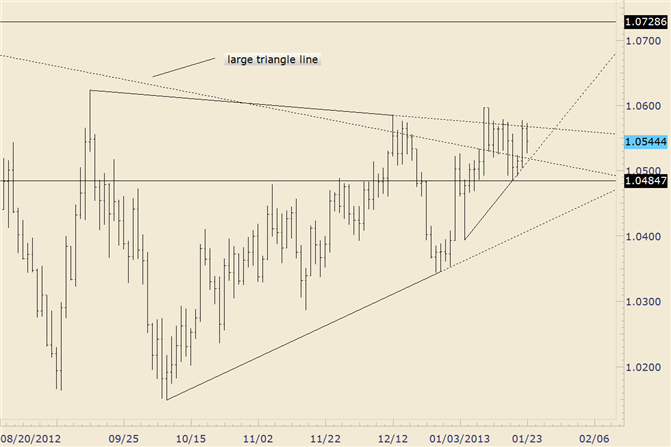
Triangles have formed from the July 2011 high (price is above that triangle line now) and the September 2012 high. Predicting the direction of the break is never a good idea but the latest pivot low can be used as a point of reference. In other words, stay bullish for an upside break as long as price is above 1.0485.
You can see Jamie Saettele’s key technical levels for AUD/USD on DailyFX.com.
