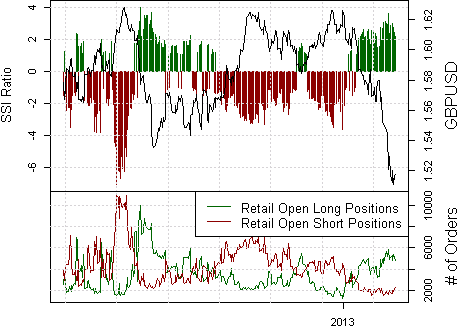
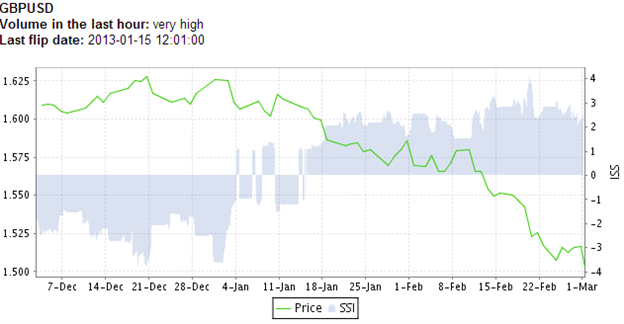
The latest readings from the Speculative Sentiment Index (SSI) on DailyFX PLUS show that long positions in GBP/USD are at their highest levels in 8 months. This is despite the fact that GBP/USD has been steadily dropping in value since traders last flipped from being net short to net long on January 15th.
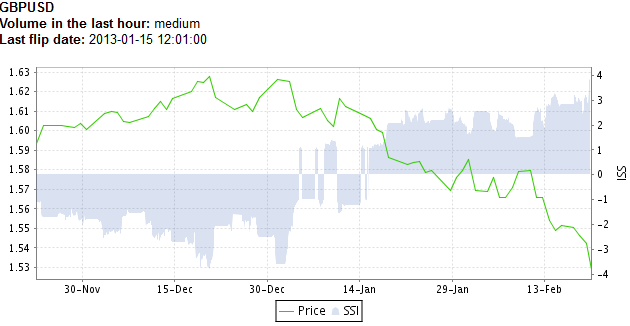
This is a strong confirmation of SSI’s usefulness as a contrarian indicator and could indicate further declines. The ratio of long to short positions in the GBP/USD stands at 4.03 as 80% of traders are long.

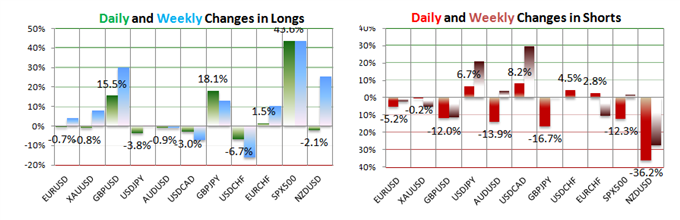
Yesterday the ratio was 3.07; 75% of open positions were long. Long positions are 15.5% higher than yesterday and 30.0% above levels seen last week. Short positions are 12.0% lower than yesterday and 11.2% below levels seen last week.
Open interest is 8.7% higher than yesterday and 17.9% above its monthly average.

As a result both the Breakout2 and Momentum2 trading signals are selling GBP/USD. Both of these signals are available as automated strategies at FXCMapps.com.
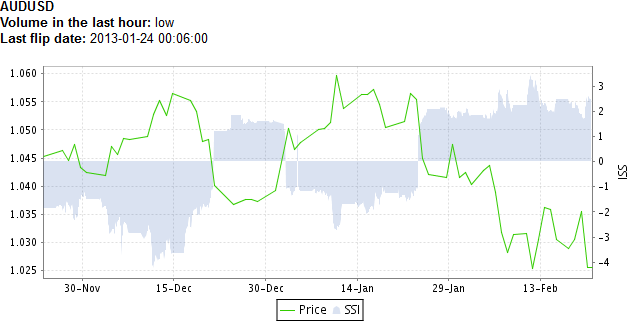
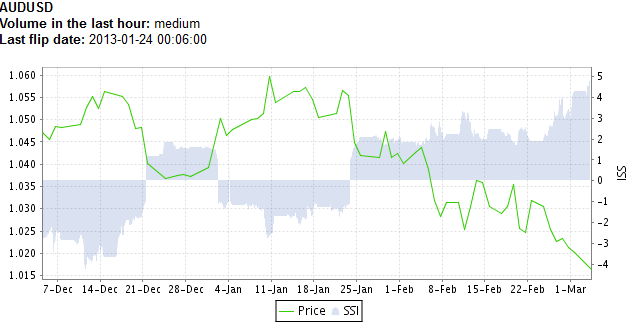
The ratio of long to short positions in the AUD/USD stands at 2.35 as 70% of traders are long. Yesterday the ratio was 2.18; 69% of open positions were long. We use our SSI as a contrarian indicator to price action, and the fact that the majority of traders are long gives signal that the AUDUSD may continue lower.
Long positions are 12.0% higher than yesterday and 14.1% above levels seen last week. Short positions are 3.8% higher than yesterday and 5.9% below levels seen last week. Open interest is 9.4% higher than yesterday and 19.8% above its monthly average. The trading crowd has grown further net-long from yesterday and last week.
The combination of current sentiment and recent changes gives a further bearish trading bias. It’s no wonder then that three DailyFX PLUS Trading Signals – Range1, Breakout2 and Momentum2 – are all giving indications to sell AUD/USD.

All three of these signals are available as automated strategies at FXCMapps.com.
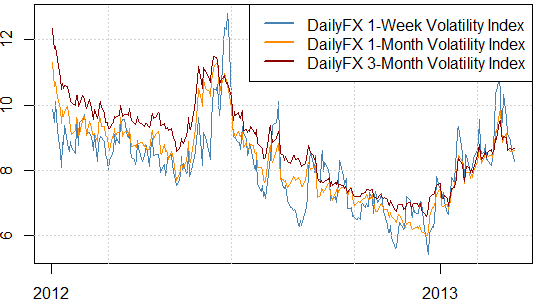
A continued surge in forex market volatility still favors high-volatility Breakout-trading strategies, and current market conditions continue to favor major moves across the board.
DailyFX Forex Volatility Indices
DailyFX Volatility Indices trade at significant peaks as FX options traders bet on strong currency moves across the board. Volatility expectations are now at their highest levels since Euro Zone crises hit fever pitch in June/July of last year.
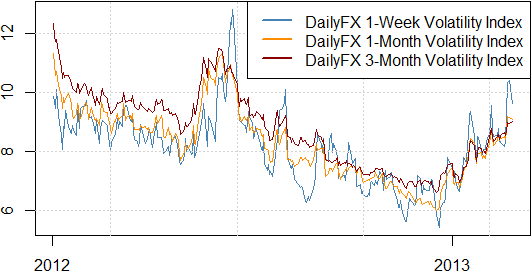
Volatility tends to cluster; if last week was volatile, there is a strong likelihood that this week will be similar. Strong moves may continue through the foreseeable future until we have concrete signs of market calm. The table below shows strategy preferences broken down by currency pair.
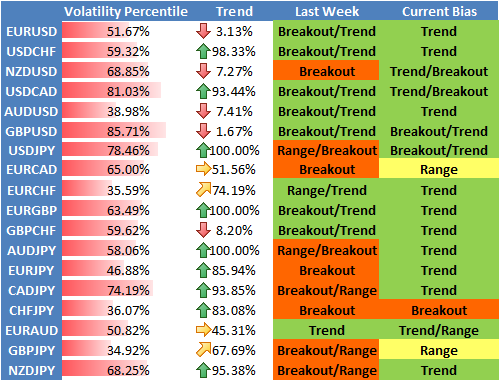
DailyFX Individual Currency Pair Conditions and Trading Strategy Bias
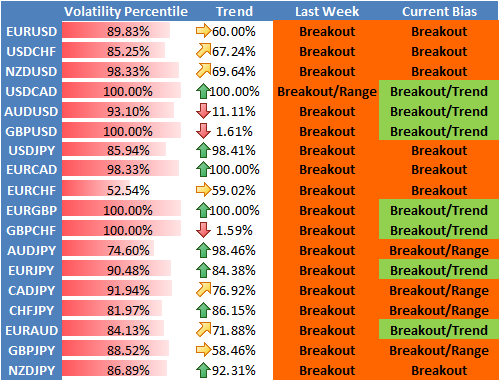
Past performance is not necessarily indicative of future results, but the DailyFX trend-based and breakout sentiment-based trading strategies have historically done well in similar market conditions.

Past performance is not necessarily indicative of future results.
Dollar volatility seems especially likely against the fast-falling British Pound, while continued breakdowns in the Japanese Yen warn of further weakness.

Past performance is not necessarily indicative of future results.
There’s more info on how to automate the high-volatility breakout trading system at DailyFX.com.
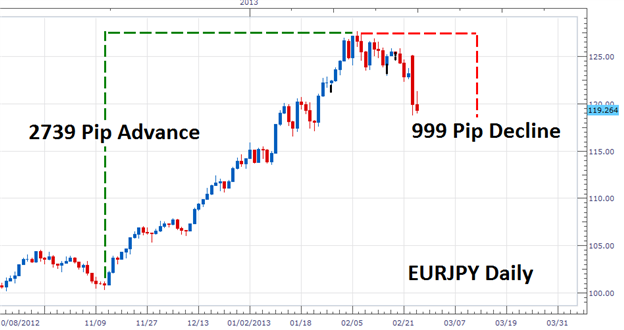
In the EUR/JPY daily chart shown below, we can see price advancing 2739 pips, but then sharply declining 999 pips. The Aroon indicator is showing signs that the uptrend may resume.
[I]Past performance is not necessarily indicative of future results.[/I]
The indicator itself (shown below) is derived from two lines, Aroon Up and Aroon Down. If Aroon Down is above Aroon Up the trend is considered down with price expected to go lower. The opposite holds true if Aroon Up is residing above Aroon down. The indicator is available free for both the FXCM Trading Station and MetaTrader (MT4) at FXCMapps.com.

[I]Past performance is not necessarily indicative of future results.[/I]
Looking at the readings for EUR/JPY below, we can see that even though the pair has declined over the past two weeks, the Aroon Up line still resides above the Aroon Down line. Knowing this, trend traders can look for a price bounce as the trend is expected to continue.

[I]Past performance is not necessarily indicative of future results.[/I]
One way to trade this retracement is to enter on a market swing or even a breakout to higher highs. Regardless of the strategy taken, traders should keep an eye on the Aroon indicator. If the Aroon Down crosses over the Aroon Up this may signal an end to current the EUR/JPY uptrend and a change to market direction.
Crude oil and gold are retracing as markets digest recent volatility but worries about the impact of looming US “sequester” spending cuts may reboot risk aversion.
[B]WTI Crude Oil (NY Close): $92.63 // -0.48 // -0.52%[/B]
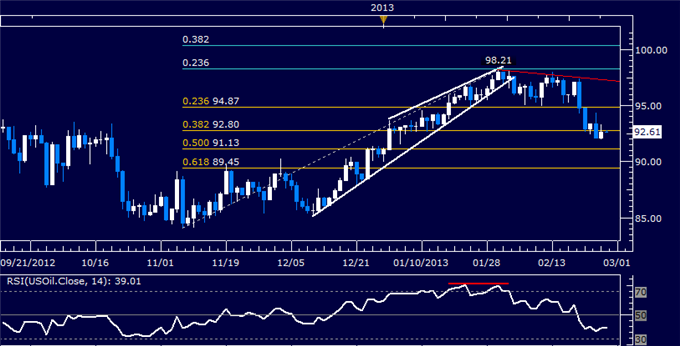
[I]Past performance is not necessarily indicative of future results.[/I]
Prices broke below support at 92.80, the 38.2% Fibonacci retracement, exposing the 50.0% level at 91.13. A further break beneath that aims for the 61.8% Fib at 89.45. The 92.80 mark has been recast as near-term resistance, with a turn back above that eyeing the 23.6% retracement at 94.87.
[B]Spot Gold (NY Close): $1613.85 // +20.35 // +1.28%[/B]

[I]Past performance is not necessarily indicative of future results.[/I]
Prices broke above resistance at 1609.40, the 38.2% Fibonacci retracement, exposing the 50% level at 1626.20. A further push above that aims for the 61.8% Fib at 1643.00. The 1609.40 mark has been recast as near-term support, with a reversal back beneath that eyeing the 23.6% retracement at 1588.61.
You can see more of today’s charts on commodities including silver and copper at DailyFX.com.
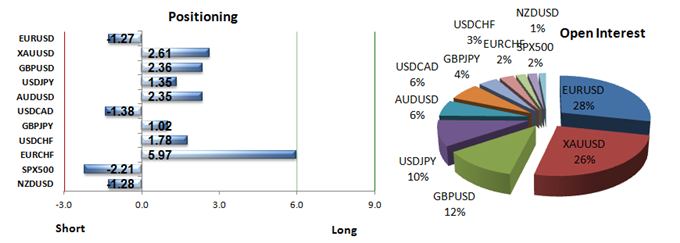
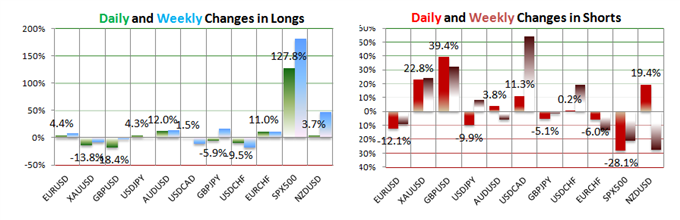
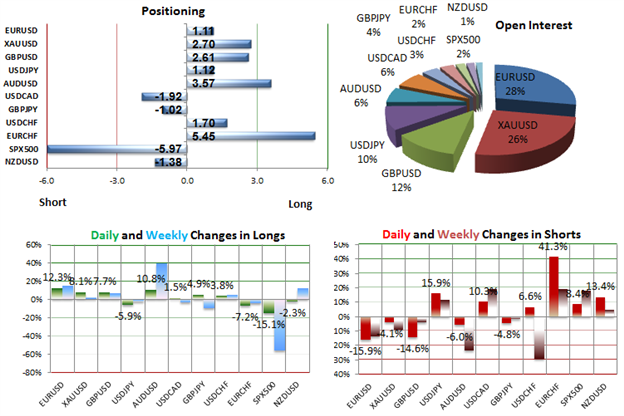
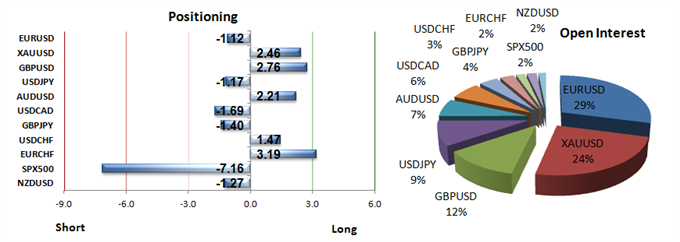
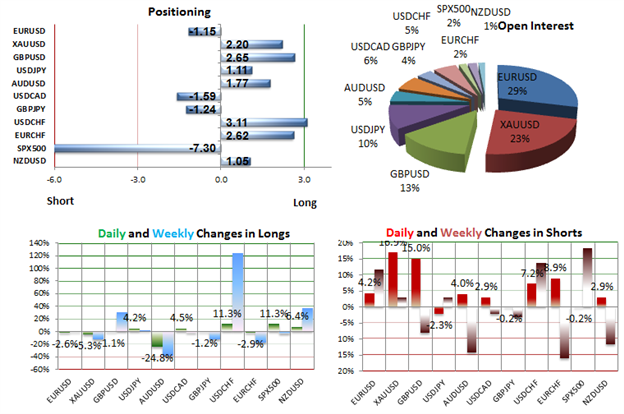
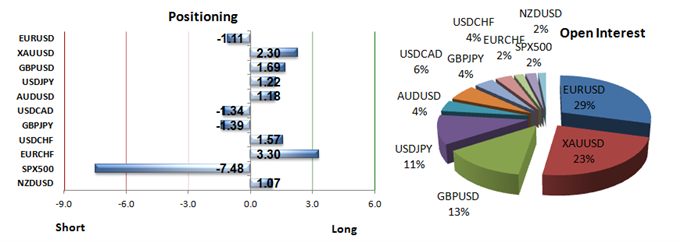
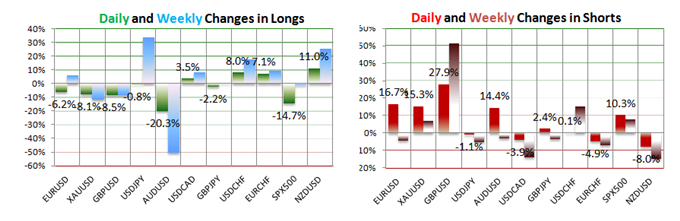
Retail forex speculators have aggressively sold the Japanese Yen and US Dollar against the Australian Dollar and British Pound.
[B]Weekly Summary of Forex Trader Sentiment and Changes in Positioning[/B]
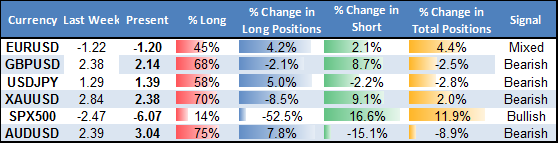
In particular, the latest readings of the Speculative Sentiment Index (SSI) show that the British Pound may hit fresh lows. Our volatility-friendly Breakout strategy has been particularly effective at selling GBPUSD weakness, while the trend-following Momentum1 and Momentum2 systems have likewise latched onto GBP declines.
[I]Past performance is not necessarily indicative of future results.[/I]
While past performance is not necessarily indicative of future results, these systems may continue to do well as crowds show few signs of capitulation, and indeed the strong downtrend has yet to show any real signs of letting up.
DailyFX trading strategies can be automated using programs available at FXCMapps.com
In my previous post, I highlighted how the DailyFX sentiment-based strategies favored GBP weakness and USD strength. That play has worked out well today as the US dollar has surged against the British Pound, Euro and Yen after strong February data.
[ul]
[li][B]U. of Michigan Confidence (FEB) > 77.6 versus 76.3 expected, up from 76.3 previously
[/li][li]ISM Manufacturing (FEB) > 54.2 versus 52.5 expected, up from 53.1 previously
[/li][li]ISM Prices Paid (FEB) > 61.5 versus 57.0 expected, up from 56.5 previously[/B]
[/li][/ul]
Following the economic releases, GBP/USD fell from 1.5014 to as low as 1.4984, before rebounding to 1.5007 (this is the lowest exchange rate since July 2010). Selling persists amid weak UK data, a dovish and divided Bank of England, and the United Kingdom losing its revered ‘Aaa’ rating. Further downside is expected.
SSI: The ratio of long to short positions in the GBPUSD stands at 2.61 as 72% of traders are long. Yesterday the ratio was 2.07; 67% of open positions were long. Long positions are 7.7% higher than yesterday and 7.0% above levels seen last week. Short positions are 14.6% lower than yesterday and 4.3% below levels seen last week.
The combination of current sentiment and recent changes gives a further bearish trading bias. While past performance is not necessarily indicative of future results, the sentiment-based strategies on DailyFX PLUS have been particularly effective at selling GBP/USD weakness. These trading strategies can be automated using programs available at FXCMapps.com
The Australian Dolla may come under increased pressure over the next 24-hours of trading as the Reserve Bank of Australia (RBA) keeps the door open to lower borrowing costs further.

Although the RBA is widely expected to keep the benchmark interest rate at 3.00%, Governor Glenn Stevens may sound more dovish this time around as the $1T economy faces a slowing recovery.
[B][I]According to Credit Suisse overnight index swaps, market participants now see the RBA lowering the cash rate by 50bp over the next 12-months, and the recent weakness in the AUDUSD should gather pace over the near to medium-term as interest rate expectations surrounding the RBA deteriorate.[/I][/B]
The latest readings from the DailyFX Speculative Sentiment Index (SSI) show that crowds continue to buy Aussie weakness.
The ratio of long to short positions in the AUDUSD stands at 4.12 as 80% of traders are long. Yesterday the ratio was 3.94; 80% of open positions were long. Long positions are 9.2% higher than yesterday and 44.2% above levels seen last week. Short positions are 4.3% higher than yesterday and 20.0% below levels seen last week.
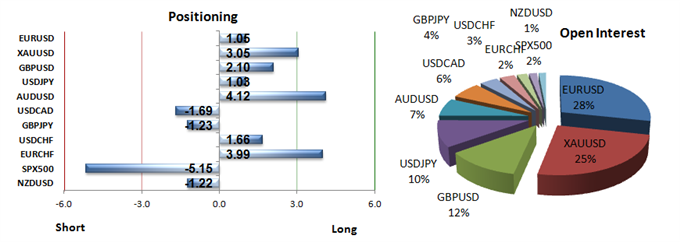
The combination of current sentiment and recent changes gives a further bearish trading bias. As a result the trading signals on DailyFX PLUS are selling the Australian dollar.

The DailyFX trading signals are available as automated strategies at FXCMapps.com
The Dow Jones Industrial Average has traded to record highs, and forex correlations suggest this may help the Euro recover against the resurgent US Dollar (ticker: USDOLLAR).
Correlation between the
Dow Jones Industrial Average
and the Euro/US Dollar
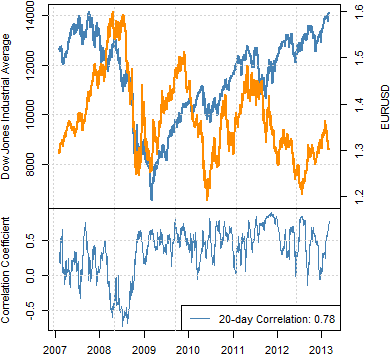
Past performance is not necessarily indicative of future results.
Dow Jones Industrial Average (lhs)
Euro/US Dollar Exchange Rate (rhs)
The correlation between the Dow Jones Industrial Average and the Euro/US Dollar exchange rate trades near its highest levels in a year, and a surging DJIA bodes well for the otherwise-downtrodden EUR/USD.
Forex Correlations Summary

Dow strength suggests that the Euro may likewise prove resilient, and the technical forecast for the Euro on DailyFX.com favors strength above the key $1.30 mark.
Crude oil and gold may rise on improving risk appetite and swelling inflation expectations if a supportive Fed Beige Book survey boosts US recovery hopes.
[B]WTI Crude Oil (NY Close): $90.82 // +0.70 // +0.78%[/B]
Prices are retesting support-turned-resistance at 91.13, the 50% Fibonacci retracement. A break above this barrier targets the 38.2 % level at 92.80.
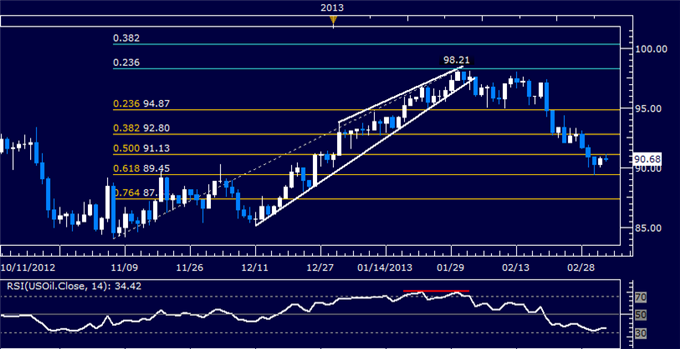
Near-term support is at 89.45, the 61.8% Fib, with a drop below that aiming for the 76.4% retracement at 87.38.
[B]Spot Gold (NY Close): $1575.50 // +1.73 // +0.11%[/B]
Prices are testing support at 1570.37, the 38.2% Fibonacci expansion. Near-term resistance is at 1589.36, the 23.6% level, with a break above that aiming for the February 26 high at 1620.09.
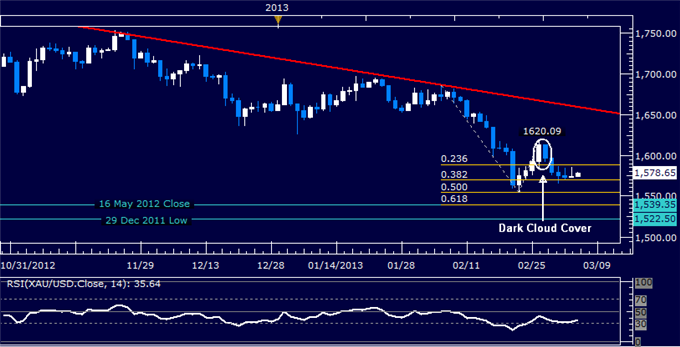
Alternatively, a break downward initially aims for the 61.8% Fib at 1554.62.
You can see more of today’s technicals on commodities including silver and copper at DailyFX.com.
Breakout Opportunities is a breakout strategy that aims to catch the significant moves that typically happen when currencies break through technical support or resistance. The Breakout Opportunities system has just bought USD/JPY and recommends entering this trade at any price between 94.345 and 94.802.

A stop loss has been set at the 24-hour low of 93.509 and a profit target has been set at the 1 Day ATR level at 95.337. The system will move the stop to the next 24-hour low every time that 24-hour low is higher than the previous 24-hour low.
The signal was issued because the USDJPY has broken its 24-hour high while our Speculative Sentiment Index was at -1.17, suggesting that the USDJPY may have further to rise. The SSI Breakout strategy tends to work well in volatile market conditions, generally when the DailyFX Volatility Percentage in a pair is above 75%. The volatility in USDJPY at the time of signal is 2%.
More Breakout signals from DailyFX are available as automated strategies at FXCMapps.com
The US economy continues to show signs of further momentum, with a very impressive February labor market report beneath its belt.
[I][B]Dow Jones FXCM Dollar Index (Ticker: USDOLLAR) 5-minute Chart: March 8, 2013[/B]
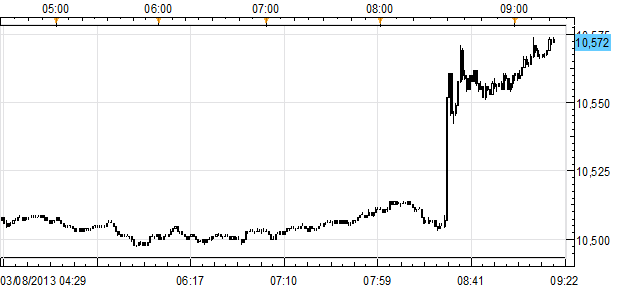
Past performance is not necessariliy indicative of future results.[/I]
Following the release, the USDOLLAR rallied from a near-session high of 10507 to a fresh session high at 10573, at the time this report was written. This is also a new yearly high.
[B]THE TAKEAWAY: USD Change in Nonfarm Payrolls (FEB) > +236K versus +165K expected, from +119K (revised from +157K) > USD Unemployment Rate (FEB) > 7.7% versus 7.9%, from 7.9% > USDOLLAR BULLISH[/B]
All the subcomponents of the USDOLLAR confirmed bullishness for the greenback, and the AUD/USD fell from 1.0275 and is currently trading around 1.0220.

[I]Past performance is not necessarily indicative of future results.[/I]
The Breakout2 strategy on DailyFX PLUS is currently signalling to short AUD/USD. DailyFX trading signals are available as automated strategies at FXCMapps.com
Forex market volatility has fallen from recent highs as the US Dollar (ticker: USDOLLAR) consolidates versus the Euro and other major counterparts. Yet the broader USD uptrend suggests that trend-following trades remain attractive in the week ahead.
The Dollar has been especially strong against the downtrodden Japanese Yen, and USD/JPY may continue to hit fresh peaks alongside other Yen crosses. Prices broke above resistance at 94.98, a barrier marked by the 23.6% Fibonacci expansion.
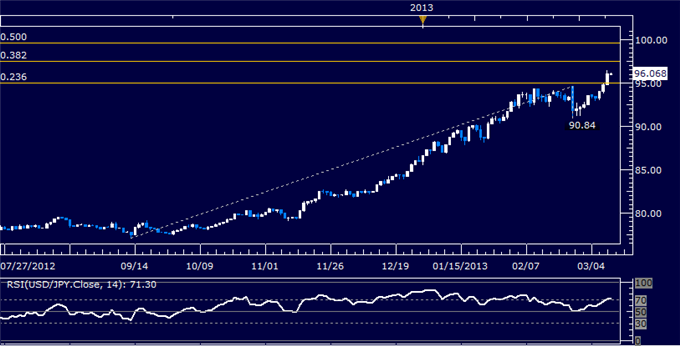
Buyers are now targeting the 38.2% level at 97.52. The 94.98 level has been recast as support. A drop back below that broadly aims for the February 25 low at 90.84.
While past performance is not necessarily indicative of future results, the trend-following trading signals (Momentum1 and Momentum2) on DailyFX PLUS could do well across particular currency pairs, while the breakout trading strategy (Breakout2) has become comparatively less attractive on the drop in vols.
DailyFX trading signals are available as automated strategies at FXCMapps.com
The British Pound set a new 2.5-year low as UK manufacturing production and industrial production disappointed expectations. Industrial production fell 1.2% in January, worse than expectations for a 0.1% rise in production and down from December’s 1.1% rise.
[I][B]GBPUSD Daily: March 12, 2013[/B]
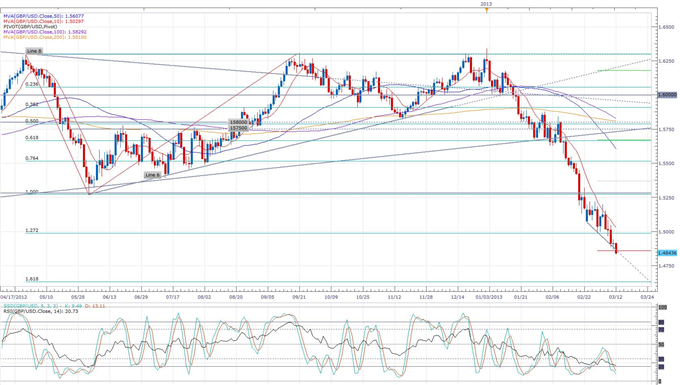
Past performance is not necessarily indicative of future results.[/I]
The latest reading on the Speculative Sentiment Index (SSI) for GBP/USD is at 2.65, meaning that there are 2.65 long positions for every 1 short position. We use SSI as a contrarian indicator to price action, and the fact that the majority of traders are long gives signal that the GBP/USD may continue lower.
Support might be seen at 1.4630, by the 161.8% Fibonacci expansion of declines starting in April 2012, and resistance may be seen by the key 1.5000 figure.
[I]Past performance is not necessarily indicative of future results.[/I]

The SSI-based trading signals on DailyFX PLUS are currently shorting GBP/USD. These signals are available as automated strategies at FXCMapps.com
[I]Mixed SSI signals can help to indicate a short-term pause or retracement of a longer term trend. Such signals are currently present for SPX 500 which tracks the S&P 500 index.[/I]
While the strongly negative SSI for SPX 500 suggests that the uptrend in US stocks could continue, the ratio of short to long positions is not as extreme as it has been over the past week when US stocks have been making new highs.

The ratio of long to short positions in the SPX500 stands at -6.20 as 14% of traders are long. Yesterday the ratio was -7.04; 12% of open positions were long. Long positions are 8.0% higher than yesterday and 32.3% above levels seen last week. Short positions are 5.0% lower than yesterday and 1.9% below levels seen last week.

These mixed SSI signals could present an opportunity to swing traders who want to play the market from the short side, and to long term bulls who are looking for an opportunity to buy at lower levels on a retracement.
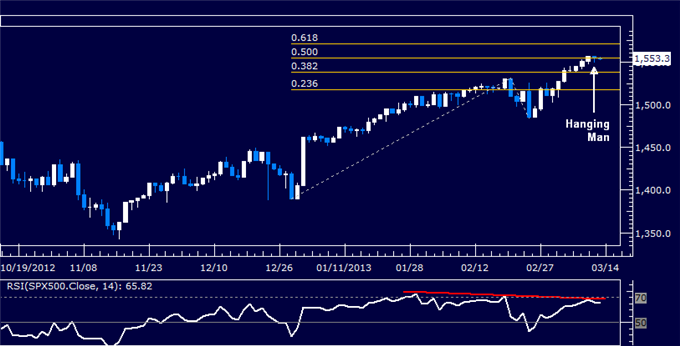
Negative RSI divergence and a Hanging Man candlestick have emerged as other warning signs hinting a correction lower may be ahead. A break back below 1554.60 initially aims for the 38.2% Fib at 1537.90.
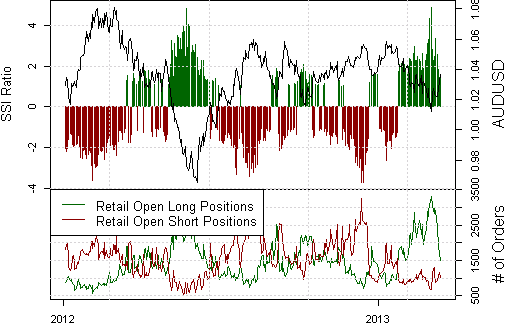
The ratio of long to short positions in the AUD.USD stands at 1.18 as 54% of traders are long. The trading crowd has grown less net-long from yesterday and last week.
[I]Past performance is not necessarily indicative of future results.[/I]
While SSI is primarily used as a contrarian indicator to price action, this reduction in long positions could point to a short-term upside for the pair.
Yesterday the ratio was 1.69; 63% of open positions were long. Long positions are 20.3% lower than yesterday and 50.8% below levels seen last week.
Short positions are 14.4% higher than yesterday and 3.1% below levels seen last week. Open interest is 7.4% lower than yesterday and 27.9% below its monthly average.
[I]Past performance is not necessarily indicative of future results.[/I]

The SSI-based Momentum2 trading signal on DailyFX PLUS is currently long AUD/USD. This signal is available as an automated strategy at FXCMapps.com
The FOMC interest rate decision highlights the biggest event risk for the following week, and an improved outlook for the world’s largest economy may see a growing number of Fed officials scale back their willingness to expand the balance sheet further as the recovery gradually gathers pace.
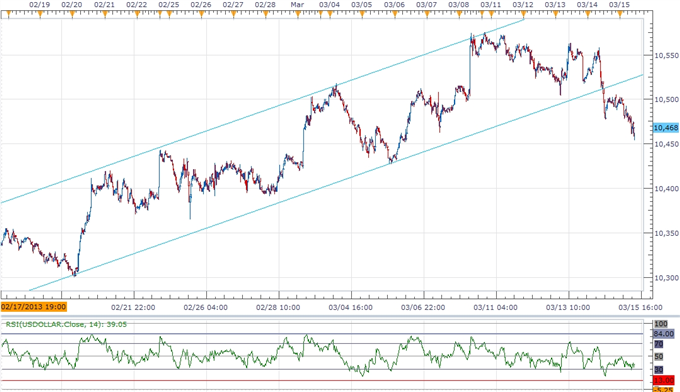
Nevertheless, the Dow Jones-FXCM U.S. Dollar Index (Ticker: USDollar) remains 0.30 percent lower from the open after tagging a low of 10,462, and the pullback from the March high (10,576) should turn into a larger correction as the greenback fails to maintain the upward trending channel carried over from earlier this year. In turn, we may see the reserve currency fall back towards the 10,400 figure to test for psychological support.

The Tidal Shift Strategy has just recommends selling USD/JPY between 94.85 and 95.328. The 14-period Average True Range on a daily chart is 0.191, so the stop loss has been set at 96.044. This stop loss order is a trailing stop that will move down as the market moves down. There is no profit target for this strategy. We expect to be closed by the stop loss.
[ul]
[li][B]Entry: 94.85 - 95.328
[/li][li]Limit: N/A
[/li][li]Stop Loss: 96.044[/B]
[/li][/ul]
Tidal Shift is a DailyFX trend trading signal on that aims to catch shifts in trend using trader sentiment as an indicator. DailyFX trading signals are available as automated strategies at FXCMapps.com
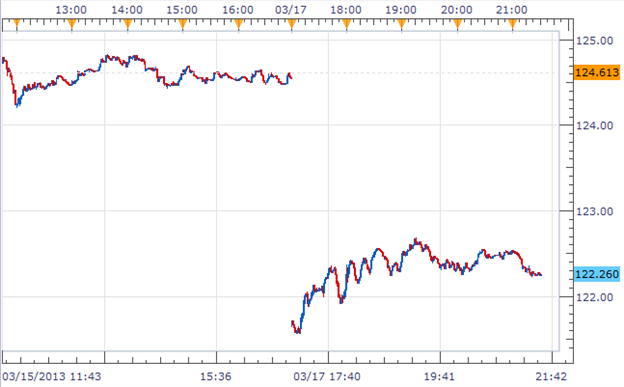
The Euro is down against all of its major counterparts as financial markets digest the terms of a bailout deal for Cyprus emerged over the weekend, but the biggest drop was versus the Japanese yen as fears of bank in Europe have sparked risk aversion.
[B]EUR/JPY 1 Minute Chart[/B]
[I]Past performance is not necessarily indicative of future results.[/I]
While Cyprus is a relatively small economy – comprising just 0.2 percent of overall Eurozone GDP – the level of worry evident across the markets likely reflects fears of the precedent that EU officials are setting. The worst-case scenario is a bank a run across the Eurozone as depositors scramble to move their capital out the region to avoid being caught in a Cyprus-like scenario.
[I]Past performance is not necessarily indicative of future results.[/I]

The Range1 system from the trading signals on DailyFX PLUS has just shorted EUR/JPY at 123.21 with a trailing stop at 124.73. DailyFX trading signals are available as automated strategies at FXCMapps.com
As the Cypriot parliament continues to postpone their vote on the unprecedented measure, former Cyprus central bank governor Athanasios Orphanides warned that the bank deposit levy ‘only makes the economic climate worse,’ and argued that the EU should consider alternative measures as the tax on savings would have ‘catastrophic’ consequences for the euro-area.

EUR/USD is trading at its 200-day SMA which also coincides with the 50% retracement level back to the low of 1.2042 set last July. SSI remains fairly neutral for the pair. If support holds here, the pair may test the range-bound price action seen during the previous week as it has yet to completely fill-in the gap from the Sunday open. A break of support here could see the Euro targeting the 61.8% fib level at 1.2679.
For the latest developments out of Cyprus, you can get updates from the DailyFX real time news feed.
So Cyprus rejected an EU bailout deal that included a controversial levy on bank deposits which – if approved – threatened to spark bank runs around the Eurozone periphery. Crude oil is on the upswing as risk sentiment firmed.
[B]USOil (WTI Crude) Daily Chart[/B]

Prices reversed lower to test support at the 92.00 figure, marked by the 23.6% Fibonacci expansion. A break beneath that exposes the 38.2% level at 90.73. Near-term resistance is at 94.07, the March 19 swing high.
[B]The spotlight shifts to the US and
the FOMC policy announcement.[/B]

Even a familiarly dovish FOMC outing seems to have scope to jolt traders back to the realization that the Federal Reserve is in no hurry to taper asset purchases. That is likely to be supportive for gold prices.
[B]XAU/USD (Spot Gold) Daily Chart[/B]
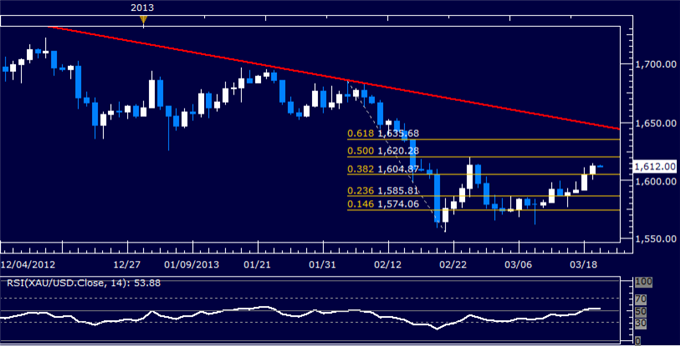
Prices continued higher as expected after edging above resistance at 1604.87, the 38.2% Fibonacci retracement, will buyers eyeing the 50% level at 1620.28. A further push above that aims for the 61.8% Fib at 1635.68. The 1604.87 mark has been recast support, with a turn back beneath that eyeing the 23.6% retracement at 1585.81.