The Euro weakened to 1.2878 as manufacturing and service-based activity in Europe contracted at a faster pace in March, while the European Central Bank (ECB) warned it would ‘maintain the current level of Emergency Liquidity Assistance, ELA, until Monday, 25 March 2013’ for Cyprus as the region struggles to secure a bailout.

The single currency has since rebounded to trade just above the 1.2900 level currently, but the negative headlines coming out the euro-area continue to cast a bearish outlook for the EUR/USD. If we see a close below to the 200-Day SMA (1.2867), there could be a more meaningful move towards the 23.6% Fibonacci retracement from the 2009 high to the 2010 low around 1.2640-50.
This is it’ – the proverbial moment when the fate of global sentiment for the coming weeks and months will be decided. Cypriot parliament members are reconvening today. Tensions are running high. The fate of the country’s inclusion in the Euro-zone could be decided over the course of the next few hours.

[I]Past performance is not necessarily indicative of future results.[/I]
Essentially, there are only two choices: accept the Troika’s demands for the deposit tax in order to unlock the necessary bailout funds required to keep the nation from defaulting; or leave the Euro-zone and face imminent default.

[I]Past performance is not necessarily indicative of future results.[/I]
As is to be expected, there are multiple ways to approach trading this. Of the strategies on DailyFX PLUS, Breakout1 is giving a countertrend signal to buy EUR/USD, while the Range2 strategy is giving a signal to short EUR/JPY. The signals are available as automated strategies at FXCMapps.com
The German electorate, ahead of the September election, will be pleased that Chancellor Merkel held firm despite blustering from Cyprus this week, with €10 billion being contributed from the core, and the rest coming from Cyprus itself. DailyFX analyst Christopher Vecchio is not as impressed:
[B]“If Cypriot savers had to contribute to the bailout of its banks, then why wouldn’t the same measures be forced upon Italian and Spanish savers? Investors in weak financial institutions in peripheral Euro-zone countries are on high alert – so should Euro traders.”[/B]
The headlines of Cyprus’ bailout pushed the EURUSD through the descending TL off of the February 1 and March 15 highs, at 1.2990/300, to its 21-EMA at 1.3042, before failure ensued today.
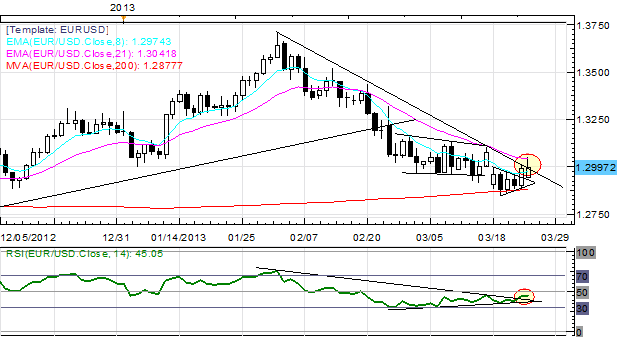
Since the bailout terms do not seem favorable to long-lasting Euro strength, the “top” after the bailout could now be in place. As long as price holds below 1.3085 this week – the trendline off of the highs from late-February/early-March – price action could be consolidating for another drive lower towards 1.2660.
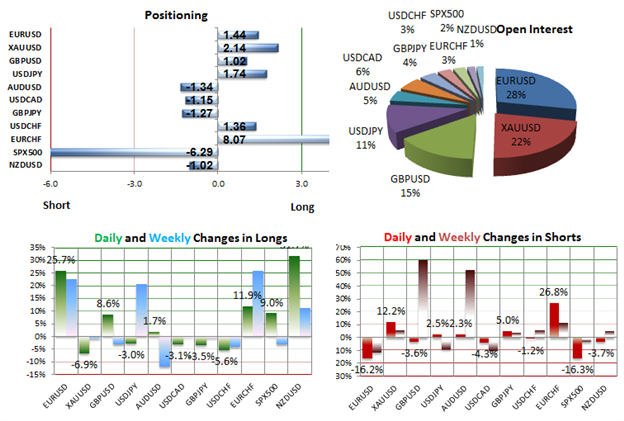
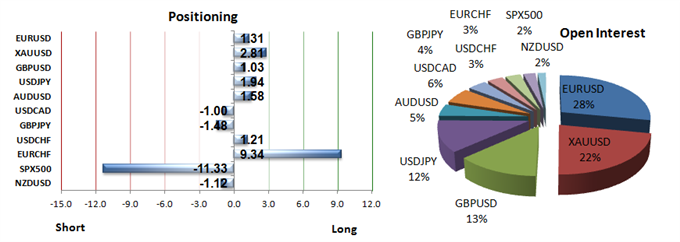
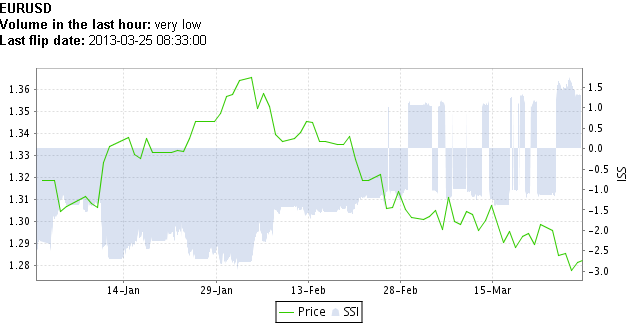
According to the Speculative Sentiment Index (SSI), the trading crowd has flipped from net-short the Euro to net-long from yesterday but unchanged since last week. The combination of current sentiment and recent changes gives a further bearish trading bias to the single currency. The ratio of long to short positions in the EURUSD stands at 1.44 as 59% of traders are long. Yesterday the ratio was -1.04; 49% of open positions were long.
[I]Past performance is not necessarily indicative of future results.[/I]
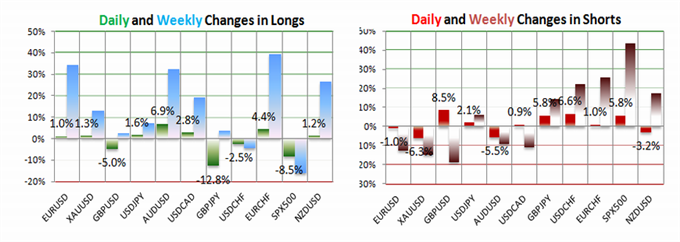
Long positions are 25.7% higher than yesterday and 22.6% above levels seen last week. Short positions are 16.2% lower than yesterday and 11.8% below levels seen last week. Open interest is 4.3% higher than yesterday and 2.8% above its monthly average. We use our SSI as a contrarian indicator to price action, and the fact that the majority of traders are long gives signal that the EURUSD may continue lower.

[I]Past performance is not necessarily indicative of future results.[/I]
The SSI-based DailyFX trading signals are currently shorting the Euro against other major currencies. These signals are available as automated strategies at FXCMapps.com
Yesterday I mentioned that the Speculative Sentiment Index (SSI) was signalling further declines in the Euro. This morning EUR/USD fell to new 2013 lows below 1.2800 after a weak Italian bond auction. The trading crowd has grown further net-long from yesterday and last week.
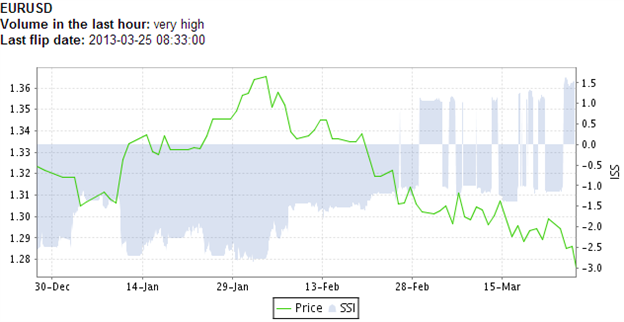
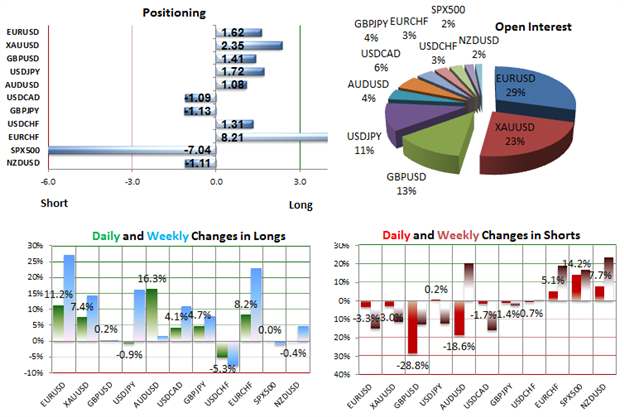
The ratio of long to short positions in the EURUSD stands at 1.62 as 62% of traders are long. Yesterday the ratio was 1.41; 58% of open positions were long. Long positions are 11.2% higher than yesterday and 27.1% above levels seen last week. Short positions are 3.3% lower than yesterday and 15.1% below levels seen last week. Open interest is 5.1% higher than yesterday and 7.1% above its monthly average.
The combination of current sentiment and recent changes gives a further bearish trading bias. Fresh yearly lows were set below 1.2800 at the time of writing, with a clear test of 1.2660/80 (61.8% Fibonacci retracement on July 2012 to February 2013 rally, mid-November swing lows) in focus. A bearish bias holds so long as 1.3085 holds this week.
As the S&P 500 broke its previous all time high of 1,565.15 hit back in 2007, the latest readings from the Speculative Sentiment Index (SSI) show that retail CFD speculators are near their most short the SPX500 contract on record. Since SSI is a contrarian indicator, this favors further strength.

[B][I]“Our retail sentiment data shows that the number of orders short SPX500 outnumber those long by a massive 8.8 to 1 as the contract trades near record-highs. In fact, short interest has gained a further 24 percent since last week, while total longs have fallen 8 percent. There’s obvious risk of a significant correction given impressive advances, but we would warn against joining the crowd as stocks continue pressing to fresh gains.”[/I][/B]
As was to be suspected, it was a slow day in forex with many other markets closed for Good Friday. The Speculative Sentiment Index (SSI) shows that going into the Easter holiday weekend, crowds are shorting the US Dollar against other major currencies. SSI is a contrarian indicator so this could indicate gains for the greenback to start April.
Focusing on EUR/USD, the ratio of long to short positions stands at 1.31 as 57% of traders are long. Yesterday the ratio was 1.28; 56% of open positions were long.
Long positions are 1.0% higher than yesterday and 34.1% above levels seen last week. Short positions are 1.0% lower than yesterday and 12.6% below levels seen last week. Open interest is 0.1% higher than yesterday and 3.1% above its monthly average.
The trading crowd has grown further net-long from yesterday but unchanged since last week. The combination of current sentiment and recent changes gives a further bearish trading bias. SSI-based trading signals are available as automated strategies at FXCMapps.com
It’s shaping up to be a big week for the US Dollar (ticker: USDOLLAR) with critical event risk from the Bank of Japan and the infamous US Nonfarm Payrolls likely to deliver important USD volatility. Our DailyFX Volatility indices have fallen from recent peaks, but 1-week expectations have jumped considerably on a key week of event risk for the US Dollar and Japanese Yen in particular.

[I]Past performance is not necessarily indicative of future results[/I]
Past performance is not necessarily indicative of future results, but conditions seem to favor our volatility-friendly breakout trading strategy for certain JPY pairs, while our trend-following systems seem poised to do well on the US Dollar against major counterparts.

[I]Past performance is not necessarily indicative of future results[/I]
These trading strategies from DailyFX PLUS are available as automated strategies at FXCMapps.com
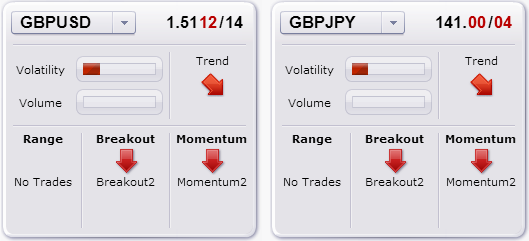
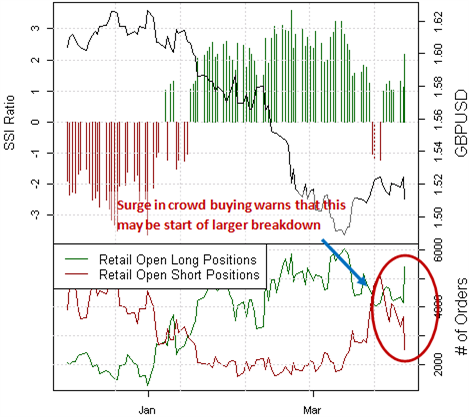
The DailyFX PLUS Trading Strategies have sold aggressively into the day’s British Pound breakdown. The key question is simple: is the start of a much larger sell-off? Our high-volatility Breakout2 trading system has had a fair deal of success trading the British Pound in recent months—particularly against the Japanese Yen.
[I]Past performance is not necessarily indicative of future results.[/I]
Past performance is not necessarily indicative of future results, but the fact that Breakout trading has been successful in the GBP does give us reason to believe that the current trades have a fair chance at success. The purely sentiment-based Momentum2 strategy can claim similar outperformance in British Pound pairs through recent trading, and said system has likewise sold into the GBPUSD and GBPJPY turn lower.
[I]Past performance is not necessarily indicative of future results.[/I]
The aggressive build in retail long positions in the British Pound warns against buying this dip. It’s certainly possible that the trading crowd might indeed catch the falling knife on this sell-off, but the severity with which the pair has fallen warns against it.
These trading signals from DailyFX PLUS are available as automated strategies at FXCMapps.com
Last week DailyFX analyst Christopher Vecchio said: [B]"The failed run up to the 1.5285/375 region suggests that the rally in the GBP/USD seen the past few weeks may be nothing more than short covering and asset reallocation, rather than traders taking up new positions amid an improved interest rate outlook for the UK.

“Price has fallen back below the 8- and 21-EMAs after a rejection at a critical RSI level of 55…A potential Bearish Rising Wedge has developed (clearer on the 4H timeframe, which would suggest a retest of the lows near 1.4830. The pattern is valid so long as 1.5260/65 holds to the upside.”[/B]
The GBP/USD price has since moved lower, initiating both the Double Top and Bearish Rising Wedge patterns. We use our SSI as a contrarian indicator to price action, and the fact that the majority of traders are long gives signal that the GBPUSD may continue lower.
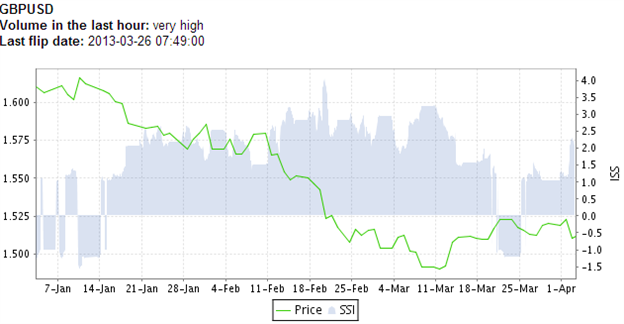
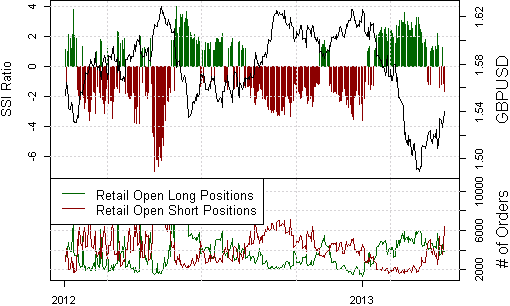
The trading crowd has grown further net-long from yesterday and last week. The combination of current sentiment and recent changes gives a further bearish trading bias. The ratio of long to short positions in the GBPUSD stands at 1.79 as 64% of traders are long.
Yesterday the ratio was 1.42; 59% of open positions were long. Long positions are 15.5% higher than yesterday and 11.4% above levels seen last week. Short positions are 8.1% lower than yesterday and 10.6% below levels seen last week. Open interest is 5.8% higher than yesterday and 1.1% above its monthly average.
SSI-based trading signals are available as automated strategies at FXCMapps.com
The Bank of Japan, under the watchful eye of Haruhiko Kuroda, has already made big waves at its first policy meeting. The central bank announced that it would step up its asset purchase pace to ¥7 trillion/month, while simultaneously removing a cap on some bond holdings and a limit on debt maturities.

Three of the four components weakened against the greenback, led by a 3.02 percent decline in the Japanese Yen, and the selloff in the low-yielding currency may gather pace over the near-term as the Bank of Japan (BoJ) increases its effort to achieve the 2 percent target for inflation.

The Dow Jones-FXCM U.S. Dollar Index (Ticker: USDollar) is trading 0.70 percent higher from the open after moving a whopping 223 percent of its average true range, and the greenback may continue to retrace the decline from the previous month and it carves out a higher low around the 10,400 region.
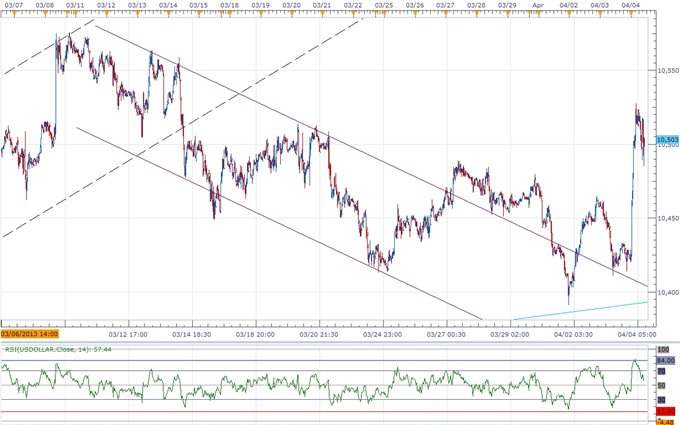
Although we’re looking for a short-term pullback given the overbought signal on the 30-minute relative strength index, we may see the dollar hold steady going into the highly anticipated Non-Farm Payrolls report as the world’s largest economy is expected to add another 190K jobs in March.
No one expected to see a March labor market report of such a poor quality. Literally, not one economist, according to a Bloomberg News survey, forecasted that the US economy would only add +88K jobs last month; the low estimate was +100K.
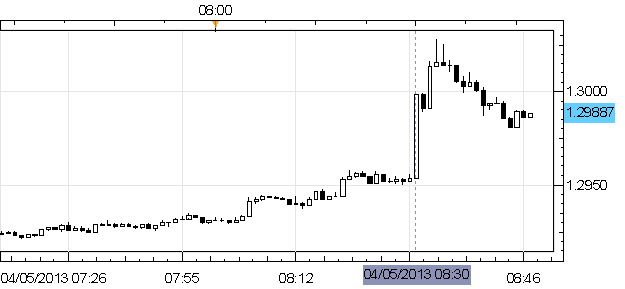
[B]EURUSD 5-minute Chart: April 5, 2013[/B]
[I]Past performance is not necessarily indicative of future results.[/I]
The EUR/USD had the strongest reaction to the data, rallying from near 1.2950 after the release towards 1.3030 in the minutes after. The EUR/USD had the strongest reaction to the data, rallying from near 1.2950 after the release towards 1.3030 in the minutes after.

[I]Past performance is not necessarily indicative of future results.[/I]
The trading signals on DailyFX PLUS based on our Speculative Sentiment Index (SSI) are buying Euros and selling Australian Dollars. These signals are available as automated strategies at FXCMapps.com
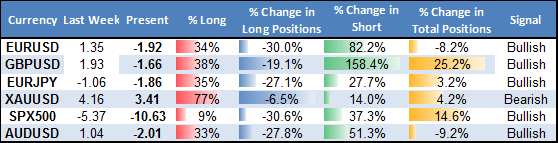
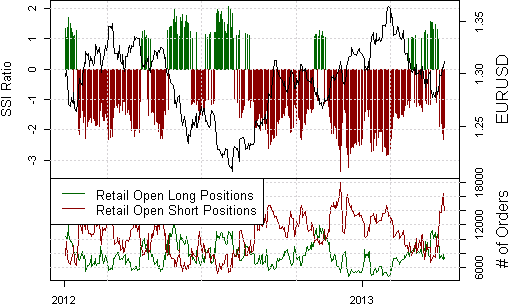
After the abysmal employment number out the US last Friday, traders are more risk averse to start the new week. The latest readings from the Speculative Sentiment Index (SSI) show that the crowd is mostly long USD and short risk-on currencies. With the EUR/USD in particular, the ratio of long to short positions stands at -1.90 as 35% of traders are long.
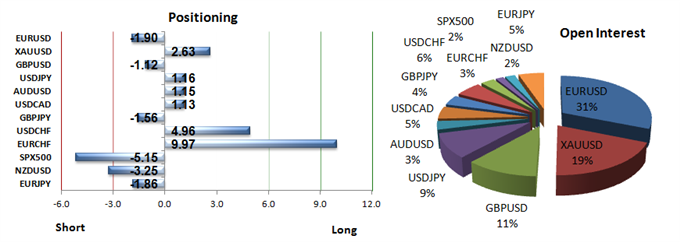
Yesterday the ratio was -1.35; 42% of open positions were long. Long positions are 9.2% lower than yesterday and 26.2% below levels seen last week. Short positions are 27.3% higher than yesterday and 72.3% above levels seen last week.
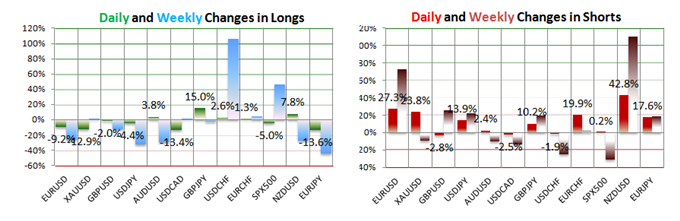
Open interest is 11.8% higher than yesterday and 25.1% above its monthly average. We use our SSI as a contrarian indicator to price action, and the fact that the majority of traders are short gives signal that the EUR/USD may continue higher.
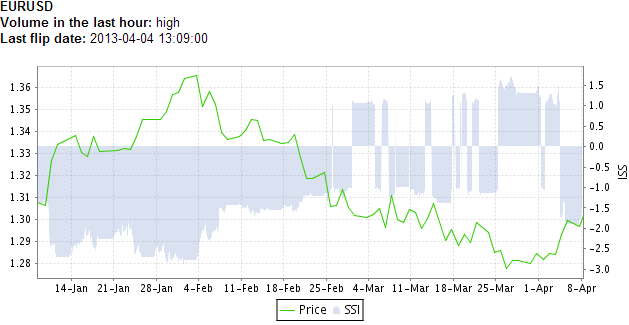
The trading crowd has grown further net-short from yesterday but unchanged since last week. The combination of current sentiment and recent changes gives a further bullish trading bias. The SSI-based trading signals on DailyFX PLUS are available as automated strategies at FXCMapps.com
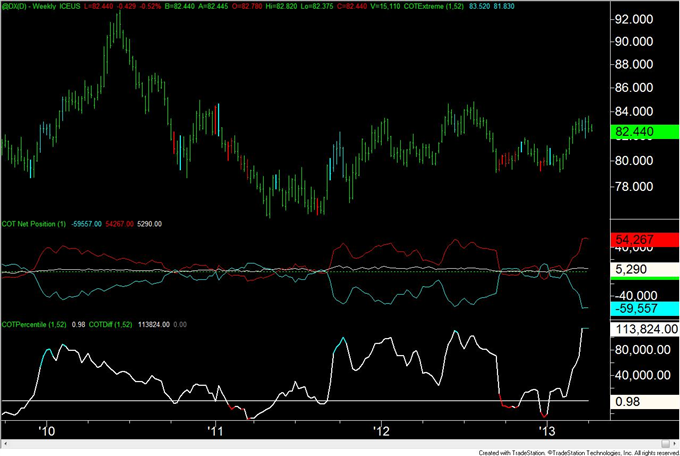
Yesterday, I mentioned how the Speculative Sentiment Index (SSI) showed that traders were long US dollar to start the week. Today, we can see this sentiment confirmed in the Commitments of Traders (COT) data from futures markets. Every Tuesday, DailyFX strategist Jamie Saettele provides an analysis of this data at DailyFX.com

The COT Index is the difference between net speculative positioning and net commercial positioning measured. Non commercials tend to be on the wrong side at the turn and commercials the correct side.
US Dollar
[ul]
[li]Non Commercials (speculators) – Red
[/li][li]Commercials – Blue
[/li][li]Small Speculators – White
[/li][li]COTDiff (COT Index) – White
[/li][/ul]
It’s possible to view COT data on the MT4 platform using the Commitments of Traders indicator available at FXCMapps.com
We have seen some incredible moves in the JPY pairs over the past 4 days, some of which rival the market movements from 2008. EUR/JPY is one such example which we saw rise by over 1,000 pips in 4 days!

This dramatic bull run was sparked by the Bank of Japan meeting last Thursday, but how were FXCM clients positioned in the Yen pairs going into the announcement? Below is a screenshot of the SSI report from Wednesday April 3 where you can see client positioning as of 16:45 GMT, and I have highlighted USD/JPY and GBP/JPY positioning:

SSI shows you that the majority of positions in USD/JPY were long, about 72%, and the majority of positions in GBP/JPY were long, about 54%. This leads me to my main question: How could Yen positioning by traders impact your brokers finances? It could be very important depending whether your broker uses dealing desk or no dealing desk execution. A broker that operates a dealing desk and doesn’t offset that risk would have been caught on the wrong side of the trade subjecting them to possible losses.
This is a very important consideration to keep in mind, especially for those brokers which do not make their financials transparent. You don’t know the financial health of your broker to get an idea of how well they would be weather a shock to their finances. As a publicly traded company on the NYSE, FXCM’s financials are transparent.
[I]Note: An administrative error at the Federal Reserve forced the world’s most important central bank to make an uncommon decision: release the prior month’s meeting Minutes at 09:00 EST/13:00 GMT as opposed to the typical release time of 14:00 EST/18:00 GMT. With the March Minutes being released on Tuesday at 14:00 EST/18:00 GMT to several dozen Congressional leaders and trade groups, it was necessary for the Fed to release the Minutes early today to limit potential trading on material nonpublic information.[/I]
You can stay on top of the latest news as it happens with the Real-Time News Feed at DailyFX.com

Typically, reactions in the EURUSD and the USDJPY (among the other USD-based majors) tend to be quite volatile following the release of the Fed’s Minutes, but with their leak earlier yesterday, the direct impact on trading at 09:00 EST/13:00 GMT is less clear and accordingly, a degree immeasurable.
[B]Dow Jones FXCM Dollar Index (Ticker: USDOLLAR) 1-minute Chart: April 10, 2013[/B]

Those market participants got off guard by the early release, however, viewed the Minutes as constructive for the US Dollar, bidding the Dow Jones FXCM Dollar Index (Ticker: USDOLLAR) up from 10486 to as high as 10495, the session high. At the time this report was written, however, prices began to pullback and move towards the release reaction low of 10478.
The SSI-based trading signals on DailyFXplus.com have had a great week trading the Japanese Yen meltdown, and retail forex crowd extremes offer a number of attractive trades in Yen and US Dollar pairs.
Past performance is not necessarily indicative of future results, but the fact that trading crowds have continued buying into Japanese Yen and US Dollar weakness suggest this move is far from over.
Past performance is not necessarily indicative of future results
Indeed, Euro and British Pound short positions against the USD surged an almost-unbelievable 82 and 158 percent since last week. We would be very careful about joining the crowd at these levels—in fact we like doing the opposite.
Past performance is not necessarily indicative of future results
Elevated volatility expectations in JPY pairs makes the Breakout2 trading signals particularly attractive on the EUR/JPY, while outperformance in our streak-prone Momentum2 suggests its USD and JPY-shorts may continue to do well in the days ahead.

Past performance is not necessarily indicative of future results
These DailyFX trading signals are available as automated strategies at FXCMapps.com
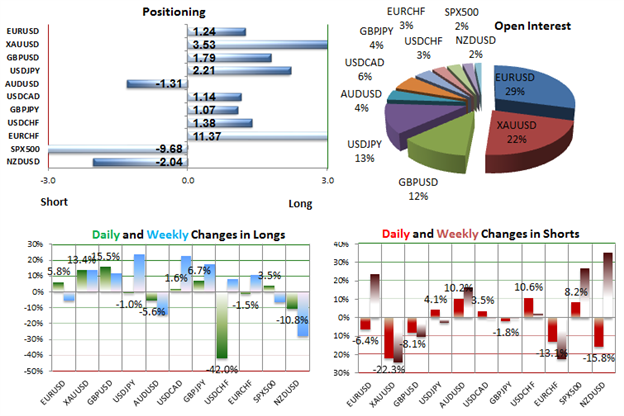
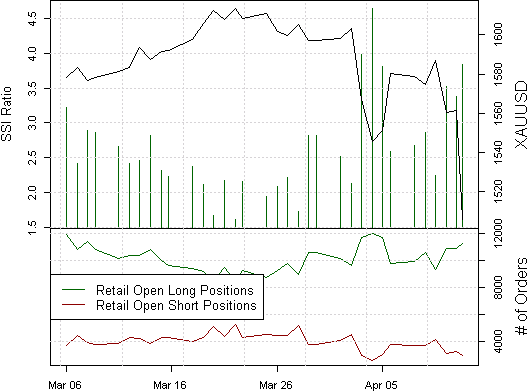
The last report for the week on the Speculative Sentiment Index (SSI) was just posted on DailyFXplus.com. It reveals that the ratio of long to short positions in Gold (XAU/USD) stands at 3.83 as 79% of traders are long.
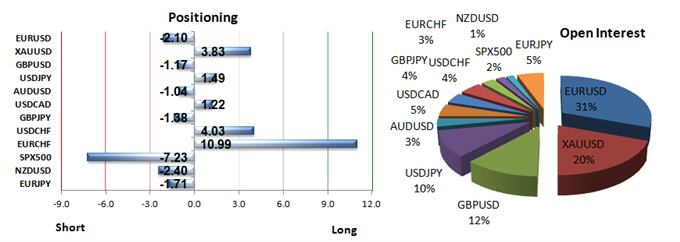
Yesterday the ratio was 3.28; 77% of open positions were long. Long positions are 3.4% higher than yesterday and 7.0% above levels seen last week. Short positions are 11.5% lower than yesterday and 19.6% below levels seen last week.

Open interest is 0.1% lower than yesterday and 0.5% above its monthly average. We use our SSI as a contrarian indicator to price action, and the fact that the majority of traders are long gives signal that the XAU/USD may continue lower.
The trading crowd has grown further net-long from yesterday and last week. The combination of current sentiment and recent changes gives a further bearish trading bias.
We’re going to deviate away from forex for today’s post since the big mover of the day is gold down 6%+, and now down over 27% since the peak of $1920 reached in September 2011. A decline this large puts gold in bear market territory. Take a look at the chart:
[B]Gold (XAU/USD)[/B]

So where does gold head next? This is a very long term view going all the way back to the 2000 low around $250, and adding a fibonacci retracement finds major support near $1,281 which is the 38.2% fibonacci level.
Gold charts can be found onDailyFX, and gold trading is not available for US residents. As with any form of speculative trading, please bear in mind that your capital is at risk. Good luck with trading this week!
Where is the EUR/USD heading? The DailyFX PLUS Technical Analyzer has a bullish bias for EUR/USD calling for a move towards the 1.3190 level.

The latest SSI data also shows that traders continue to sell the EUR/USD despite the moves higher, and this gives a contrarian signal that we could see moves higher. Here’s a look at the latest SSI release in DailyFX PLUS:

The DailyFX PLUS Trading Signals issued a bullish signal for EUR/USD earlier this morning which is also targeting nearly the same level as the Technical Analyzer, but the pair is trading slightly above the entry point for the signal.

All of this analysis can be accessed in real time via DailyFX PLUS at http://plus.dailyfx.com. Good luck with your trading today!