[I]The Australian Dollar has tumbled to 11-month lows despite record-highs in the US S&P 500—what gives?[/I]
AUD/USD typically trades quite closely to stock market prices and broader risky asset classes, but recent S&P gains haven’t been enough to forestall a sizeable Aussie Dollar sell-off. The chart below helps explain the breakdown in the correlation between the AUD and S&P.
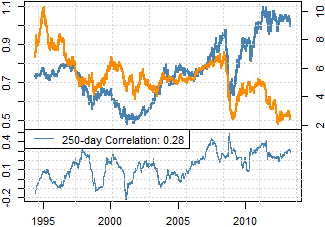
[B]AUD vs S&P 500, Gold and Yields[/B]
The material breakdown in the S&P 500/Aussie correlation can subsequently be explained in terms of yields—the AUDUSD simply doesn’t offer the same interest rate differential it once did. We’re left with a correlation that actually trades near multi-year peaks.
[B]AUD vs 2Yr Aussie Govt Bond Yield
Australian Dollar/US Dollar Exchange Rate (lhs)
2-Year Australian Government Bond Yield (rhs)[/B]
The year-long correlation between the AUD/USD and Aussie yields trades helps explain the Asia-Pacific currency’s break from the S&P 500. Further declines in domestic yields could force AUD weakness regardless of what’s going on in the S&P and broader ‘risk’ markets.
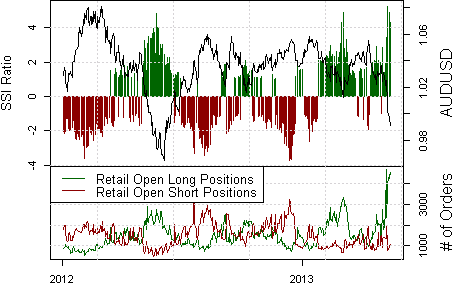
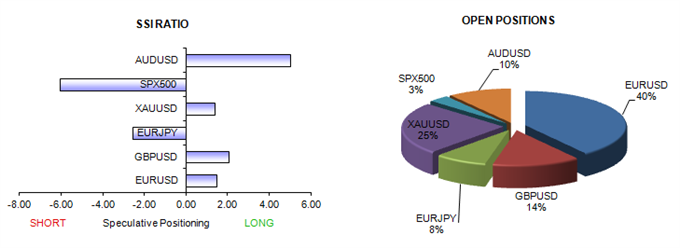
Our proprietary Speculative Sentiment Index (SSI) data shows retail FX traders recently hit their most long the Australian Dollar against the US Dollar on record, and indeed sentiment remains extremely one-sided. Since SSI is a contrarian indicator, we remain plainly in favor of selling into AUD/USD weakness until further notice.
The US Dollar continues to surge across the board, and we like buying into strength–but where? Here are a few setups we’re watching.
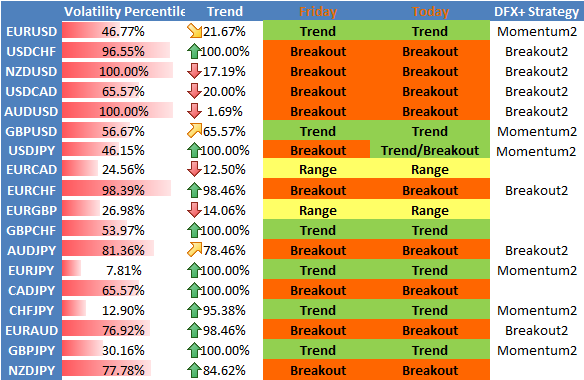
DailyFX trading signal biases likewise remain almost exactly unchanged since Monday as volatility prices continue to surge year-to-date peaks. Here are our signal outlooks and volatility percentiles for major currency pairs–the AUD/USD, USD/CHF, and NZD/USD seem especially likely to see big moves.
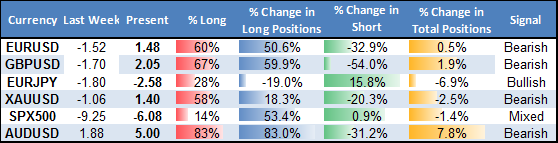
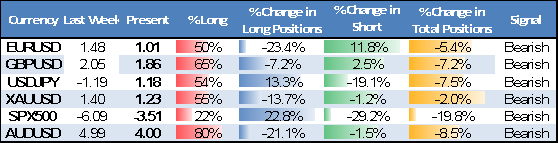
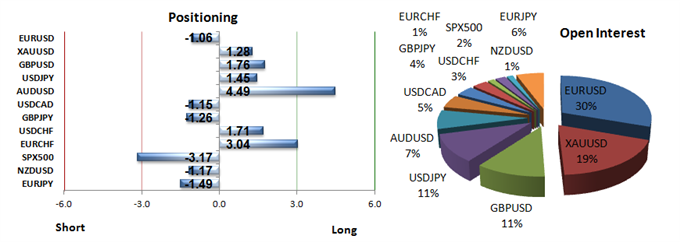
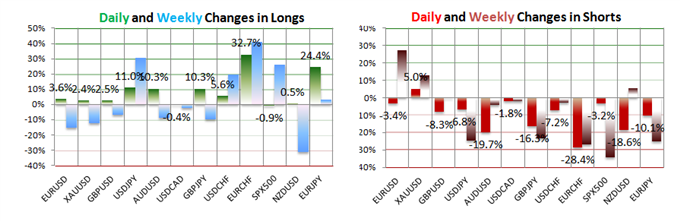
What a difference a week makes. Retail FX traders went from buying aggressively into Dollar weakness to being universally short USD across the board. We like buying for that same reason.
Weekly Summary of Forex Trader Sentiment and Changes in Positioning
Last week we wrote that traders remained short Euro, British Pound, and Japanese Yen against the downtrodden Greenback, but a substantive shift in sentiment and market conditions has effectively reversed our SSI-based forecasts.
We like buying the US Dollar across the board as volatility prices surge and retail traders do the opposite—particularly against the Australian Dollar and Swiss Franc. You can see the full SSI charts for all the majors at DailyFX.com
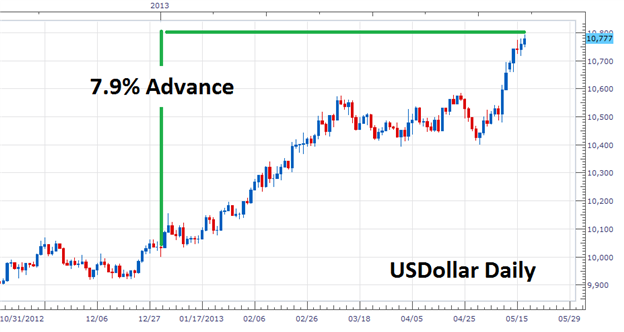
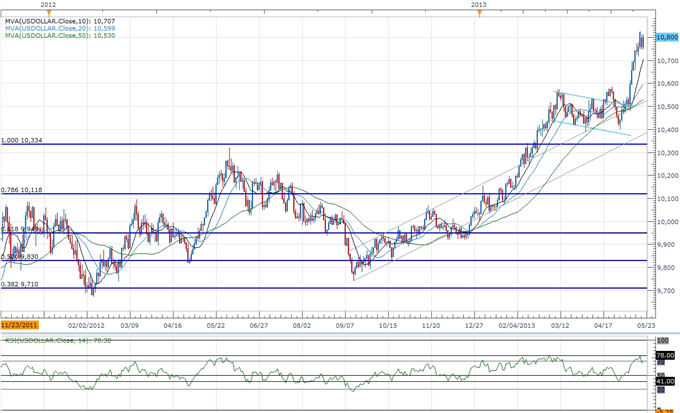
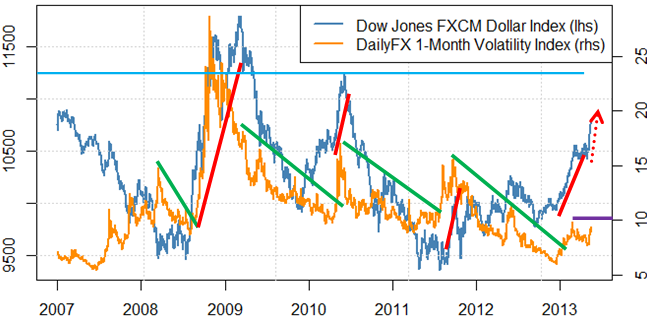
The Dow Jones FXCM Dollar Index (ticker: USDOLLAR) is a great asset used to determine USD direction. Today we will review trading breakouts with the current USD trend. So far for the 2013 trading year the index has advanced over 7.9% after breaking through key resistance at 10,000.
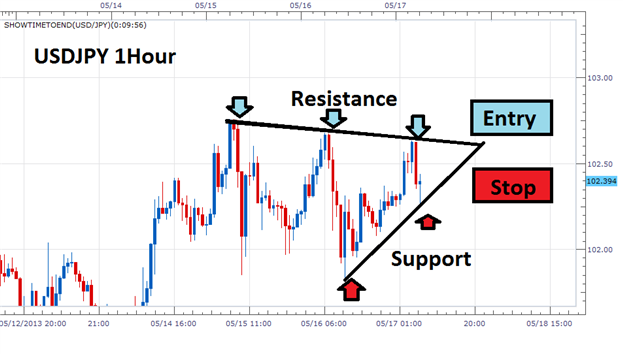
Savvy traders using this index for guidance can then plan for breakouts on the USD pair of their preference. Since our bias is towards the USD increasing in value, traders will look to buy the USD/JPY on a breakout of resistance.
The easiest way to take advantage of a breakout is through setting an entry order outside of resistance and above the previous high. In the event that price breaks through our pre-defined barrier our order will execute, positioning us to take advantage of the USDOLLAR trend.
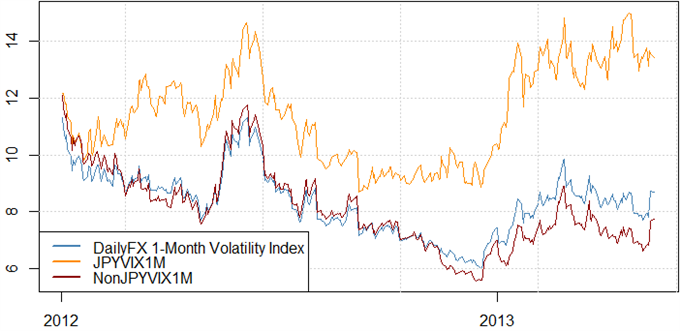
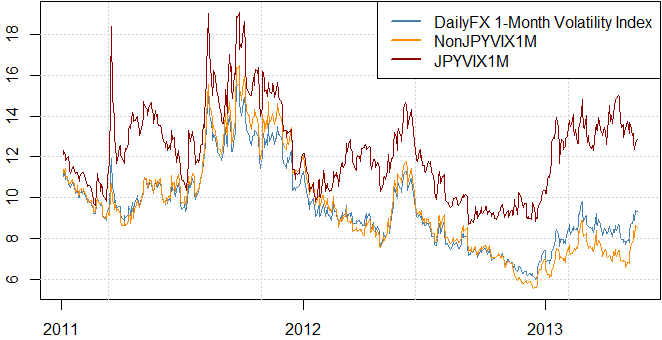
The US Dollar surge seems like the beginning of a much larger move, and our volatility-friendly and trend-following trading strategies look attractive in the week ahead.
[B]1-Month Volatility Prices across Major Pairs versus Japanese Yen Pairs[/B]
[I]Past performance is not necessarily indicative of future results.[/I]
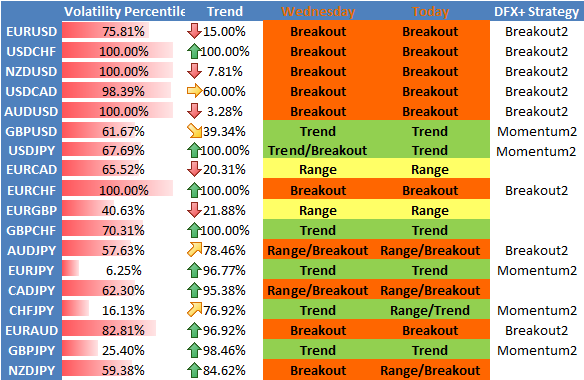
While past performance is not necessarily indicative of future results, our sentiment-based breakout and momentum trading signals have usually performed better with higher volatility. On the other hand, the range trading strategies tend not to do as well.
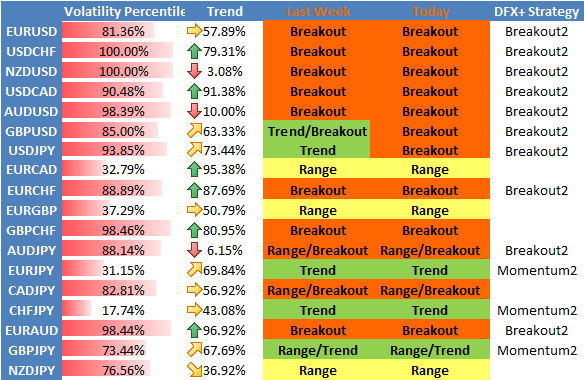
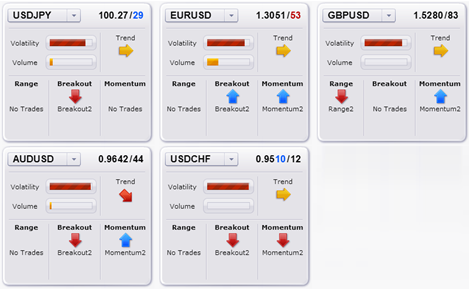
[B]DailyFX Individual Currency Pair Conditions and Trading Strategy Bias[/B]
[I]Past performance is not necessarily indicative of future results.[/I]
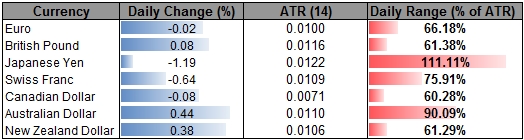
The U.S. dollar gained ground versus most major rivals Tuesday, with investors awaiting remarks from a pair of Federal Reserve policy makers a day ahead of congressional testimony by Fed Chairman Ben Bernanke.
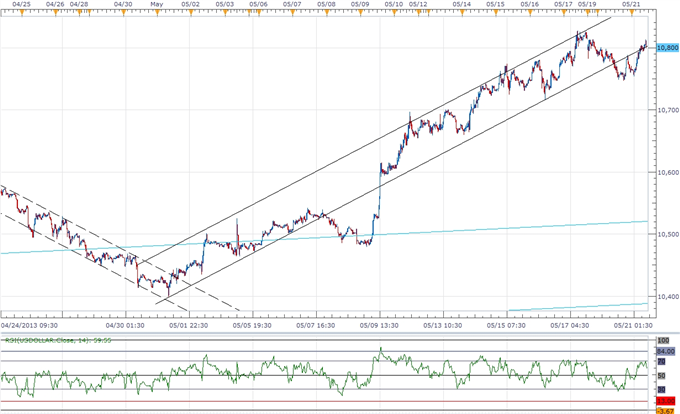
The Dow Jones-FXCM Dollar Index (ticker: USDOLLAR) is 0.38 percent higher from the open after moving 86 percent of its average true range, and the rebound may gather pace ahead of the FOMC Minutes as we see a growing discussion to taper the asset purchase program.
Beyond the FOMC Minutes, we also have Fed Chairman Ben Bernanke scheduled to testify in front of Congress tomorrow at 14:00 GMT, but the central bank head may refrain from saying anything new as the committee sticks to its highly accommodative policy stance.
It was interesting to see that comments from Fed dove Charles Evans sparked a bullish reaction in the dollar as he struck an improved outlook for the U.S. economy, and we may see the USDOLLAR continue to mark fresh highs over the near to medium-term as the central bank drops its dovish tone for monetary policy.
Federal Reserve Chairman Ben Bernanke took to the hill today to respond to questions in front of a congressional testimony. His prepared statement was quite dovish. On the labor market specifically, he said:
[B][I]“Despite this improvement, the job market remains weak overall: The unemployment rate is still well above its longer- run normal level, rates of long-term unemployment are historically high, and the labor force participation rate has continued to move down.”[/I][/B]
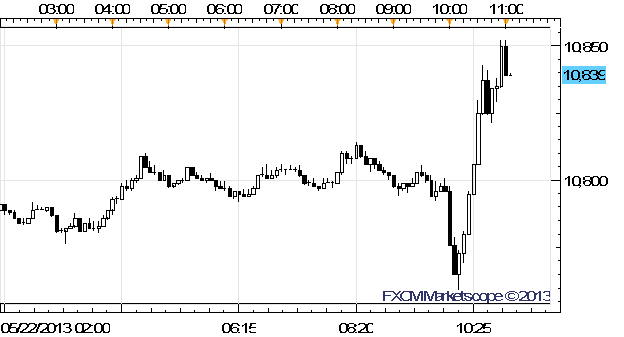
However, during the Q&A portion, Chairman Bernanke said that the pace of QE3 could be slowed over the course of the “next few meetings”, sending equity markets into a tailspin, and the US Dollar surging across the board. The USDOLLAR rallied from a low of 10759 to as high as 10852, as the USD/JPY hit a four and a half year high above 103.60.
The Tidal Shift Strategy has since given a signal to buy USD/JPY. The system recommends entering this trade at any price between 103.272 and 103.748. The 14-period Average True Range on a daily chart is 0.19, so the trailing stop loss has been set at 102.559.
Tidal Shift is a trend trading strategy that aims to catch shifts in trend using trader sentiment as an indicator. The strategy looks to buy when the Speculative Sentiment Index reaches its lowest value for the past 145 trading hours, and looks to short when it reaches its highest value for the past 145 trading hours. The system is available for automation for all FXCM Trading Station accounts via the Mirror Trader platform.
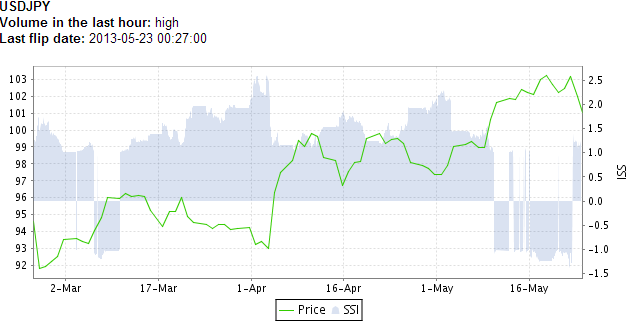
We use our Speculative Sentiment Index (SSI) as a contrarian indicator to price action, and the fact that the majority of traders are long USD/JPY gives signal that the pair may continue lower.
The ratio of long to short positions in the USDJPY stands at 1.45 as 59% of traders are long. Yesterday the ratio was 1.22; 55% of open positions were long.
Long positions are 11.0% higher than yesterday and 30.5% above levels seen last week. Short positions are 6.8% lower than yesterday and 24.7% below levels seen last week.
The trading crowd has grown further net-long from yesterday but unchanged since last week. The combination of current sentiment and recent changes gives a further bearish trading bias.
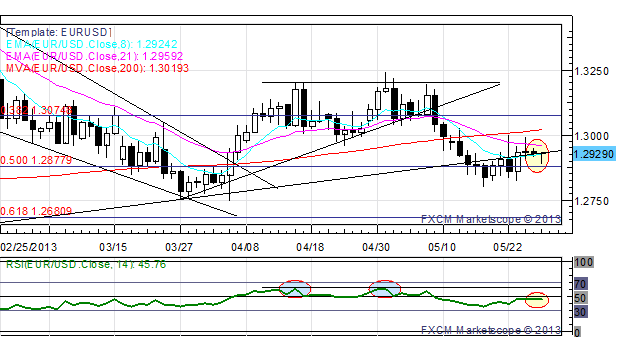
The Euro regained its footing today, with EUR/USD bouncing back from an overnight low of 1.2882, but the single currency may struggle to hold its ground ahead of the next European Central Bank (ECB) interest rate decision on June 6 as the Governing Council maintains a dovish tone for monetary policy.
As the ECB continues to push into uncharted territory, the policy outlook is likely to produce further declines in the EURUSD, and the head-and-shoulders formation may continue to take shape in the days ahead as it retains the range-bound price action carried over from the previous week.
As the pair appears to be carving a lower top just below the 1.3000 handle, we are still looking for a move back towards the 23.6% Fibonacci retracement from the 2009 high to the 2010 low around 1.2640-50, and we may see the bearish setup play out in the month ahead as the interest rate outlook deteriorates.
The Tidal Shift Strategy on DailyFXplus.com has just given a signal to buy EUR/USD. The system recommends entering this trade at any price between 1.29437 and 1.29887, with a trailing stop at 1.28763.
The signal was issued because our Speculative Sentiment Index (SSI) has hit its most extreme negative level for the past 145 trading hours at -1.2423, which suggests that the EUR/USD could be trending upwards.
This strategy can be automated on all live FXCM Trading Station accounts via the Mirror Trader platform.
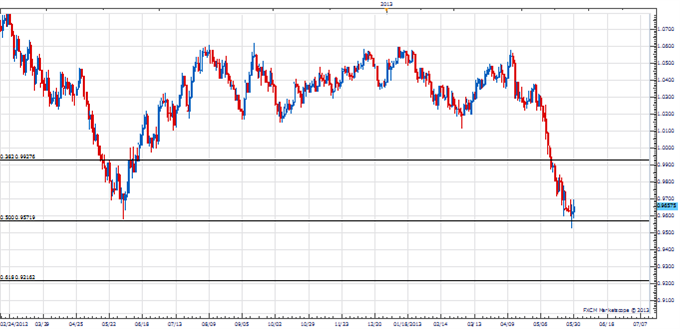
Anyone see a potential ‘head-and-shoulders’ formation on the weekly EUR/USD chart?.. Or is it just me? Would that signal a price reversal and heavy downtrend?
BTW, if I am wrong, and there is a possible uptrend shift… where would be a good place to put a ‘buy limit’ order?
If you look at a weekly chart, you’ll see a head and shoulders pattern that could signal a possible downtrend. I’ve circled the head in red and marked the neckline with a dotted red line. However, there is also a larger inverted head and shoulders patter that could signal a possible uptrend. Of course that could take months to play out. I’ve circled the head and marked the neckline with a green dotted line. Interestingly, these two necklines are almost parallel and form a channel that can also be traded, if you think the pair will stay range-bound.
These weekly chart signals are certainly worth exploring, especially if you are a long term trader. My own preference is to place trades that tend to be more medium term, playing out over the course of a few days, instead of weeks or months. How about yourself?
AUD/USD has been under steady pressure for the last month and traded to its lowest level in over a year and a half on Wednesday. This decline has been very impressive in terms of its veracity and scope, but a confluence of factors suggests the current decline may soon be reaching a turning point.
AUD/USD Daily Chart: May 30, 2013
Extreme sentiment is a particular concern given surveys like the DSI (Daily Sentiment Index) show just 17% bulls in the currency amongst short-term futures traders. Historically, whenever the Aussie has neared such levels of negative sentiment it has been a good contrarian and leading indicator of a turn.
The exchange rate is nearing critical price levels like the .9570 50% retracement of the 2010 to 2011 advance. As such, I like the risk to reward of positioning on the long side over the next few days.
Cycle-sensitive crude oil and copper prices are following stocks lower while the US Dollar is reclaiming its safe-haven credentials, pushing higher and applying de-facto selling pressure to gold and silver.
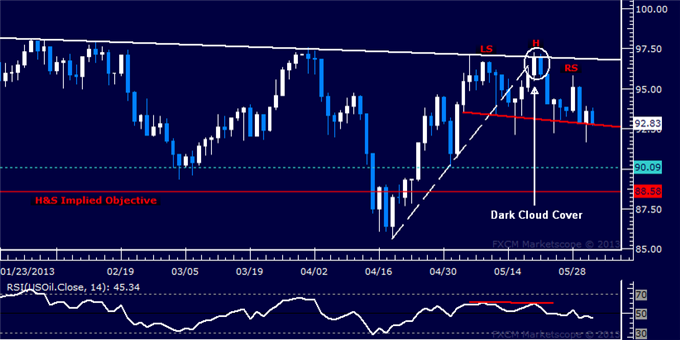
[B]Crude Oil Technical Analysis (WTI)[/B]
Prices appear to be forming a Head and Shoulders top chart formation. Confirmation requires a close below the pattern’s neckline (now at 92.78), initially exposing the May 1 low at 90.09 and a measured downside objective at 88.58.
Near-term resistance is at 95.89, the May 28 high, with a push beyond that eyeing a falling trend line at 96.82.
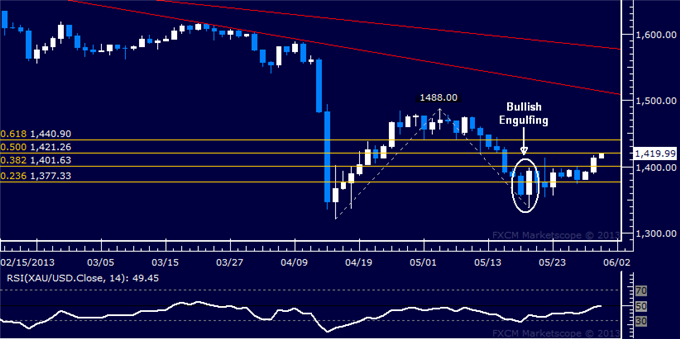
[B]Gold Technical Analysis (Spot)[/B]
Prices moved higher as expected after completing a Bullish Engulfing candlestick pattern, taking out the 38.2% Fibonacci expansion at 1401.63.
Buyers now stand to challenge the 50% mark at 1421.26, with a push above that eyeing the 61.8% Fib at 1440.90. The 1401.63 mark has been recast as near-term support.
Because I work a full time job and don’t always have the time to trade, I’ve opted to continue studying the markets and looking at the longer timeframes until I’m able to devote 100% of my time to the trading.
I’m most comfortable trading currency pairs on the monthly charts that, to me, are heavily overbought or oversold. AUD/JPY, CHF/JPY, and USD/CAD are a few. To me, those trades are easy money, they don’t require a lot of management, and I don’t feel like they’re very risky if managed correctly… Sort of a ‘set and forget’ trading style. Of course, the payouts take time to materialize, however, they’re almost guaranteed.
Thanks again for reviewing my question… Looking forward to reading more of your insightful articles…
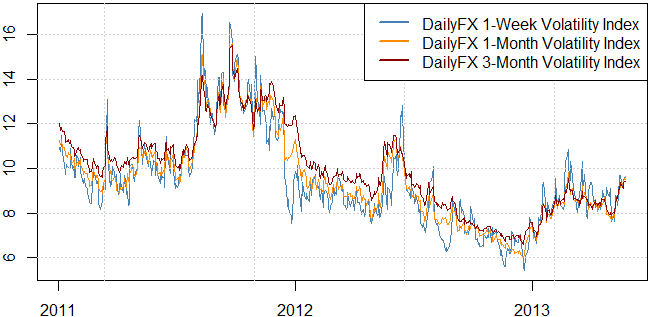
It ‘feels’ like markets have been volatile, and they have been, but a simple look at volatility prices (chart below) suggests this could be only the beginning for major forex market moves.
Forex Options Market Volatility Prices Across Major Pairs
There is material risk of a major Japanese Yen reversal. This could make the USD/JPY in particular one of the most attractive trades through the foreseeable future. In terms of our sentiment-based trading signals, we’ll look to the volatility-friendly Breakout2 trading system with focus on the USD/JPY and other JPY pairs.
DailyFX Individual Currency Pair Conditions and Trading Signal Bias
DailyFX trading signals are available as automated strategies at FXCMapps.com
It’s great that you’ve chosen a time frame that suits your schedule. I feel a lot of people don’t give that enough consideration.
Your currency pairs of choice interest me. Do you use a combination of both fundamental and technical analysis? Also, since you trade long term, do you tend to trade in the direction in which you can earn rollover interest?
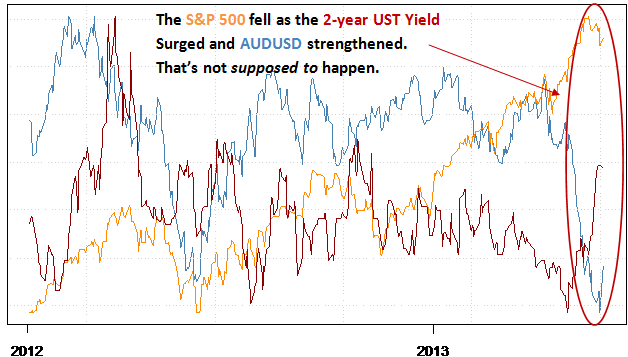
It could be a huge week across financial markets as early signs of a market panic forced the S&P 500 lower, Treasury Bond Yields higher, and the Australian Dollar surging versus the USD. Why are correlations so broken?
Australian Dollar Plotted Against Relative Moves in S&P 500, Gold Data source: Bloomberg, Chart source: R
In a recent DailyFX article, we explained why an S&P 500 sell-off might actually make the Dollar weaken as traders exit super-crowded S&P, USD, and Bond market longs. That’s because deleveraging would put all three at risk and helps explain the clear breakdown in correlations.
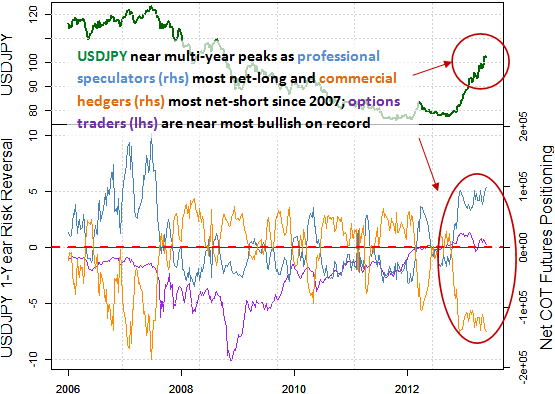
Japanese Yen Positioning Remains Extremely One-Sided, Warning of USD/JPY Declines Data source: CFTC Commitment of Traders Report, Bloomberg OTC Options
If our hypothesis is correct and there is a dramatic deleveraging across financial markets, it makes sense to look at currencies/stocks/bonds in which positioning is at its most one-sided. In the forex market, that would be the Japanese Yen.
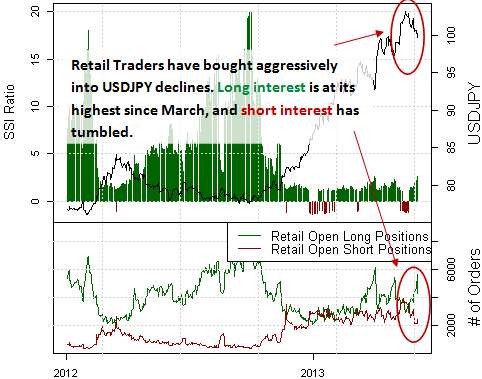
Retail Forex Speculators Grow Extremely Long USD/JPY Data source: FXCM Execution Desk, Weekly Speculative Sentiment Index (SSI)
Retail speculators have grown extremely net-long the US Dollar against the Japanese Yen as it falls sharply off of recent peaks. We most often use our proprietary Speculative Sentiment Index data as a contrarian indicator to price action.
Summary of Positions in DailyFX PLUS Trading Signals Source: DailyFX PLUS Classic Trading Signals
If everyone’s buying we want to sell and vice versa. It’s no surprise to note that our sentiment-based trading signsl are short USDJPY and more broadly short the US Dollar. These trading signals are available as automated strategies at FXCMapps.com
Last week, you spotted this potential head-and-shoulders pattern on EUR/USD. I thought you might be interested to know that David Song mentioned it today in his article on DailyFX.com:
[B][I]"As the EURUSD continues to carve a lower top below the 38.2% Fibonacci retracement from the 2009 high to the 2010 low around 1.3120, a dovish ECB may serve as the fundamental catalyst to put the head-and-shoulders formation into motion…
“…we will continue to look for a move back towards the 23.6% retracement around 1.2640-50 as the dismal developments coming out of the euro-area dampen the appeal of the single currency.”[/I][/B]