FXCM/DailyFX Signals and Analysis

The European Central Bank kept its key interest rate on hold at its all-time low of 0.50%, while leaving its main deposit rate on hold at 0.00%, but the big news was that it shied away from implementing negative rates or any other measures that would result in a theoretically expanded ECB balance sheet.

This set the stage for a Euro rally as EUR/USD surged over 100 pips from a low of 1.3088 up to where it’s currently trading around 1.3190. The latest readings from the Speculative Sentiment Index (SSI) indicate that the pair could be poised for further gains as retail traders continue to sell rallies.

The ratio of long to short positions in the EUR/USD stands at -1.75 as 36% of traders are long. The trading crowd has grown further net-short from yesterday and last week. The combination of current sentiment and recent changes gives a further bullish trading bias.

The much-ballyhooed May US labor market report came right in the “Goldilocks” zone for market participants: good enough to reignite modest optimism about the US economy; but not good enough to provoke a major drawdown in the Federal Reserve’s QE3 program.

[B]The important numbers:

[ul]
[li]Change in Nonfarm Payrolls: +175K versus +163K expected, from +149K (revised lower from +165K)
[/li][li]Change in Private Payrolls: +178K versus +175K expected, from +157K (revised lower from +176K)
[/li][li]Unemployment Rate (U3): 7.6% versus 7.5%, from 7.5%
[/li][li]Underemployment Rate (U6): 13.8% from 13.9%
[/li][li]Participation Rate: 63.4% from 63.3%
[/li][/ul][/B]

Yesterday, it seemed that traders were positioning themselves for a poor print: weaker USDJPY, stronger US equities, lower US Treasuries yields. Today, equities are up, the US Dollar is gaining, and US Treasuries yields are higher. This looks like a repositioning for renewed speculation of the QE3 taper – certainly, the data doesn’t lean that heavily in either direction.

[B]USD/JPY 1-minute Chart: June 6, 2013[/B]

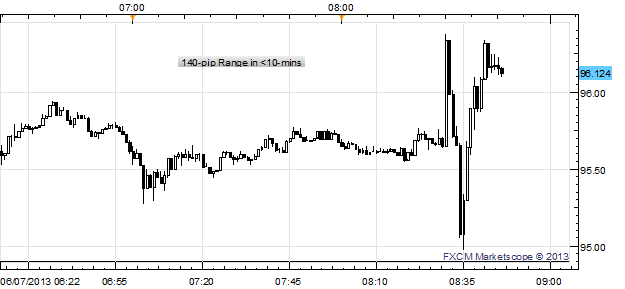
Following the release, the USD/JPY gyrated violently, trading from ¥95.75 to as high as 96.38, before plummeting to 94.38. But within 15-minutes, the USD/JPY had surged back to 96.12, at the time this report was written. US Dollar strength was observed across the board, with the EUR/USD falling to $1.3205, and the AUD/USD plunging back to the weekly lows near $0.9440.

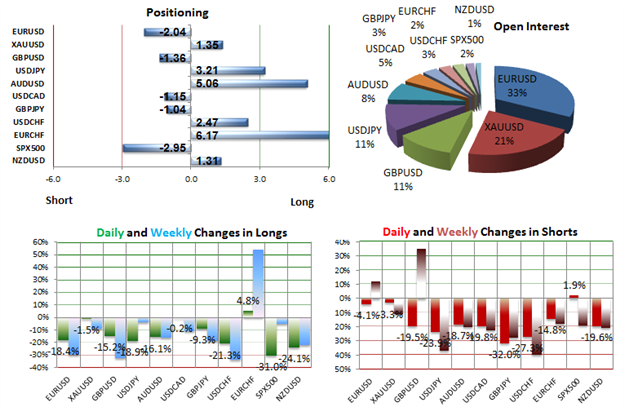
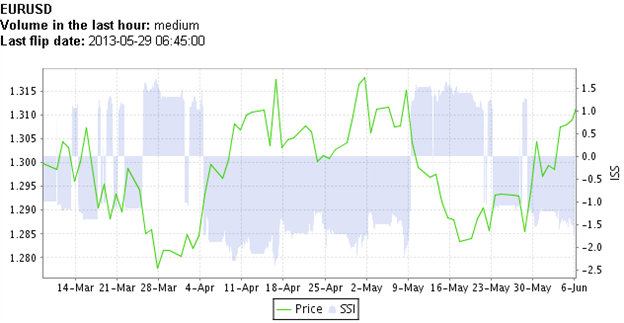
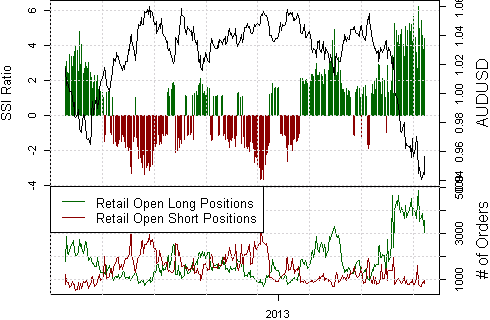
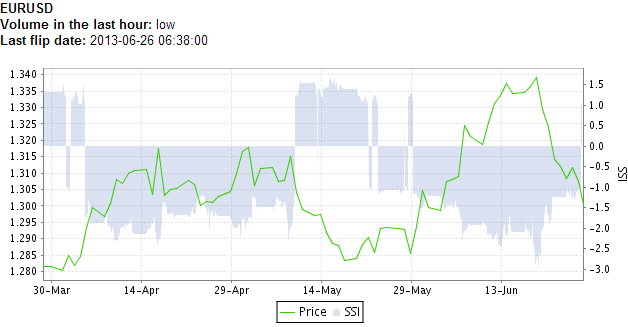
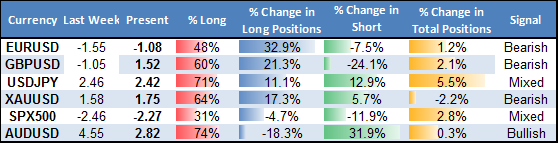
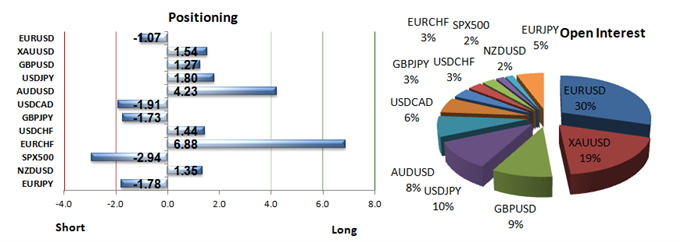
It’s worth noting that overall, traders are still long US dollar, which means today’s boost after NFP could be short lived. The one major pair where the Speculative Sentiment Index (SSI) supports this mornings tendency of US dollar strength is AUD/USD. The trading crowd has grown further net-long the Aussie from yesterday and last week. The combination of current sentiment and recent changes gives a further bearish trading bias.

The Commitments of Traders (COT) Index is the difference between net speculative positioning and net commercial positioning measured. Non commercials tend to be on the wrong side at the turn and commercials the correct side.

[B]Latest CFTC Release[/B]

Record short positions for speculators and record long positions for commercials indicate a possible reversal for the Australian Dollar. The COT MT4 indicator pulls data directly from the CFTC website and plots it directly below an MT4 chart in an easy to read format and is available at FXCMapps.com

A light blue colored bar indicates that the difference in positioning is the greatest it has been in 52 weeks (bullish) with speculators selling and commercials buying. A light red colored bar indicates that the difference in positioning is the greatest it has been in 52 weeks (bearish) with speculators buying and commercials selling. Crosses above and below 0 are in bold.

The greenback may regain its footing ahead of the next FOMC interest rate decision on June 19 as tapering the asset purchase program becomes a growing discussion at the central bank.

Indeed, the Dow Jones-FXCM Dollar Index (ticker: USDOLLAR) may continue to build a short-term base in June, and the greenback looks poised to make another run at the 10,900 handle as the FOMC faces limited scope to further embark on its easing cycle.

With the new currency baskets on the Mirror Trader platform, FXCM clients can now also take a bullish or bearish position on a single currency such as the US Dollar instead of having to choose a specific currency pair to trade.

Yesterday, DailyFX analyst David Rodriguez mentioned that the Australian Dollar likely set a substantial low. In his video today, he updates those views with a concrete look at trade setups.

He also discusses his latest DailyFX trading signal biases as shown below.

Strategy Preferences Broken Down by Volatility Prices and Currency Trends

These DailyFX trading signals are available as automated strategies at FXCMapps.com

In the video I posted yesterday DailyFX analyst David Rodriguez shared his view that the Aussie recently set a substantial low. Today the Tidal Shift Strategy on DailyFXplus.com added further confirmation to this idea by generating the following buy signal for AUD/USD.

The system recommends entering this trade at any price between 0.95322 and 0.96124. The 14-period Average True Range on a daily chart is 0.00321, so the stop loss has been set at 0.94118. This stop loss order is a trailing stop that will move up as the market moves up.

The signal was issued because our Speculative Sentiment Index (SSI) has hit its most extreme negative level for the past 145 trading hours at 3.001, which suggests that the AUD/USD could be trending upwards. All FXCM Trading Station clients can the Tidal Shift Strategy by using the same account login on the Mirror Trader platform.

EUR/USD About to Break? The forex market is intently focused on the US FOMC rate announcement on Wednesday followed by Fed Chairman Bernanke’s press conference. DailyFX Analyst John Kicklighter posted a very interesting EUR/USD chart to his Twitter account a few hours ago which could indicate an impending breakout just in time for the Fed decision.

Which way will it break? The trend has been up which would signal a bullish break if the argument is that a flag is followed by continuation of the trend. Second, SSI positioning remains net short which would indicates a contrarian signal for more gains. EUR/USD positioning is currently giving a reading of -2.03 which tells us there are 2.03 short positions for every position long.

SSI can be found updated twice per day in DailyFX PLUS.

Despite the mixed batch of data coming out of the world’s largest economy, the Dow Jones FXCM Dollar Index (Ticker: USDOLLAR) is trading 0.22 percent higher from the open.

The greenback may appreciate further over the next 24-hours of trading should the Federal Reserve show a greater willingness to taper its asset purchase program in the second half of the year.

The dollar looks poised to breakout to the upside as it carves out a higher low in June. In turn, we should see the dollar resume the upward trend from earlier this year, and the bullish sentiment surrounding the greenback may gather pace over the near to medium-term amid the shift in the policy outlook.

The USD Basket and baskets for other major currencies are available on the Mirror Trader platform. FXCM Trading Station account holders can use the same username and password to log into Mirror Trader.

Although the Dow Jones-FXCM U.S. Dollar Index (Ticker: USDollar) is trading 0.19 percent lower from the open, the Federal Open Market Committee (FOMC) interest rate decision could be the game-changer for the greenback should the central bank look to taper its asset-purchase program.

As the reserve currency carves a higher low in June, a less-dovish Fed may prompt the USDOLLAR to breakout of the downward trend carried over from the previous month, and we may see the index resume the upward trend from earlier this year as the central bank appears to be moving away from its easing cycle.

In turn, we may see the rebound in the USDOLLAR turn into a more meaningful rally in the coming days, and we will look for a higher high in the index as the bullish trend continues to take shape.

The USD Basket and baskets for other major currencies are available on the Mirror Trader platform. FXCM Trading Station account holders can use the same username and password to log into Mirror Trader.

This morning the instructors at DailyFX.com tweeted about a recent bullish signal they spotted for GBP/JPY. The pair bounced off the 100-day SMA in the direction of the long term uptrend. Playing this bounce, they are looking to go long at current levels.

Their profit target is set at 162.50 towards the top of the bullish channel that has formed. Their stop is set at 146.50 below the 100-day SMA line. To get their latest trade ideas you can follow the DailyFX instructors on Twitter.

DailyFX trading instructor Walker England recently tweeted about a price channel developing in CHF/JPY. The general trend of the price channel is downwards, so with the pair currently trading near the top of this channel, there is an opportunity to go short at current levels.

As shown in above a profit target can be set near the bottom of the price channel at around 101.80, with a stop above the channel at around 106.30. To keep up to date with his latest trade ideas, you can follow Walker England on Twitter.

10-year US Government Treasury Notes recently saw their biggest 1-week decline in a decade as yields surged. With the world’s supposed foremost safe-haven asset seeing truly historic sell-offs, there’s reason to believe there will be an increase in volatility across the board in global stock markets, bond markets and forex.

[B]Forex Options market and S&P 500 Volatility Prices From 2007-2013[/B]

Past performance is not necessarily indicative of future results, but our sentiment-based trading strategies have done well in highly-volatile markets. Our major focus remains the Momentum2 strategy—also known as the “Tidal Shift” system. It’s thus far caught some fairly substantial turns in the Dollar, Yen, and other pairs.

[B]DailyFX Individual Currency Pair Conditions and Trading Strategy Bias[/B]

If you have a live FXCM Trading Station account, you can now use those same account login details to access the Mirror Trader platform and automate the Tidal Shift strategy and other DailyFX trading signals.

This morning the instructors at DailyFX.com tweeted about a recent bearish signal they spotted for AUD/USD. RSI has hit resistance again at the 50 level. Since the pair is in a strong downtrend, this can act as an overbought signal.

They are looking to go short AUD/USD at current levels, with a profit target at 0.9000 and a stop loss at 0.9350. To keep up with their latest trade ideas you can follow the DailyFX instructors on Twitter.

Today, the DailyFX team tweeted that EUR/USD just fell below the 1.3000 for the first time since June 3rd. As you can see in the chart below, SSI (the bar graph) flipped from negative to positive today just as EUR/USD (the green line) broke through this key price level.

That means retail traders went from being net short to being net long this currency pair and are trying to pick a bottom to this downtrend. You can see in the bar graphs below how retail long positions dramatically increased in the EUR/USD during this period.

That is actually a contrarian signal that indicates the downtrend could continue. As I’ve highlighted in the chart below, the Fibonacci levels above the current market price act as resistance, the Fib levels below the current price at as support.

For a short term trade, you could look to go short at current levels, with a profit target near the 1.29417 Fib level, and a stop loss above the 1.30323 Fib level. For a medium term trade, you could set your profit target near the 1.27953 level, with your stop above 1.31055.

The weekly update of our Speculative Sentiment Index (SSI) was just posted on DailyFX.com and it says that crowds are now their most net-long Gold since its virtual meltdown in April as it hits fresh multi-year lows.

Below is an overlay of a Gold (XAU/USD) chart on a bar graph of SSI for the same time period. Notice that when SSI says that crowds are net short (brown bars) Gold tends to rise, and when crowds are net long (green bars) Gold tends to fall.

That means SSI is currently giving us a strong bearish signal for Gold. We can use the Technical Analyzer on DailyFX PLUS to get key price levels to enter a short position.

The chart above shows that we can go short at current levels with a stops above resistance (at 1250, 1271 or 1290) and profit targets near 1202 or 1195.

The latest readings from our Speculative Sentiment Index (SSI) show that crowds continue to buy into Aussie declines. As I discussed in my previous post, this is a strong contrarian indicator that the price could continue to fall further.

Notice above how AUD/USD tends to drop when crowds are net long (when the SSI bar graph is positive instead of negative). It’s not surprising then that the SSI-based Breakout1 strategy has just given a signal to short AUD/USD at current levels with a trailing stop at 0.9187

Breakout1 and other DailyFX trading signals are available as automated strategies at FXCMapps.com

There are several events on the economic calendar this week that are all likely to produce volatility. We have three major central bank meetings, and Non-Farm Payrolls on Friday.

Rate Hike Probabilities / Basis-Points Expectations

While past performance is not necessarily indicative of future results, such volatility has traditionally been favorable to the DailyFX trading signals that are based on our Speculative Sentiment Index (SSI).
_

Most recently the Tidal Shift strategy from DailyFXplus.com gave a trading signal this morning to buy EUR/JPY anywhere between 129.626 and 130.203 (blue lines) with a trailing stop at 128.761 (red line).

Tidal Shift and other DailyFX trading signals are available as automated strategies on the Mirror Trader platform. If you already have an FXCM trading account, you can use the same username and password to log into Mirror Trader.

Christopher Vecchio wrote an article on DailyFX.com today showing how you can use the Moving Average Dashboard from FXCMapps.com to get trend signals as shown below:

As you can see, the moving averages on the hourly, 2-hour, 4-hour and weekly charts for EUR/JPY, GBP/JPY and CHF/JPY all point to a bullish momentum for these pairs.

_

Yesterday I posted about the Tidal Shift strategy on DailyFX PLUS giving a signal to buy EUR/JPY, so today I wanted to share a trade signal for one of the other yen crosses.

There are currently no signals for GBP/JPY on DailyFX PLUS, but there are several for CHF/JPY.

The latest is signal is from the Momentum1 strategy and it says to buy CHF/JPY at current levels with a trailing stop at 104.913

[I]With ECB and BOE rate decisions tomorrow and the all important Non-Farm Payrolls coming out of the US on Friday, it’s no surprise that the latest readings from our Speculative Sentiment Index (SSI) show that traders have a fairly neutral bias for most of the major currency pairs, not being overly long or short.[/I]

For example, the SSI reading for EUR/USD is -1.07, which means there are 1.07 short positions for every 1 long position. That’s almost a 1 to 1 ratio, not much of a short bias.

The one outlier among the majors is AUD/USD where the ratio of long to short positions stands at 4.23 as 81% of traders are long. We use our SSI as a contrarian indicator to price action, and the fact that the majority of traders are long gives signal that the pair may continue lower.

The trading crowd has grown further net-long from yesterday and last week. The combination of current sentiment and recent changes gives a further bearish trading bias for AUD/USD.

We can now use the Technical Analyzer on DailyFX PLUS to get our profit targets as shown above in red, if we enter a short position at current levels.

Today on DailyFX.com quantitative strategist David Rodriguez reiterated his view that “the US Dollar stands to hit further multi-year highs as the largest bond bubble of a generation bursts. This may be particularly true against the yield-sensitive Japanese Yen as the USD/JPY exchange rate hits fresh peaks.”

Taking a look at the 4-hour charts we can see an opportunity to go long at current levels around 101.00 (blue line) using the 10-period EMA as support.

Our profit target can be set around the high in May of 103.731 (green line) with a stop loss around the 61.8% retracement level of 99.930 (red line) of the recent pullback since then.