To each his own, but I would be looking to buy with a break above 1.0350 with a target of 1.0450. USD/CAD is in a fairly good weekly uptrend, riding the trendline. I wouldn’t sell unless there was a close outside the trendline. Just my 2 pips. 
You make a fair point, and that’s why it’s important to use a stop whenever taking any position. So far the pair has remained in a tight range, since traders are waiting on this afternoon’s FOMC announcement.
Most major currency pairs have remained in a tight range as traders await this afternoon’s FOMC announcement. In times like this, the Speculative Sentiment Index (SSI) can be especially useful in providing insight. As you can see below, traders are long the US dollar across the board and have recently increased their long USD positions against the British Pound in particular.
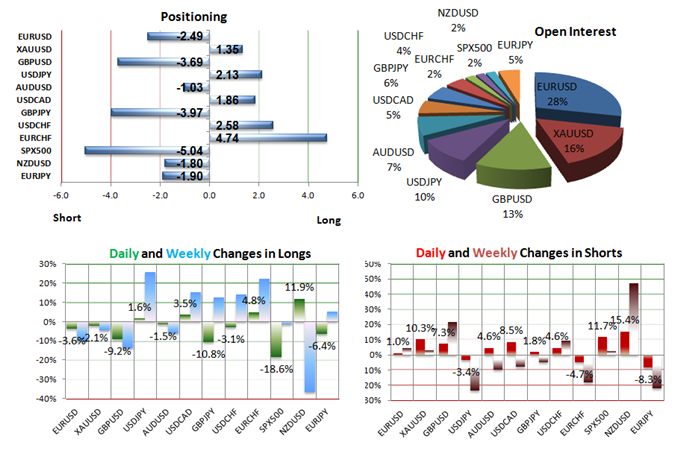
Cable (GBP/USD) stands at -3.69 as 79% of traders are short. Short positions are 7.3% higher than yesterday and 21.8% above levels seen last week. SSI is used as a contrarian indicator to price action, and the combination of current sentiment and recent changes gives the pair a bullish bias going into FOMC.
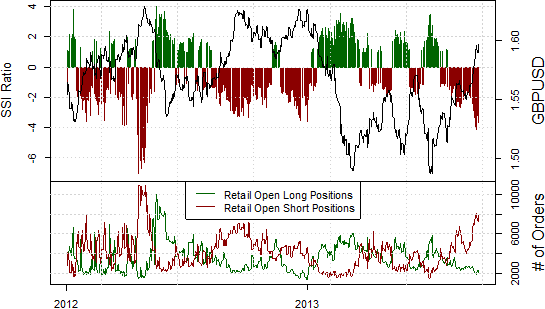
That means even if the FOMC announcement is bullish for the US dollar and therefore bearish for GBP/USD, the downside for a long position might be muted and the effects temporary. On the flip side, if the FOMC announcement is bearish for US dollar, that could be just the catalyst that is need to drive cable higher.

The SSI-based Breakout2 strategy on DailyFX PLUS is currently giving a trading signal to buy GBP/USD at current levels. Breakout2 trading signals are available as one of the automated strategies at FXCMapps.com
Just an update on my previous post. The US Federal Reserve shocked markets as it unexpectedly left the pace of its Quantitative Easing purchases unchanged through today’s meeting. Bloomberg estimates showed that most expected the FOMC to cut its monthly debt purchases by $5-$10 billion per month.
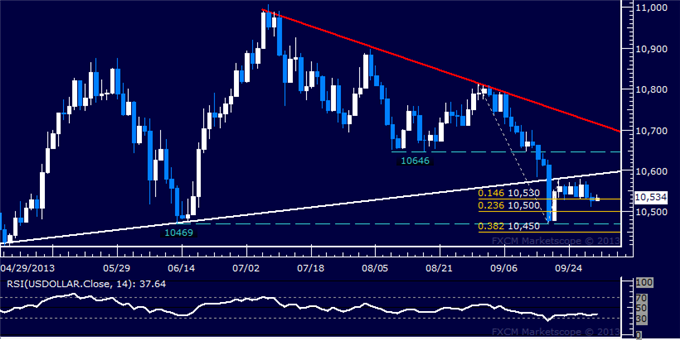
Dow Jones FXCM Dollar Index (ticker: USDOLLAR)
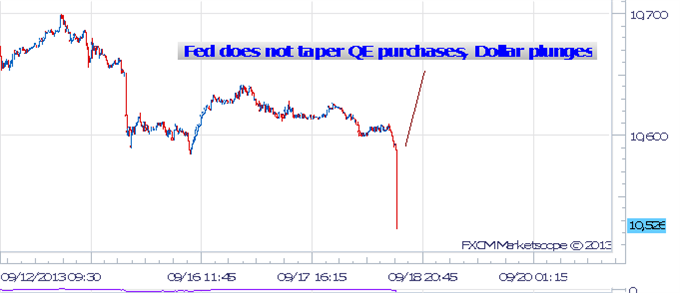
The clear disappointment led dollar sharply lower against all major currencies. This worked out well for the Breakout2 trading signal I mentioned in my previous post.
Past performance is not necessarily indicative of future results.

The trade is still open which is why it still appears on DailyFXplus.com, but the window of opportunity to enter the position has now passed. That is why the Action column below now says “Hold” instead of “Enter Now” as it said before the FOMC announcement.
The latest weekly update of the Speculative Sentiment Index (SSI) on DailyFX.com, shows that despite the big sell-off in US dollars after yesterday’s surprise FOMC decision not to taper QE, retail forex crowds continue buying aggressively into US dollar weakness.
Weekly Summary of Forex Trader Sentiment and Changes in Positioning
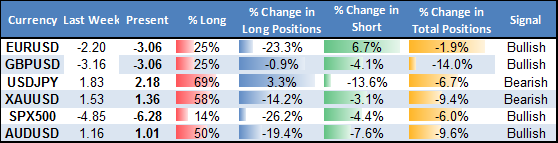
Most striking is how SSI has become even more negative for SPX 500 which tracks the S&P 500 index. The latest reading is -6.28 which means that there are 6.28 traders who are short for every trader that’s long.
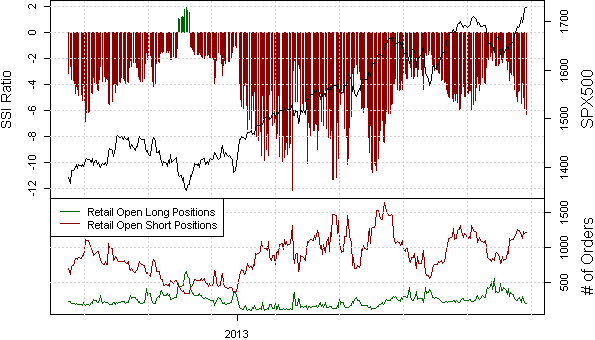
SSI is used as a contrarian indicator to price action, and the combination of current sentiment and recent changes gives SPX 500 further bullish bias.

Prices broke through the 61.8% Fibonacci expansion at 1719.60 to set a new record high. Buyers now aim to challenge the 76.4% level at 1741.60, with a breach above that eyeing the 100% level at 1777.10. The 1719.60 mark has been recast as near-term support, followed by the August 2 high at 1709.60.
The US Dollar rose this morning as voting Federal Open Market Committee member Bullard said a small taper is possible in October.The latest Speculative Sentiment Index (SSI) readings show that while retail traders are still long the US Dollar overall, they have reduced long positions since yesterday’s surprise FOMC decision not to taper in September.

While traders remain net long USD against most major currencies, they have flipped to being net short USD against the Australian dollar. SSI is a contrarian indicator to price action, and the fact that the majority of traders are long gives signal that the AUD/USD may continue lower.

Two SSI-based strategies (Breakout2 and Momentum2) are currently giving signals to open short AUD/USD positions at current levels. The trading crowd has flipped from net-short to net-long from yesterday. The combination of current sentiment and recent changes gives a further bearish trading bias.

The Range2 strategy had already opened a short AUD/USD position 100 pip higher. While the trade is still open and floating a profit, the window of opportunity to get in on that trading signal has passed. That is why action column on for these trading signals says “Enter Now” for Breakout2 and Momentum2, but says “Hold” for Range2.
[B]All three of these DailyFX PLUS trading signals are available as automated strategies at FXCMapps.com[/B]
I would agree that the AUDUSD is heading lower. possibly new chart lows down the road. I believe we are simply seeing a correction take place to the upside. In my opinion, China has a smoke screen covering their true economic well-being. They will fall and fall hard down the road. Also, I believe the AU wants their currency lower to increase trade. My first target is .9200 with a stop away from the herd. That’s my 2 pips.
Interesting theory on China :33:
Do you trade CNH?
Next week, there are 11 speeches by Fed policymakers and in light of the fact that general commentary is that the Fed lost credibility by not tapering, it will be particularly interesting to gauge market reactions around these commentaries.

I don’t trade the CNH, but I do trade the currencies affected by it, the AU for instance. China’s growth diminished to around 7.50% in the 2nd quarter of 2013, down from around 7.75%. Internet sources state that several companies in SW China reported a total of 6.34b yuan in industrial output in 2012. On the contrary, initial calculations showed the actual value was far less, around 2.8b yuan. The companies alleged if they did not provide inflated data, then their reports were sent back by local government.
In addition, they have a huge housing bubble going on. That bubble is subject to the same affects that the US felt when it burst. Of course, I don’t expect anyone to agree with what I have to say, but I do encourage them to research for themselves to see what conclusions they draw. That’s my 2 pips.
While the Speculative Sentiment Index (SSI) shows that retail traders are still heavily short SPX 500 (the CFD that tracks the S&P), the recent reduction in short positions and increase in long positions suggests a potential pullback from recent peaks.

The latest SSI reading of -3.41 means that there are 3.41 short positions for every long position. Long positions are 14.7% higher than yesterday and 18.2% above levels seen last week. Short positions are 6.6% lower than yesterday and 8.5% below levels seen last week.

SSI is used as a contrarian indicator to price action. While the the fact that the majority of traders are are still short SPX 500 could be taken as a sign that US stocks could continue higher in the long term, the dramatic reduction in short positions recently suggests a possible pullback in the near term.

If a short position was entered on a break below 1700, then a stop could be set above last week’s high of 1734.1 with a profit target set around the low of 1626.6 that was made towards the end of August.
You make a great point about housing in China. It’s the only sector that’s been going up lately, and that’s only encouraged more speculation. I’m not sure if you were already aware of this, but the Chinese Yuan (CNH) is now available for trading through FXCM UK, if you wanted to trade it directly. We hope to offer CNH trading in the US soon.
Volatility has been relatively light over the past week, but there is massive event risk ahead with 3 central bank announcements and Non-Farm Payrolls next week.

Furthermore, the delay by Congress to raise the debt ceiling may test the current complacency of the market with the S&P 500 and DJIA at all-time highs. This upcoming event risk surrounding the U.S. debt ceiling may have the potential to move markets as it did in 2011 if pushed to the last minute.
The Tidal Shift Strategy on DailyFX PLUS just gave a signal to buy EUR/USD between 1.35266 and 1.35575 (blue dotted lines in chart below) with a trailing stop at 1.34802 (red dotted line).

The signal was issued because our Speculative Sentiment Index (SSI) has hit its most extreme negative level for the past 145 trading hours at -3.0792, which suggests that the EUR/USD could be trending upwards.
The majority of the traders are short now, so going long is not a bad idea. Although the EUR$ will eventually fall, their bond yields are far to attractive to investors. There will have to be that shift in confidence before the EUR will fall. Thats my 2 pips.
The Dow Jones FXCM Dollar Index (ticker: USDOLLAR) has taken a significant step downwards towards today, falling within points of its September and post-FOMC meeting lows as political turmoil in the United States reached a new low with the federal government shutdown.
[B]USDOLLAR Daily Chart[/B]
For those looking to trade a potential US Dollar bounce, it’s interesting to note that unlike most major currencies which are up against the greenback, the New Zealand Dollar is actually slightly down.

In fact, the Momentum2 strategy on DailyFX PLUS is currently giving a signal to short NZD/USD at current levels with a trailing stop at 0.8391.

If you have an FXCM account, you can now automate this strategy by logging into the Mirror Trader platform with your Trading Station username and password.
I think you have the right idea about waiting for a shift. Not only are retail traders short EUR/USD, but the ratio of shorts to longs has actually increased. The latest reading from the Speculative Sentiment Index (SSI) for the EUR/USD stands at -2.75 meaning there are 2.75 shorts for every 1 long. Yesterday the ratio was -2.65; 27% of open positions were long.
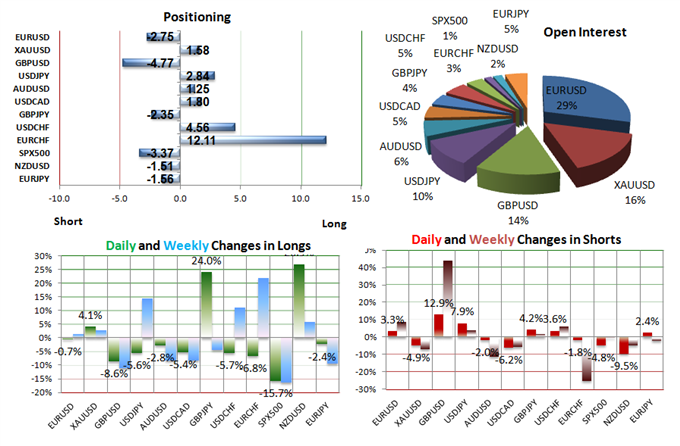
Long positions are 0.7% lower than yesterday and 1.4% above levels seen last week. Short positions are 3.3% higher than yesterday and 8.7% above levels seen last week. Since we use SSI as a contrarian indicator to price action, the fact that the majority of traders are short gives signal that the EUR/USD may continue higher. However, extremely one-sided sentiment can sometimes suggest that a price reversal may be near.
This morning the DailyFX team tweeted about how Gold (XAU/USD) briefly broke below $1300 to flirt with the neckline of a multi-month head and shoulders pattern. If an entry order to sell XAU/USD was placed for a break below the August low of 1272.81, the profit target could be set around the June low at 1180.15.

The stop loss could be set above the 100-day simple moving average at 1338.27. To keep up to date with all their latest trade ideas, you can follow the DailyFX team on Twitter.
Hi Jason,
I can’t see CNH in MT4 (I’ve got a UK account and I’ve clicked “Show All” in Market Watch). Any ideas how I can get the chart up?
Thanks
Hi DayTrader,
I would like to take a look at your specific account settings, so I can determine why you can’t see the Chinese Yuan (CNH) on your MT4 account. For your security, it’s best for you to send me this information via email. Please email your account number to me at <[email protected]> and reference this discussion. I’ll be happy to follow up on this for you.
Jason