1.5430 and then some! The signal ended up closing out at +31.9 pips according to the signal history.
I doubt many readers are following this pair, but the Turkish Lira is not doing well at all. The past few weeks have been tough for emerging market currencies due to fears over Fed tapering. Now you have the situation in Syria right next door to Turkey which certainly can’t help the situation.
This chart is a daily chart of USD/TRY (US Dollar vs. Turkish Lira) for the year and it has risen over 14% for the year. And just today it has jumped 2% higher to new record high.

A couple words of caution if you do plan to trade this pair. The margin requirement is higher since it is an exotic currency and the spread is wider since it is less liquid.
The market in general seems to be on the verge of a potentially volatile movement. If you look at the volatility index as measured by the VIX, it has jumped to a 9 week high. This chart comes from ZeroHedge:

September could be a volatile month!
This chart comes from the @DailyFXEDU twitter account.
GBP/USD bounced off of the 200 period daily moving average presenting a possible bullish opportunity similar to the setup earlier in August.

GBP/USD dipped and then rallied off Mark Carney’s first public speech as governor of the Bank of England. *DailyFX Analyst Christopher Vecchio summed up the results of today’s speech:
THE TAKEAWAY: Governor Mark Carney’s first public speech as Bank of England chief > Emphasizes improving economic recovery contingent on credit growth > BoE intends to keep rates low even if data improves > GBPUSD BULLISH
Read the Full Article *Forex: Dip then Rip: GBP/USD Hits Fresh Daily High on Carney Speech | DailyFX
US Dollar Turnaround the Real Deal. *That’s the headline from today’s weekly SSI release.
For the EUR/USD, David Rodriguez said that it’s been a slow process, but we think the Euro set a substantial top as forex crowd short positions hit a record. The recent pullback in both price and retail forex sentiment confirms the turnaround.
You can see from the below chart how short positions hit a record in July and since then the pair has been pulling back.

You can read the full weekly SSI report here: http://www.dailyfx.com/technical_analysis/sentiment
The DailyFX PLUS Trading Signals also issued a short signal for EUR/USD earlier this morning based on the movement in positioning. Here’s a look at the entry zone and stop loss levels on a chart:

EUR/USD is trading just slightly before the entry zone, and you can see that the 1.3200 level has developed short term support over the previous month.
Login to DailyFX PLUS to view all of the signals in real time.
Next week should be an action packed week for the forex market according to the DailyFX economic calendar. Here’s a look at the events ranked HIGH in importance. It includes 5 central bank rate decisions, Australia GDP, US Non-Farm Payroll, and a whole lot more:

The full weekly economic calendar can be found here: http://www.dailyfx.com/calendar
John Kicklighter, chief strategist at DailyFX.com, recently tweeted about how GBP/JPY is trading near a channel top. He’s considering entering a short position at 154.25 with a stop 100 pips higher at 155.25.

A limit order near the channel bottom around 150.25 would give this trade a 1:4 risk/reward ratio. To keep up with all his latest trade ideas, you can follow John Kicklighter on Twitter.
I entered @154.40 short with a T/P 150.80 and a S/L @ 155.50 and i do like this trade Jason.
This one didn’t pan out for us, but the important thing is the stops limited the downside risk :57:
Things happens from time to time, i’ll just wait for another entry. There will be other opportunities.
Last month Morgan Stanley analysts dubbed Brazil, Indonesia, India, Turkey and South Africa as the Fragile Five saying [I]“Their currencies will be held back by high inflation, large current-account deficits, challenging capital-flow prospects and potentially weak emerging-market growth.”[/I]

source: MarketWatch
Indeed, these headwinds have caused the Fragile Five currencies to take a hit over the past few months, with the US Dollar rising to all-time highs relative to the Indian Rupee (INR). DailyFX senior technical strategist Jamie Saettele now sees possible signs of a reversal for at least one of the Fragile Five, namely the South African Rand (ZAR):
[B]“A head and shoulders top from 8/21 may be unfolding with a weak right shoulder. Below 10.15 would trigger the breakdown.”[/B]

If USD/ZAR breaks below 10.15, stop losses could be set above the head and right shoulder at 10.50635 and 10.36680 respectively. Profit targets could be set around support levels set back in July and August at 9.61220 and 9.72860 respectively.
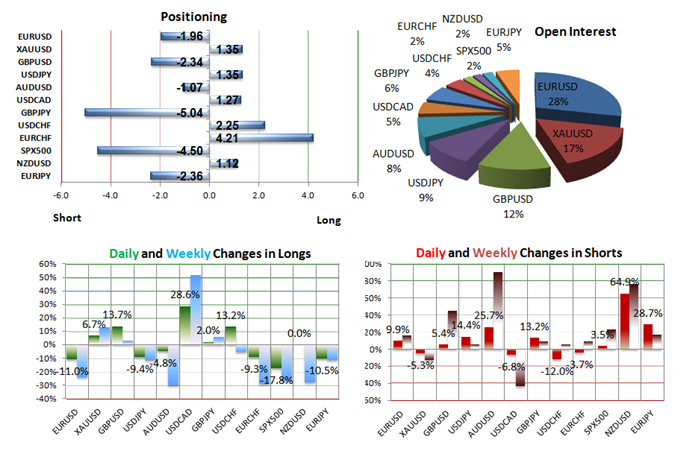
The weekly update of our Speculative Sentiment Index (SSI) was just published on DailyFX.com
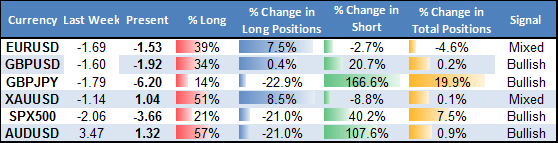
It shows that Japanese Yen buying has surged versus the British Pound.

In fact, forex retail crowds are now their most net-short GBP/JPY in over 2 years.

Since SSI is a contrarian indicator, this is a strong bullish signal for GBP/JPY.

The Momentum1 trading strategy on DailyFXplus.com has just given a signal to buy the pair at current levels with a trailing stop at 154.584
The US unemployment rate dropped to 7.3% when it was expected to remain unchanged at 7.4%, but the US Dollar still tanked on the news. That’s because the main reason for the drop was a shrinking labor force as the participation rate fell to its lowest since August 1978. The headline figure at +169K was also below expectations.

Looking for opportunities to short the US Dollar, we can see that since the NFP announcment, the Tidal Shift Strategy on DailyFX PLUS just bought GBP/USD at current levels with a trailing stop set at 1.55333. The signal was issued because our Speculative Sentiment Index (SSI) has hit its most extreme negative level for the past 145 trading hours at -2.1218, which suggests that the GBPUSD could be trending upwards.
[B]The Tidal Shift Strategy can be automated on FXCM Trading Station accounts by logging into the Mirror Trader platform with the account username and password.[/B]
The DailyFX PLUS trading signal from last Thursday to buy GBP/JPY has worked out well so far. In fact, the British Pound continues to look strong across the board. This morning DailyFX analyst Alejandro Zambrano tweeted about his latest trade idea to go long the currency versus the Swedish Krona (SEK).

According to him “A correction to 1.3850 will most likely be used by traders to enter new long positions. We should be able to reach 1.44 which is the prior high as long as we trade above 10.35”. To always receive his latest trade ideas, you can follow Alejandro Zambrano on Twitter.
In addition to the DailyFX trading signals, the Mirror Trader platform lets you see signals from hundreds of third-party trading strategies and not just for currencies. For example, FXcn1985.cn is a strategy that trades the SPX500, a CFD based on the S&P 500 index.

While past performance is not necessarily indicative of future results, the strategy currently has a T-Score of 9.72 (on a scale of 1 to 10) meaning that according to Mirror Trader’s unique scoring method, it has a high relevancy to current market conditions, which may be of interest to people following the US stock market.

If you have a live FXCM account, you can use your Trading Station login to access the Mirror Trader platform. From there you can choose this strategy or others for automation or semi-automation. With automation, trades are automatically placed in your account. With semi-automation, you receive an alert when a trading signal is generated, so can decide then whether you want to mirror the trade in your account.
In the past, we’ve seen USD/JPY drop as tensions have escalated regarding Syria, because the Japenese yen is seen as a safe haven when traders are risk averse. So it makes sense that today with possible signs of progress to avoid military conflict, the US dollar is gaining strongly versus the yen.

USD/JPY is already up 100 pips for the day, but according to our Speculative Sentiment Index (SSI) it could climb further. The Tidal Shift Strategy on DailyFXplus.com has just bought USD/JPY at current levels with a trailing stop set at 99.673.
The signal was issued because SSI has hit its most extreme negative level for the past 145 trading hours at 1.352, which suggests that the USD/JPY could be trending upwards. The Tidal Shift Strategy can be automated on your FXCM account by logging into the Mirror Trader platform with your Trading Station username and password.
Positive employment data out of the UK sent cable (GBP/USD) to its highest levels in seven months. We use our Speculative Sentiment Index (SSI) as a contrarian indicator to price action, and the fact that the majority of traders are short gives signal that GBP/USD may continue higher.

The latest SSI readings on DailyFXplus.com show that the ratio of long to short positions in GBP/USD stands at -2.77 as 27% of traders are long.

Yesterday the ratio was -2.56; 28% of open positions were long. Long positions are 4.4% lower than yesterday and 5.3% below levels seen last week. Short positions are 3.4% higher than yesterday and 53.6% above levels seen last week.

The trading crowd has grown further net-short from yesterday and last week. The combination of current sentiment and recent changes gives a further bullish trading bias.

It’s no surprise then that two SSI-based trading signals (Breakout2 and Momentum2) are currently holding long positions in GBP/USD. Both of these trading signals are available as automated strategies at FXCMapps.com
Retail forex traders are their most heavily long the Japanese Yen versus the British Pound (short GBP/JPY) since 2011, and very heavily one-sided sentiment leaves DailyFX quantitative strategist David Rodriguez in favor of further Yen weakness across the board.
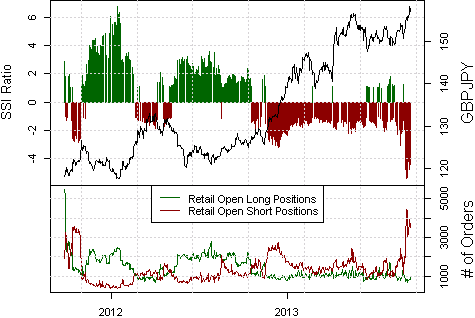
The graph above shows the power of the Speculative Sentiment Index (SSI) as a contrarian indicator. Notice how GBP/JPY has traditionally risen when traders are net short (when SSI is negative).
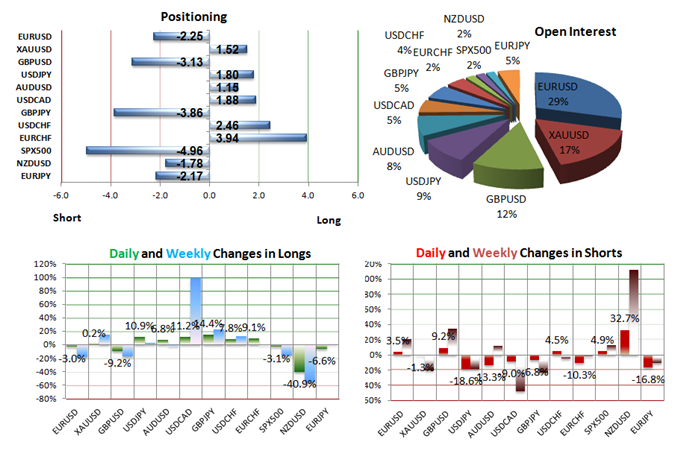
Currently, the ratio of long to short positions in GBP/JPY stands at -3.86 (meaning there are 3.86 short positions for every 1 long position) as 21% of traders are long. Since we use our SSI as a contrarian indicator to price action, the fact that the majority of traders are short gives signal that GBP/JPY may continue higher.

If a long position was entered at current levels, then the stop could be placed below support at 154.123 with profit targets around the Fibonacci extension levels at 159.411 and 162.762.
UK Oil is the CFD that tracks Brent Crude, and this morning the DailyFX education team tweeted about a possible signal to buy. The price has bounced off support while stochastics have crossed above 20.

Their trade setup calls for an entry order to buy placed at 111.85 with a limit at 114.96 and a stop at 110.20. To always receive their latest trade ideas, you can follow the DailyFX education team on Twitter.
The Dow Jones FXCM Dollar Index (ticker: USDollar) set a significant 58 point gap between Friday’s close and Monday’s open, following a weekend headline that Lawrence Summers withdrew his bid to take over as Fed Chairman in January.
USDollar 15-Minute 08:00 09/13 to 08:00 09/16 EST

Summers was considered to be the frontrunner against the more-dovish candidate Janet Yellen. Therefore, news that Summers was no longer in the running for the position weakened the US Dollar against the major currencies, particularly the Australian dollar.

If a long position was entered in AUD/USD at current levels, then a stop could be set below 0.92717 where the market was trading before the weekend gap. A profit target could be set around 0.95094, the 38.2% Fibonacci retracement level for the high set back in April.
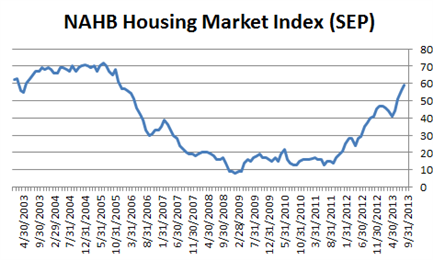
The flat print of 58 on the NAHB Housing Market Index (the highest seen since 2005) confirmed resilience in the US housing market despite rises in mortgage rates by almost an entire percent since May.
This sent the US dollar even higher after Net Long-term TIC Flows for July gave the greenback a boost following the US open earlier. Foreign investors piled into Treasuries during the month of July with the net Long-term TIC Flows posting a positive print for the first time since January.
[B]Dow Jones FXCM Dollar Index (Ticker: USDOLLAR) (5-Minute Chart)[/B]
Despite the positive news for the US dollar today, the gains could be temporary. The latest readings from the Speculative Sentiment Index (SSI) show that traders are long US dollars across the board. Since SSI is a contrarian indicator, this is a strong signal to short USD.

Traders are particularly long the USD/CAD pair, so it’s understandable that the sentiment-based Breakout2 strategy has just given a trading signal to short the pair at current levels.

FXCM accounts can automate this strategy by using the Mirror Trader platform. You can access Mirror Trader with the same login and password you use for Trading Station.