[B]DailyFX Top Trading Opportunities of 2012[/B]
[U][B]Ilya Spivak[/B][/U]
[ul]
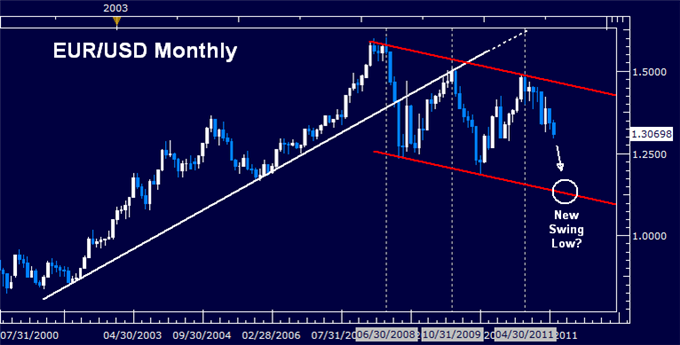
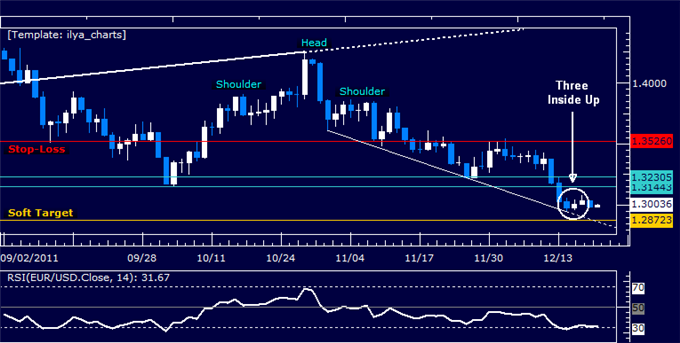
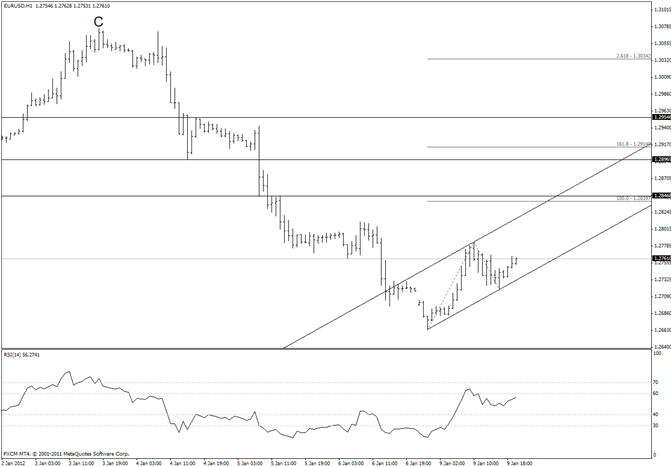
[li]Short EURUSD: The Multi-Year Euro Downtrend Continues
[/li][/ul]
Broadly speaking, the Euro has been trending lower since July 2008 having peaked above 1.60 against the US Dollar. More of the same seems almost certainly ahead. The Eurozone debt crisis remains unresolved, presenting a two-pronged problem. On one hand, it amplifies already considerable headwinds facing economic growth. Soaring borrowing costs amid fears of a default within the currency bloc stymie activity as individuals and businesses find it more expensive to spend and invest. In turn, slower growth reduces regional governments’ tax intake, making it harder to reduce deficits, stoking already considerable sovereign solvency fears and producing a vicious cycle. Economists’ consensus forecasts suggest growth in the Euro Zone will stall in 2012 and recovery only modestly in the following year. Meanwhile, growth in the US is expected to accelerate over the same period. This beckons aggressive monetary stimulus from the ECB, suggesting interest rate differentials will narrow firmly in favor of the US Dollar even if the Federal Reserve opts to make good on its promise to keep benchmark borrowing costs on hold through mid-2013.
On the other hand, it threatens to unleash another market-wide selloff and global credit crunch, plunging worldwide finance into another existential crisis just three years after the 2008 debacle. In the event of a default in a large country like Italy or Spain countless banks, funds and other institutions would be forced to book sharp losses. For some, taking such a hit will prove unbearable and they will be forced to go out of business, sending ripple effects across the markets as their creditors now face losses, and so forth. Those that remain standing will rush to raise new capital, with banks and funds dumping assets at fire-sale prices to meet reserve and margin requirements. This translates into another broad-based rout across asset classes, erasing incalculable amounts of firms’ and individuals’ wealth. It goes without saying that such an outcome would outright crush private-sector economic activity on a global scale. Needless to say, such an outcome bodes very well for safe-haven currencies and in particular for the US Dollar, where official intervention does not undermine its store-of-value properties (as is the case with the Japanese Yen and Swiss Franc, typically the other go-to safety vehicles in the FX space).
[B]Jamie Saettele[/B]
[ul]
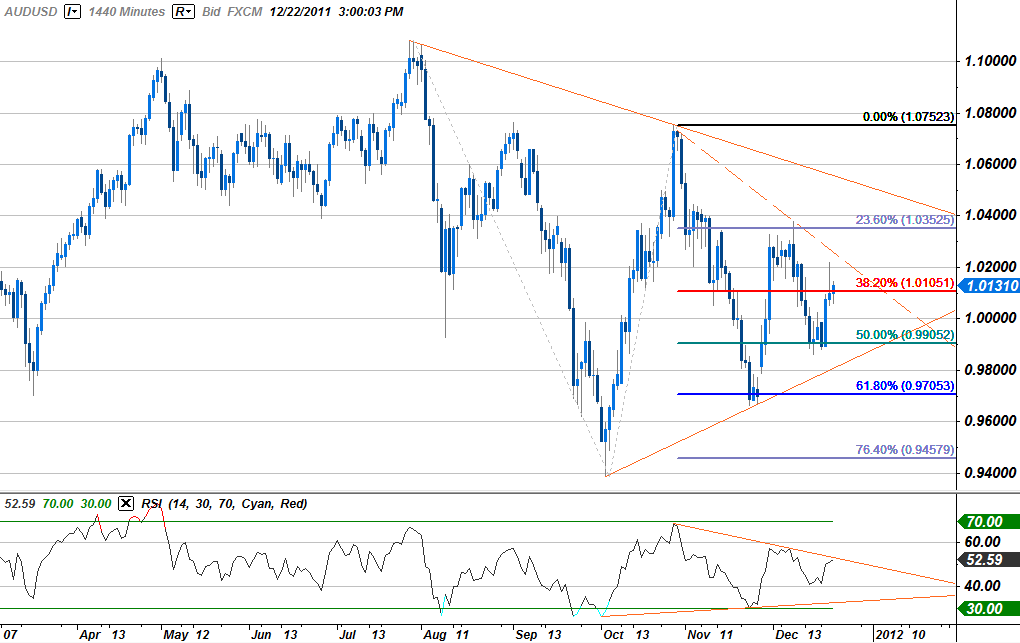
[li]Short AUDUSD and Short NZDUSD: Strong Evidence of Long Term Reversals
[/li][/ul]
A scan of yearly and quarterly charts reveals reversal opportunities in the USDCHF (yearly and quarterly), AUDUSD (quarterly), NZDUSD (quarterly), and USDCAD (quarterly). I define a reversal with yearly data as a new 5 year high/low, a close above/below the prior year’s close, and a range for the year that is at least as large as the average range for the last 5 years. A reversal with quarterly data uses 12 periods (3 years) (for monthly 12, for weekly 13, and for daily 20). No method is immune to false signals, but key reversals indicate favorable reward/risk opportunities because a potentially significant pivot (high or low) is identified with minimal lag (when viewed in the context of the time frame being analyzed).
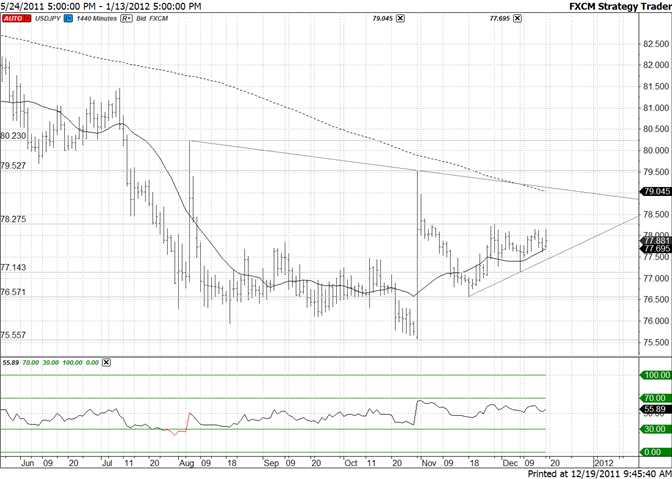
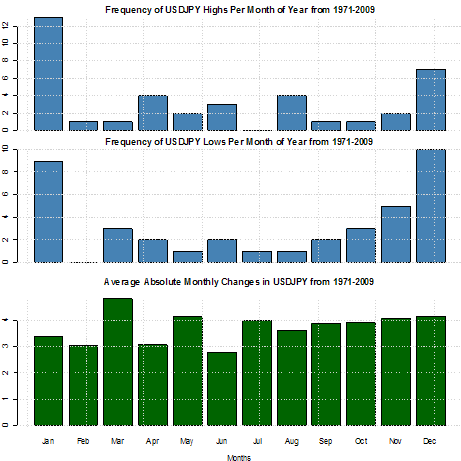
Many decade long turns have been indicated by yearly or even quarterly key reversals. The study also highlights the tendency for exchange rates to reverse during high volatility environments (hint – USDJPY volatility is NOT high which decreases the probability that an important low is in place).
AUDUSD QUARTERLY CANDLES (since 2000)
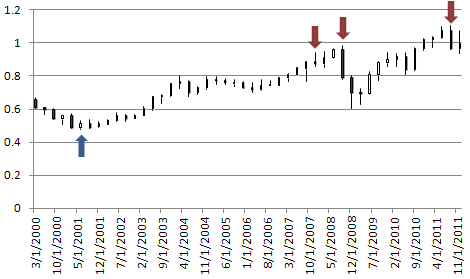
[I]Created by Jamie Saettele, CMT[/I]
A bullish reversal occurred in the 2nd quarter of 2001. Bearish reversals occurred in the 4th quarter of 2007 and the 3rd quarter of 2008. The 2007 reversal didn’t pan out. Price fell another 1900 pips (to the low) after the 2008 reversal (close to close was 897 pips). The most recent reversal occurred during the 3rd quarter of 2011.
NZDUSD QUARTERLY CANDLES (since 2000)
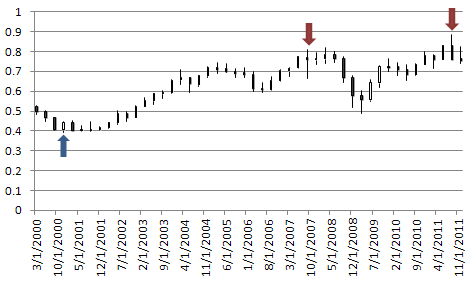
[I]Created by Jamie Saettele, CMT[/I]
A bullish reversal occurred in the 4th quarter of 2000. Bearish reversals occurred in the 3rd quarter of 2007 and the 3rd quarter of 2011. The 2007 reversal didn’t pan out immediately as the actual high was not until the 1st quarter of 2008.
The most recent large degree reversals paint a picture of USD strength in 2012. Unless your holding period is a year or more (Ilya), I do not suggest treating these reversals as signals. Rather, understand that conditions for the pairs examined are consistent with previous long term reversals. This knowledge should help in constructing favorable reward/risk opportunities in 2012.
Source: http://www.dailyfx.com/forex/market_alert/2011/12/24/DailyFX_Top_Trade_Opportunities_of_2012.html

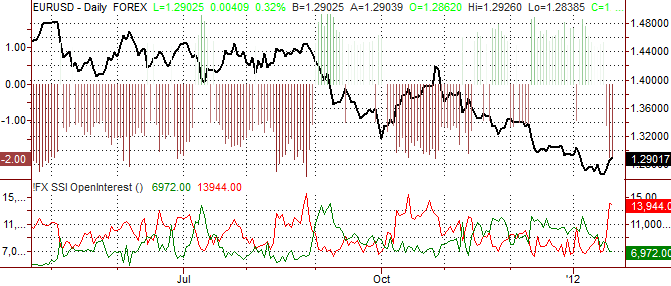
 and shows the net positioning of FXCM’s retail clients. If you look at FXCM’s monthly operating metrics, FXCM clients tend to do about 13-16 billion in notional volume per day to give you an idea of the numbers.