FXE Longer Term Cycles and Elliott Wave
Firstly as seen on the weekly chart shown below the instrument made a high in April 2008. There is data back to December 2005 in the ETF fund. Data correlated in the EURUSD foreign exchange pair suggests the high in April 2008 was the end of a cycle up from the all time lows. EURUSD data shows the pair had a five wave up move from the early 1970’s era. This data is derived from the German Mark currency against the US Dollar that preceded the inception of the Euro currency.
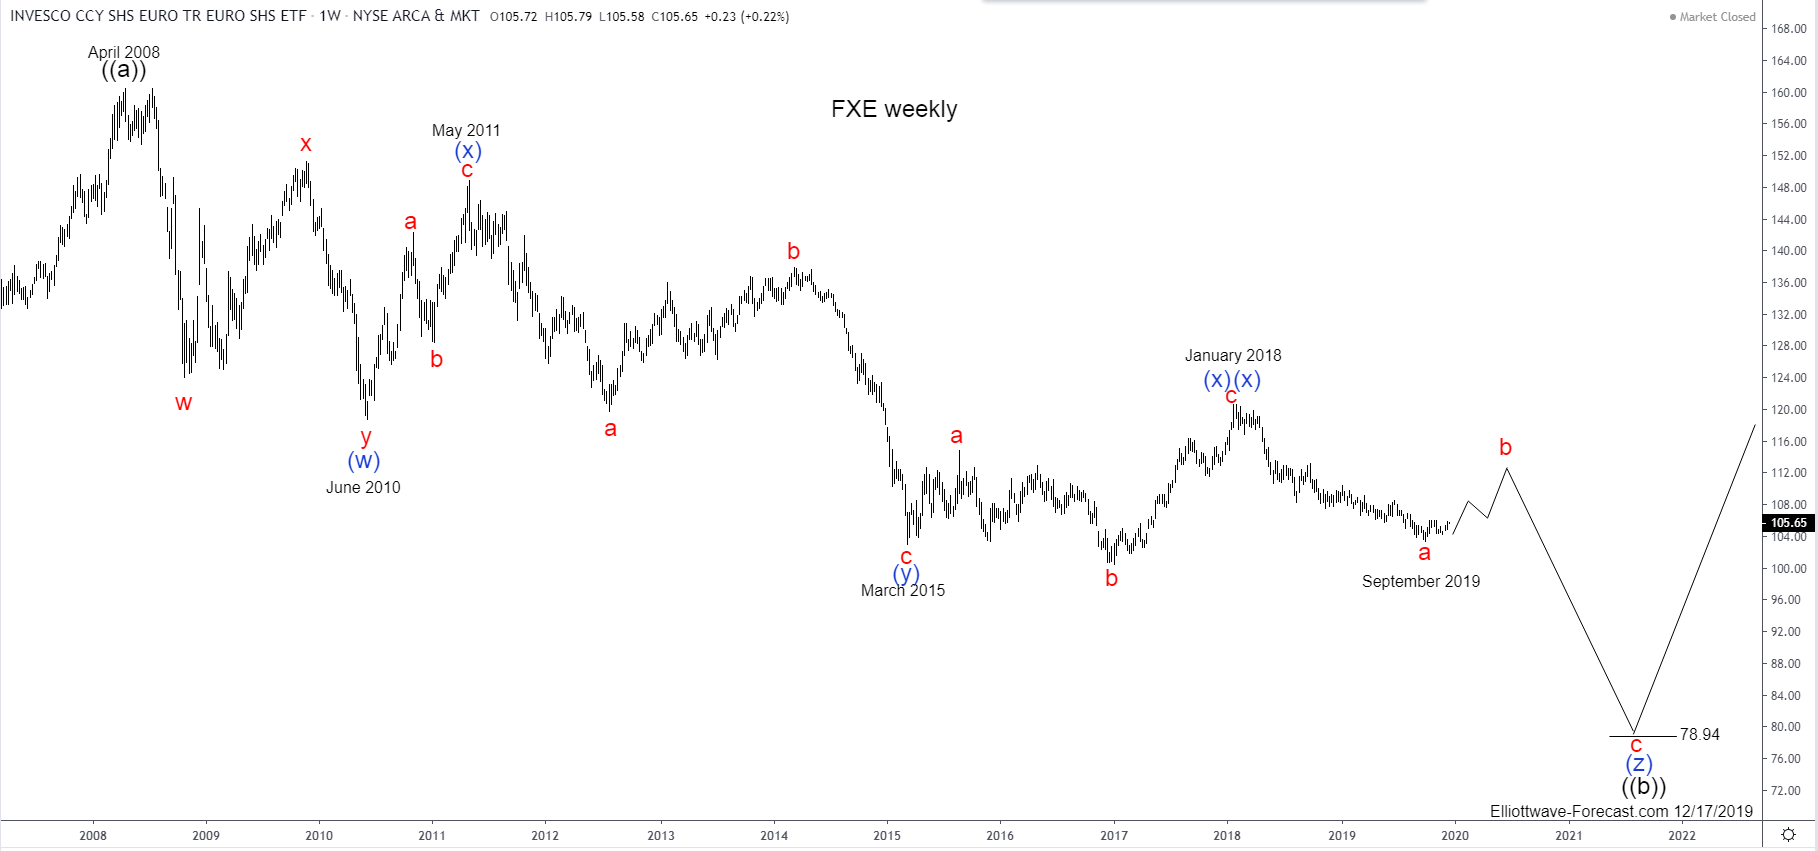
As you can see the FXE instrument reflects the price swings of the single currency well. As previously mentioned the instrument made a high in April 2008. This where the analysis begins on the weekly chart shown below. The correction from those highs appears to be a an Elliott Wave triple three structure correction. The analysis continues below the weekly chart.

Secondly as mentioned the decline from the April 2008 highs appears to be an Elliott Wave triple three structure. The cycle lower from there does not count well as an impulse although there is a such thing as a diagonal that subdivides in five three swing moves in the direction of that cycle. When a cycle ends against a trend it will show in momentum indicators usually before price makes it obvious. These cycle highs and lows are in the blue color as shown on the chart above (w)-(x)-(y) & potential (z) to come later.
Lastly in conclusion as said the structure lower from the 2008 highs appears to be a triple three Elliott Wave structure. The instrument currently appears ended a cycle lower from the January 2018 highs. It should be able to further develop a bounce higher to correct the cycle from the January 2018 highs while above the late September 2019 lows. As of now the best guess would be to around the 112.00-114.00 area in the red wave b. While below the January 2018 highs a long term low can be seen. This is the 78.94 area where the wave (z) in blue is equal in length to the wave (w).