The highly anticipated meeting between the U.S. and China during G20 meeting in Japan has concluded. Both parties agree to resume the trade talks and the U.S also agreed to put on hold additional tariffs on $325 billion Chinese goods for the time being. The U.S. previously has threatened to slap 25% tariffs on all remaining Chinese goods imported to the U.S.
So far, the U.S. has raised tariffs on $250 billion of Chinese imports to 25%. In return, China has imposed 25% tariffs on $60 billion of American goods in a tit-for-tat. President Trump also signaled that he will allow U.S. firms to continue selling products to China’s Huawei. He added however that the sales would be fine for equipment which does not pose national-emergency problem.
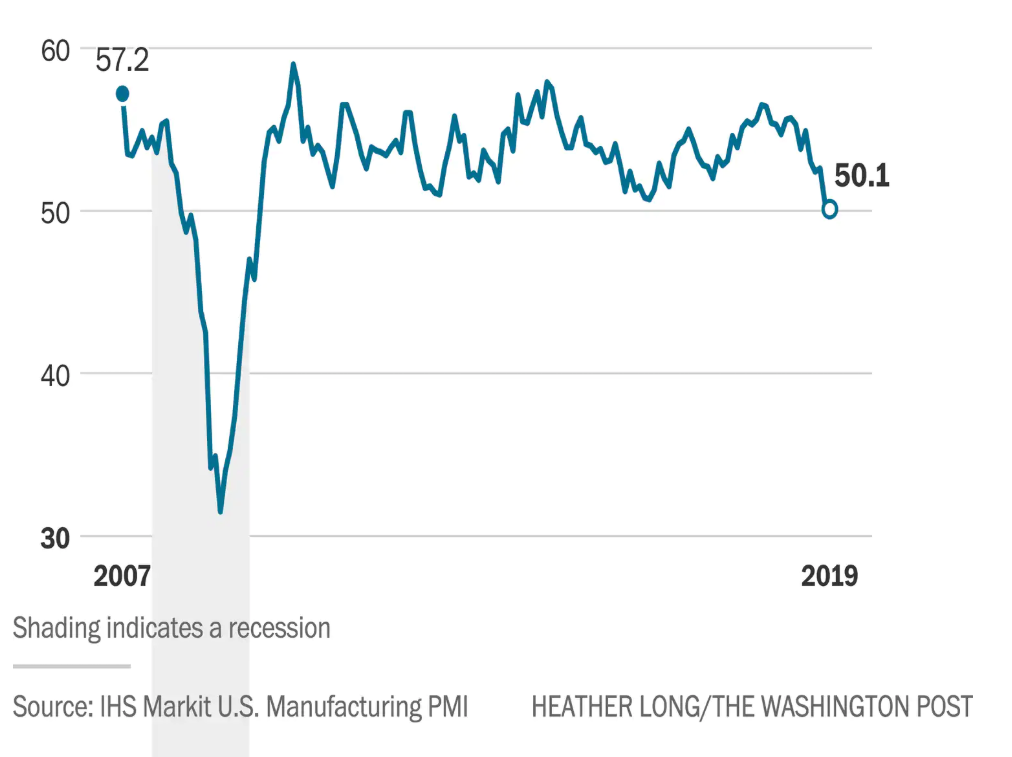
The temporary truce will buy time for the negotiators to finalize the deal. There’s no specific timeline or deadline that the U.S. demanded for the truce. With 2020 election looming, President Trump understands the trade dispute can carry immense political risk. Some recent economic data from the U.S. however paints a slowdown in the economy. In June, PMI (Purchasing Manager Index) fell to 50.1, the worst reading since 2009. A reading below 50 usually signals contraction and recession in the economy.
The U.S. however appears to also have made progress. President Trump said that China will resume some of its purchase of American farm goods even when the U.S. still keeps in place the 25% tariffs.
Despite the good news, the current dispute is still ongoing and the tariffs are still in place. The longer the tariffs are in place, the worse the global economy will be. In addition, there’s no certainty that the U.S. and China would come into accord soon, if at all. Nonetheless, the market may cheer the positive development and market sentiment may get a boost next week.
G20 Temporary Truce May Boost Market Sentiment and Support S&P 500 Futures
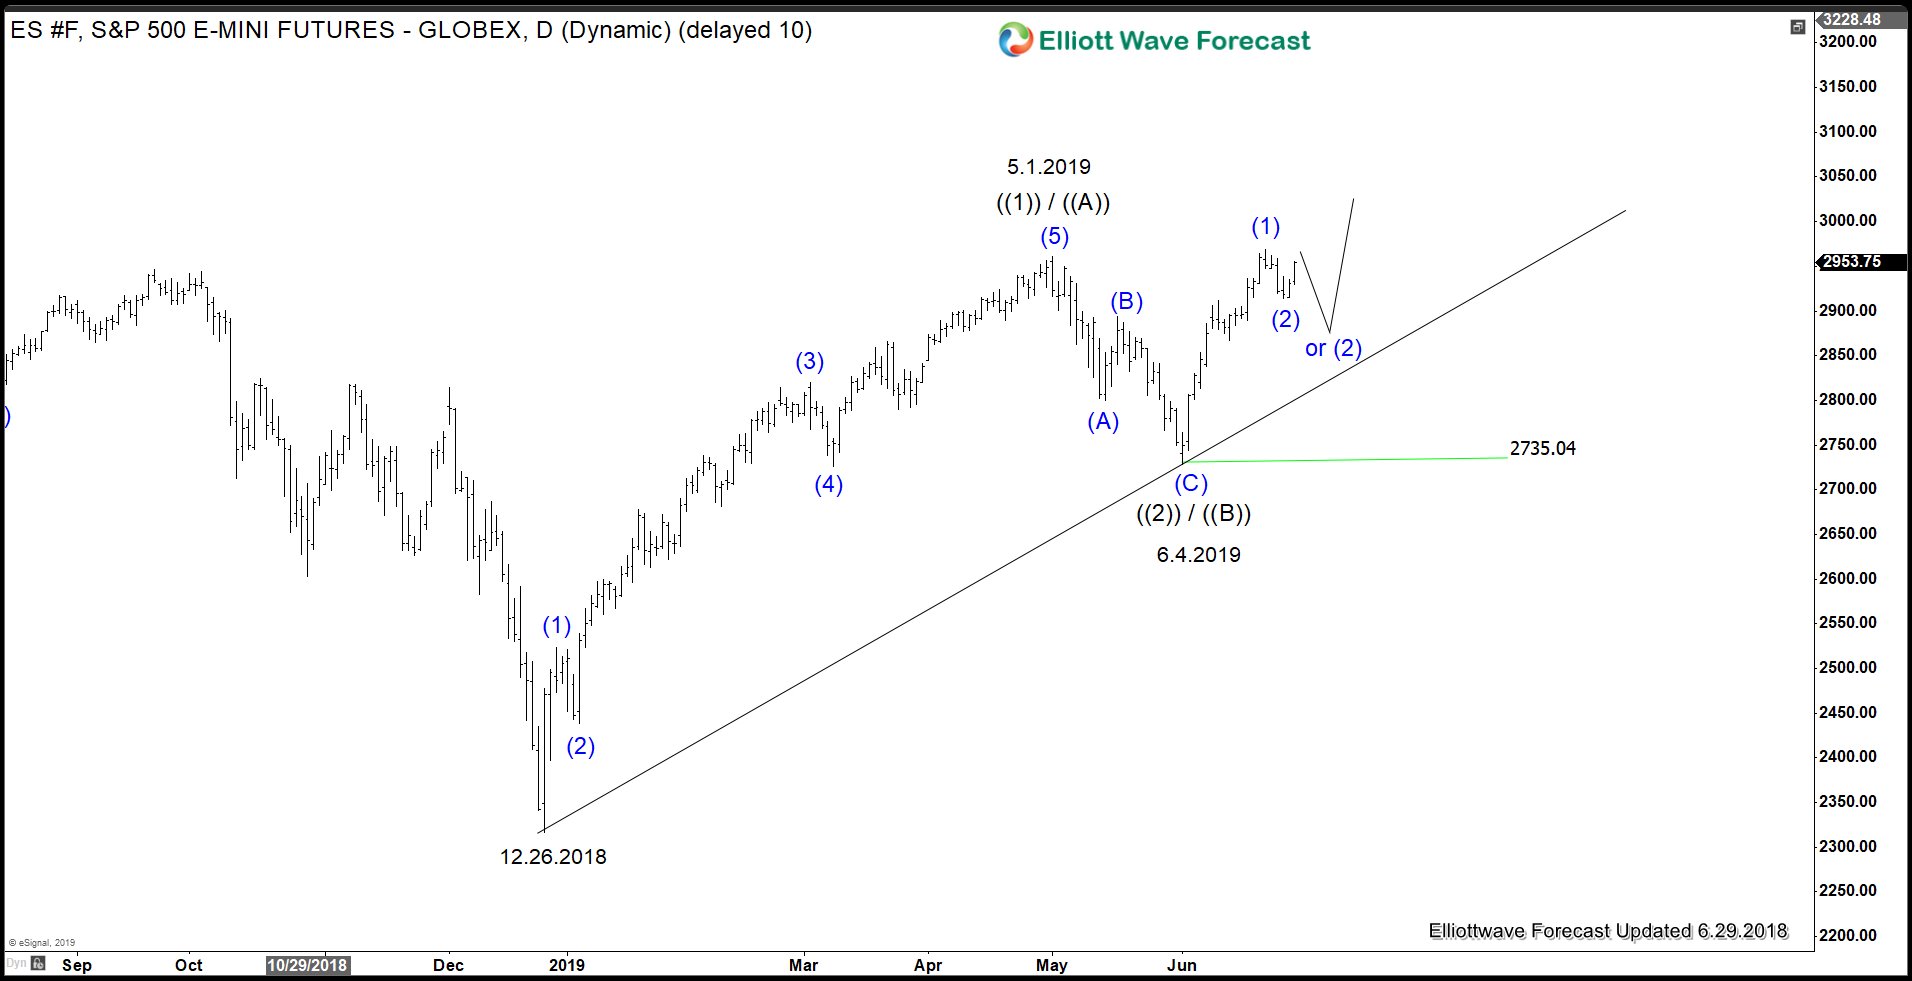
Market participants seem to position themselves for a good outcome ahead of the G20 meeting. S&P 500 Futures (ES_F) chart above shows a bullish sequence (higher high sequence) from December 26, 2018 low favoring more upside. The rally from December 26, 2018 low to May 1, 2019 high unfolded as an impulse Elliott Wave structure. Thus, the rally can either be wave ((1)) or wave ((A)) as the subdivision is in 5 waves. The Index ended the correction on June 4, 2019 low in 3 waves. The correction can either end wave ((2)) or ((B)). The Index has since rallied and broke above May 1, 2019 high suggesting the next leg higher has started.
Unless the marginal high above May 1, 2019 high is a wave (B) of expanded Flat, then the Index should continue to see more upside as far as pullback remains above June 4, 2019 low (2735). Next week, if ES_F is able to break above June 21 high (2969.25), then it suggests wave (3) has already started. Alternatively, Index still can do another leg lower within wave (2) of ((3)) as a double correction before the rally resumes.