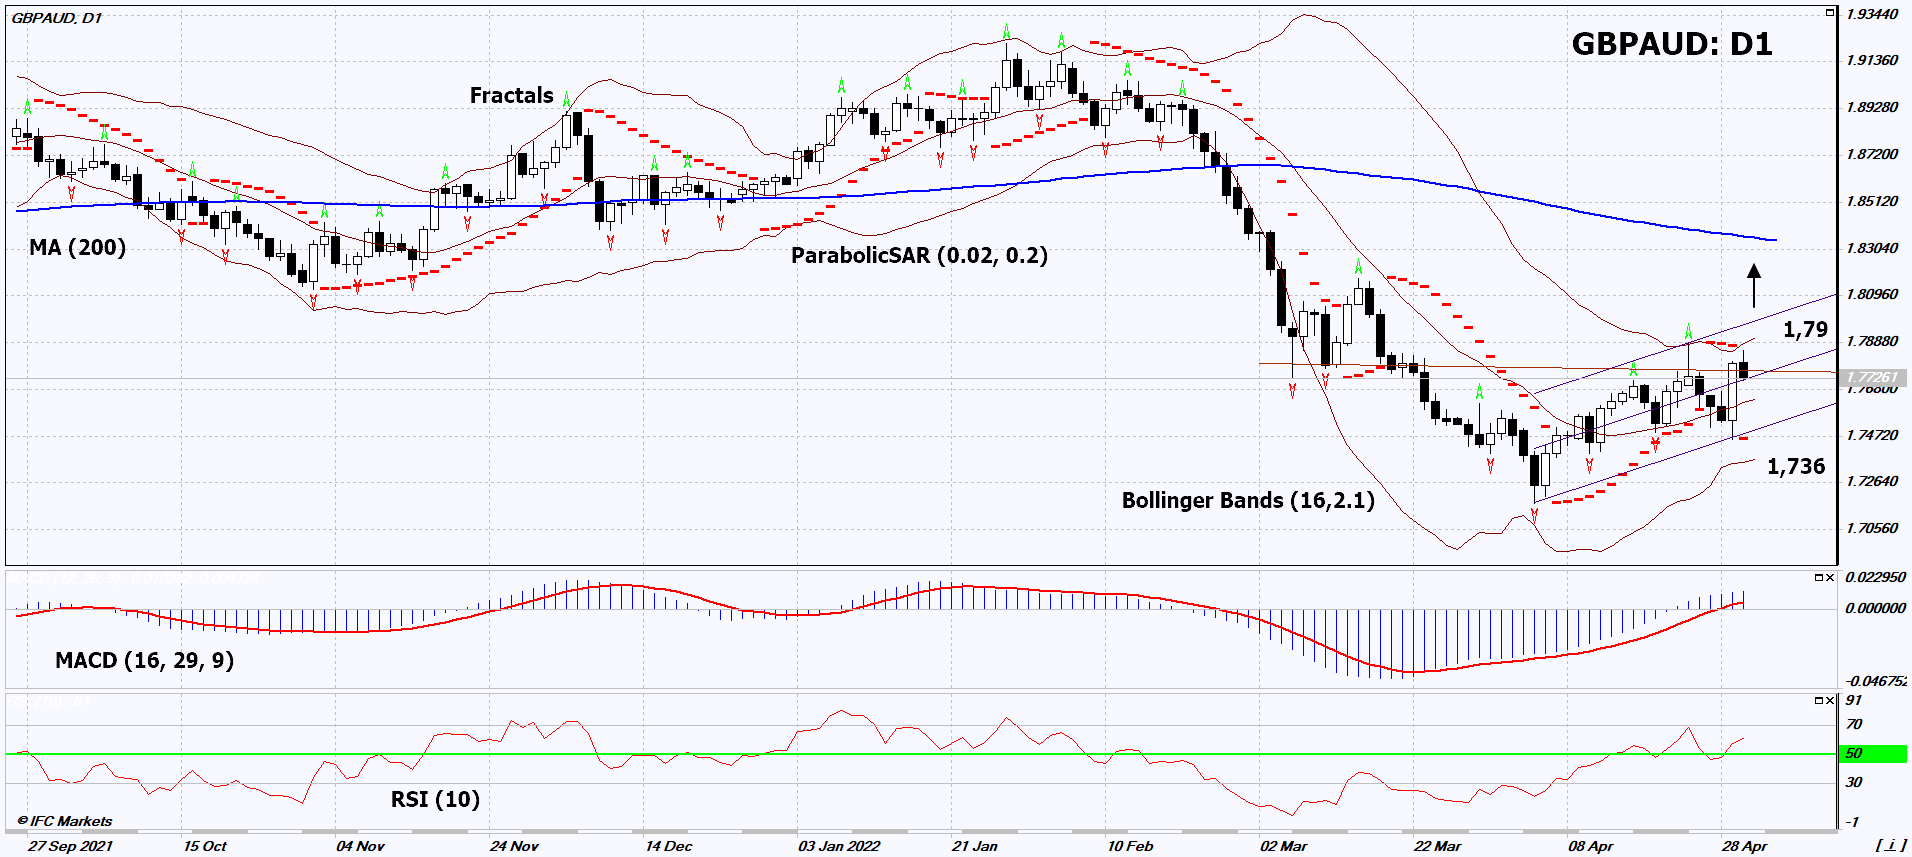
GBP/AUD Technical Analysis Summary
Buy Stop։ Above 1.79
Stop Loss: Below 1.736
| Indicator | Signal |
|---|---|
| RSI | Neutral |
| MACD | Buy |
| MA(200) | Neutral |
| Fractals | Neutral |
| Parabolic SAR | Buy |
| Bollinger Bands | Neutral |
GBP/AUD Chart Analysis

GBP/AUD Technical Analysis
On the daily timeframe, GBPAUD: D1 is moving towards the upper border of the growing price channel. A number of technical analysis indicators formed signals for further growth. We do not rule out a bullish movement if GBPAUD: D1 rises above its latest up fractal and upper Bollinger band: 1.79. This level can be used as an entry point. Initial risk cap is possible below the Parabolic signal, the last 2 down fractals and the lower Bollinger band: 1.736. After opening a pending order, we move the stop following the Bollinger and Parabolic signals to the next fractal low. Thus, we change the potential profit/loss ratio in our favor. The most cautious traders after making a trade can switch to a four-hour chart and set a stop loss, moving it in the direction of movement. If the price overcomes the stop level (1.736) without activating the order (1.79), it is recommended to delete the order: there are internal changes in the market that were not taken into account.
Fundamental Analysis of Forex - GBP/AUD
This week the meetings of the central banks of Australia and Britain will be held. Will the GBPAUD quotes continue to rise?
The meeting of the Reserve Bank of Australia (RBA) will be held on May 3, Tuesday morning. Inflation in Australia was 5.1% y/y in the 1st quarter of 2022. If the RBA does not raise the rate, then this may have a negative impact on the Australian dollar. It is difficult to predict the decision, since parliamentary elections will be held in Australia on May 21. Depending on their results, the government may change. However, some market participants do not rule out an increase in the RBA rate to 0.25% from 0.1%. The Bank of England (BoE) will meet on May 5th. Theoretically, it is possible to increase its rate to 1% from 0.75%. British inflation is larger than Australian inflation, but it is published monthly rather than quarterly. In March, inflation in Britain amounted to 7% y/y. April data will be released on May 18. In Australia, inflation for the 2nd quarter will be published only at the end of July.